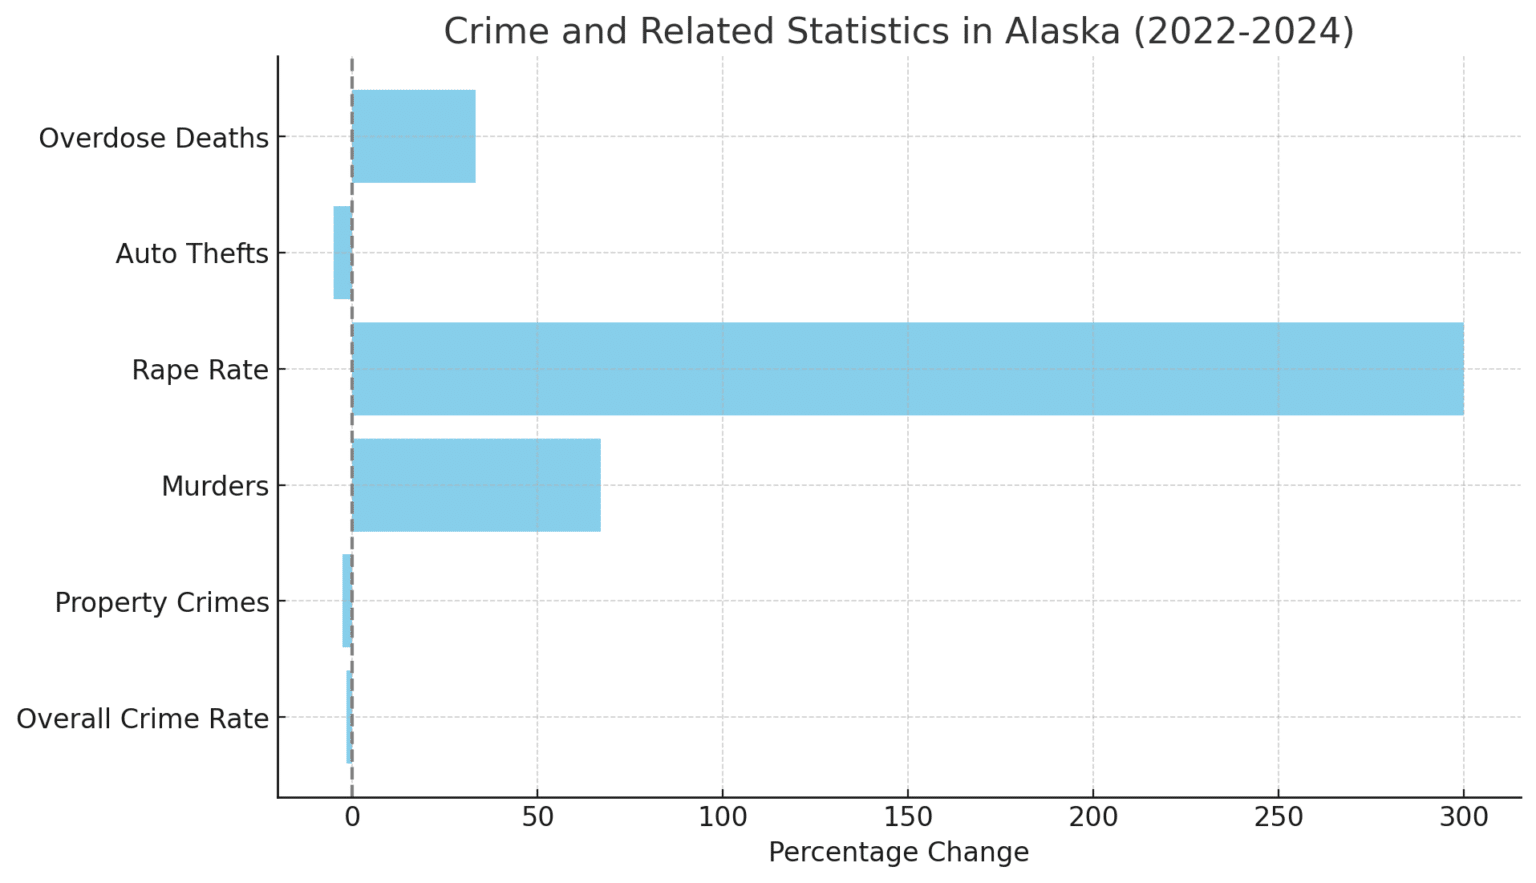
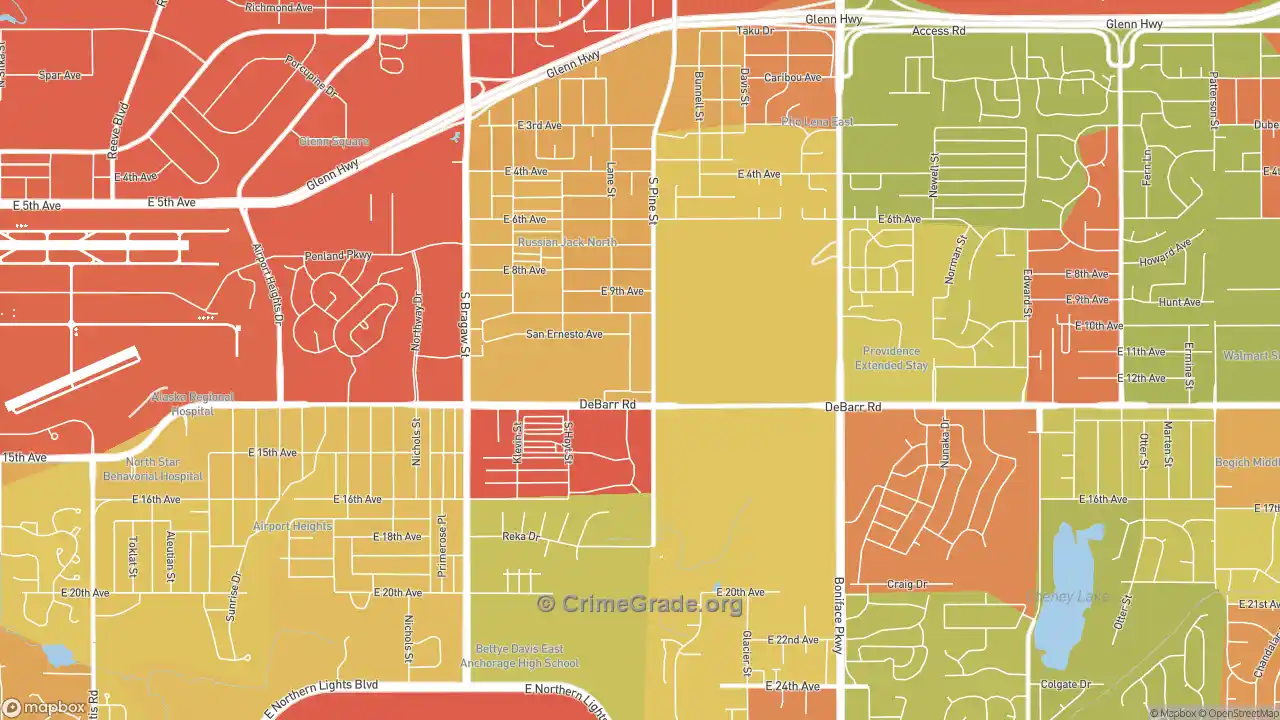
An Anchorage crime map visualizes reported law enforcement incidents across the Municipality of Anchorage using geographic data from the Anchorage Police Department (APD) and third-party aggregation platforms. These maps allow residents, home buyers, and visitors to track offense types, map pins, and spatial trends, providing essential context regarding local safety, reporting delays, and neighborhood-specific data.
How Anchorage Crime Mapping Works and Primary Data Sources
Crime mapping in Anchorage relies on spatial data generated whenever law enforcement responds to an incident or processes a citizen report. The Municipality of Anchorage and the Anchorage Police Department (APD) feed public records into digital mapping engines to create visual representations of criminal activity across the city’s vast geographic area—stretching from Eklutna in the north to Portage in the south.
Understanding where this data originates is critical for accurate interpretation. The primary engine behind public-facing interactive maps in Anchorage is third-party software integration, primarily platforms such as CrimeMapping.com, which directly ingest automated data feeds from the APD’s Computer Aided Dispatch (CAD) and Records Management Systems (RMS).
- Incident Occurs / Call Received
- APD Computer Aided Dispatch (CAD) & Records System
- Privacy Filtering & Geocoding (Block Level Redaction)
- Public Interfaces: CrimeMapping.com / Muni GIS Data Portal
CAD vs. RMS Data Inputs
Not all points on a crime map represent confirmed criminal acts.
- Calls for Service (CAD Data): Generated when a citizen dials 911 or 311, or when an officer initiates a traffic stop or field response. CAD entries reflect reported incidents prior to investigation. A mapped call for "suspicious activity" or "assault in progress" may ultimately be resolved as an unfounded alarm or a non-criminal dispute.
- Verified Offense Reports (RMS Data): Updated after an responding APD officer completes a formal police report confirming that a criminal offense occurred under Alaska Statutes or Anchorage Municipal Code. Verified records carry higher analytical weight than initial dispatch logs.
Privacy Redactions and Geocoding
To protect victim confidentiality and legal integrity, crime mapping systems do not display exact residential addresses. Instead, the software uses a spatial blurring technique known as block-level geocoding.
For example, an incident occurring at a specific house on W 4th Avenue will be mapped to the "400 Block of W 4th Avenue" or shifted to the nearest public intersection. Furthermore, sensitive crimes—such as sexual assault, incidents involving minors, and domestic violence—are routinely excluded or categorized under broad, anonymized headings in public mapping layers to comply with privacy laws and victim-protection mandates.
How to Read and Filter an Anchorage Crime Map
Interactive mapping tools offer numerous filters, overlays, and search parameters. Navigating these tools correctly ensures you gather accurate information rather than misinterpreting raw visual density.
ANCHORAGE CRIME MAP INTERFACE
- OFFENSE FILTERS
- Property Crimes
- Violent Crimes
- Quality of Life
- TEMPORAL FILTERS
- 24 Hours / 7 Days
- 30 Days / 90 Days
- Custom Range
1. Categorizing Offense Types
Most digital crime maps group offenses into three distinct functional tiers. Isolating these tiers prevents minor non-violent infractions from skewing your perception of physical safety.
- Property Crime: Includes motor vehicle theft, larceny-theft, residential burglary, commercial burglary, vandalism, and property destruction. In Anchorage, property crimes account for the vast majority of all mapped pins.
- Violent Crime: Encompasses aggravated assault, robbery, homicide, and weapons violations. Tracking violent crime pins yields a clearer picture of personal security risks in a given sector.
- Quality of Life & Disturbance: Captures noise complaints, public intoxication, trespassing, drug/narcotic offenses, and traffic infractions. High concentrations often highlight active commercial hubs, nightlife corridors, or transit centers rather than dangerous residential streets.
2. Selecting Appropriate Timeframes
A common error when evaluating an Anchorage crime map is relying on a default 7-day or 14-day window. Short timeframes are prone to dramatic statistical noise; a single multi-car break-in event at an apartment complex can make a low-crime area appear as a sudden hotspot.
To establish true baseline safety trends, adjust the temporal filter to a 90-day, 180-day, or 12-month historical window. Multi-month windows smooth out temporary spikes and highlight consistent pattern zones.
3. Understanding Alaska Seasonal Variations
Crime patterns in Southcentral Alaska fluctuate significantly with daylight hours and weather conditions. During the long daylight hours of summer, increased pedestrian mobility and tourism coincide with elevated property crime and public disturbance reports.
Conversely, severe winter weather and limited daylight alter police dispatch patterns and outdoor pedestrian activity. When reviewing mapping data across different seasons, compare summer months to summer months and winter months to winter months to obtain valid year-over-year comparisons.
Geographic Breakdown: Anchorage Neighborhood Safety Profiles
The Municipality of Anchorage covers more than 1,900 square miles, combining dense urban cores, suburban subdivisions, and sprawling semi-rural mountain valleys. Interpreting a crime map requires understanding how urban infrastructure influences incident volume across distinct commercial and residential zones.
MUNICIPALITY OF ANCHORAGE
- DOWNTOWN / MIDTOWN
- High Commercial Density
- Nightlife & Transit Hubs
- High Property & Disturbance
- EAST ANCHORAGE
- High Residential Density
- Mix of Retail & Apartments
- Elevated Property Incident Pins
- SPENARD / UNIVERSITY
- Mixed Commercial/Residential
- Corridor Traffic & Pedestrian
- SOUTH ANCHORAGE / HILLSIDE
- Low Density / Single-Family
- Low Map Pin Density
Downtown and Midtown Commercial Corridors
Downtown (1st Avenue through 15th Avenue) and Midtown (Northern Lights Boulevard down to Dimond Boulevard) consistently display dense clusters of crime map pins.
- Why the Pin Volume is High: These areas host high concentrations of commercial businesses, hotels, transit centers, social service facilities, and nightlife venues. High daytime worker and tourist populations increase the overall volume of calls for service.
- Primary Offense Patterns: Commercial shoplifting, vehicle break-ins, trespassing, minor assaults related to night establishments, and public order disturbances dominate these areas.
East Anchorage (Mountain View, Russian Jack, Muldoon)
East Anchorage features a mix of high-density multi-family residential complexes, commercial strip malls, and public parks.
- Primary Offense Patterns: Map data for these neighborhoods generally reflects higher rates of residential property theft, vehicle break-ins, and domestic disputes relative to lower-density outer suburbs.
- Context: Community-led initiatives and localized policing efforts frequently target specific multi-block sectors in Mountain View and Russian Jack to reduce violent offense rates and address property crime clusters.
West Anchorage and Spenard
Spenard presents a mixed-use environment linking Downtown with Ted Stevens Anchorage International Airport.
- Primary Offense Patterns: Map pins in Spenard often cluster along primary arterial roads, such as Spenard Road and Minnesota Drive, focusing on traffic incidents, commercial property theft, and transient-related disturbances. Residential pocket neighborhoods situated away from main commercial arteries typically exhibit markedly lower incident counts.
South Anchorage, Turnagain, and the Hillside
Suburbs such as South Anchorage, Klatt, Turnagain, Goldenview, and the Anchorage Hillside show significantly lower overall pin densities on public mapping portals.
- Primary Offense Patterns: Crime occurrences in these single-family residential areas are predominantly low-volume property offenses, such as package theft, unlocked vehicle rifling, and occasional burglary. Violent crime pins in these sectors are statistically rare.
Comparing Anchorage Crime Mapping Tools
Several digital tools provide public safety data for Anchorage. Each platform serves a different purpose and uses distinct data refresh cadences.
| Platform / Tool | Primary Data Source | Map Visualization Style | Best Used For | Key Limitations |
|---|---|---|---|---|
| CrimeMapping.com | Direct APD CAD/RMS Automated Data Feed | Interactive Pins with Offense Icons | Tracking recent neighborhood incidents (1–180 days) | Does not display multi-year historical trend lines |
| Muni of Anchorage GIS Portal | Municipal & Police Open Data Repositories | Layered GIS Heatmaps & Geographic Boundaries | Urban planning, zoning context, long-term spatial analysis | Complex interface; not updated in real time |
| NeighborhoodScout / City-Data | Aggregated FBI NIBRS / UCR Annual Crime Statistics | Neighborhood Risk Index Ratings & Color Gradients | Macro-level neighborhood safety scores and home buyer research | Data lags by 12–24 months behind live events |
| LexisNexis Community Crime Map | Participating Law Enforcement Data Feeds | Pin Overlays with Analytics Graphs | Generating custom neighborhood radius alerts | Coverage dependent on active regional agency data feeds |
| Nextdoor / Citizen App | User-Reported Posts & Scanner Monitoring | User Pins & Social Media Posts | Real-time community awareness and localized warnings | Unverified reports; high risk of false alarms and bias |
Limitations and Common Misinterpretations of Crime Maps
While crime maps are valuable tools for evaluation, relying on raw mapping graphics without context can produce misleading conclusions.
COMMON CRIME MAP MISINTERPRETATIONS
- Foot Traffic Bias: High commercial density artificially inflates incident counts.
- Underreporting Gap: Unreported incidents do not produce map data points.
- Geographic Scale: Large land area skews visual density in suburban sectors.
1. The Commercial Foot Traffic Distortion
Raw crime maps do not adjust for daytime population size. A shopping center or entertainment hub with 10,000 daily visitors may record 100 theft reports a year, while a quiet residential street with 50 residents records two reports a year.
Evaluating raw pin density alone makes the shopping center appear disproportionately dangerous, even though an individual's personal risk per visit may be extremely low. Always weigh map pin counts against foot traffic volume and land-use type.
2. The Underreporting Gap
Crime maps only capture incidents that are reported to law enforcement. Minor property destruction, low-value theft from unsecured yard spaces, and certain petty offenses are frequently left unreported by property owners. Consequently, a neighborhood with zero pins may simply reflect a low reporting rate rather than an total absence of minor criminal activity.
3. Dispatch Classifications vs. Final Case Disposition
Initial map markers rely heavily on CAD dispatch codes. If a neighbor calls emergency services reporting a "shots fired" event that responding APD officers discover was actually a vehicle backfire or legal fireworks display, the initial dispatch entry may still appear on short-term automated mapping feeds before administrative reconciliation occurs.
Practical Steps to Verify Safety Beyond the Map
If you are researching an Anchorage neighborhood to purchase a home, rent an apartment, or open a business, complement crime map data with official municipal resources and community networks.
NEIGHBORHOOD VERIFICATION STEPS
- Review APD Reports: Check annual UCR/NIBRS crime statistics.
- Engage Community Council: Attend FCC meetings for hyper-local insights.
- Assess Physical Site: Examine lighting, street sightlines, & access.
1. Cross-Reference Official APD Crime Reports
Review formal crime statistics compiled by the Anchorage Police Department. APD releases periodic statistical updates and aligns data reporting with the FBI’s National Incident-Based Reporting System (NIBRS). These reports break down municipal-wide trends and help determine whether a local pin cluster reflects a temporary spike or a systemic citywide issue.
2. Engage with Local Community Councils
Anchorage features a structured neighborhood council system overseen by the Federation of Community Councils (FCC). Anchorage’s 38 community councils—such as the Midtown Community Council, South Addition Community Council, and Turnagain Community Council—meet regularly to discuss public safety, land use, and traffic concerns. Attending these meetings or reading published minutes provides practical context that raw mapping tools cannot supply.
3. Conduct Physical Site Assessments
Perform on-site evaluations of target neighborhoods at different times of the day and week. Observe environmental design elements that deter criminal activity, such as:
- Functional street lighting along public walkways.
- Clear sightlines from residences to parking zones and entryways.
- Active neighborhood watch signage and well-maintained public spaces.
- Secured communal areas in apartment complexes and commercial strip centers.
Frequently Asked Questions
Where can I access the official Anchorage police crime map?
The official automated public mapping interface for Anchorage law enforcement data is hosted via third-party integration platforms like CrimeMapping.com, which pull incident feeds directly from the Anchorage Police Department. Additionally, public safety spatial layers are accessible through the Municipality of Anchorage's Open Data Portal.
Why do some Anchorage neighborhoods show no crime pins at all?
An absence of pins generally indicates low overall incident activity, low density, or privacy-filtering rules applied by the platform. It can also occur if incidents in that area were not reported to APD, or if the selected time window (such as a 24-hour filter) is too narrow to catch past occurrences.
How often are crime maps updated in Anchorage?
Automated mapping services like CrimeMapping.com typically update their databases once every 24 to 48 hours as APD processes CAD logs and initial police reports. However, formal offense verification and data reconciliation can take several days to finalize.
Are sexual offenses and domestic violence shown on Anchorage crime maps?
To protect victim privacy and comply with state and federal legal standards, sensitive violent crimes—including domestic violence, child abuse, and sexual assault—are anonymized, broad-categorized, or entirely excluded from public-facing interactive map layers.
What is the difference between APD jurisdiction and Alaska State Troopers jurisdiction on local maps?
The Anchorage Police Department primary service area covers the main urban, suburban, and connected highway corridors of the Municipality of Anchorage (the Anchorage Police Service Area). Surrounding unincorporated areas, portions of the Seward Highway south of McHugh Creek, and outer rural tracks fall under the primary jurisdiction of the Alaska State Troopers (AST). Events handled exclusively by AST may appear on state trooper databases rather than APD crime maps.
How do property crime rates in Anchorage compare to national averages?
Historically, Anchorage records property crime rates (including motor vehicle theft and burglary) that exceed national metropolitan averages, while violent crime rates fluctuate depending on specific urban sectors and demographic factors. Utilizing map filters helps users separate prevalent property offenses from rarer violent incidents.
Next Steps for Neighborhood Research
When evaluating safety conditions across the Municipality of Anchorage, avoid relying on a single digital map view. Combine current spatial data with formal municipal statistical releases, physical site visits, and community council reports.
If you are evaluating real estate or planning a relocation, use interactive crime maps with a 90-day to 12-month date range, filter specifically by offense type (property vs. violent crime), and cross-reference your findings with APD public reporting to gain an accurate understanding of local safety patterns.