Atmospheric pressure is the force exerted by the weight of the air molecules in the atmosphere above a specific point on the Earth's surface. High-pressure systems, or anticyclones, involve sinking air that typically brings clear, stable weather. Conversely, low-pressure systems, or cyclones, involve rising air that leads to cloud formation, instability, and precipitation.
Understanding Atmospheric Pressure: The Weight of the Sky
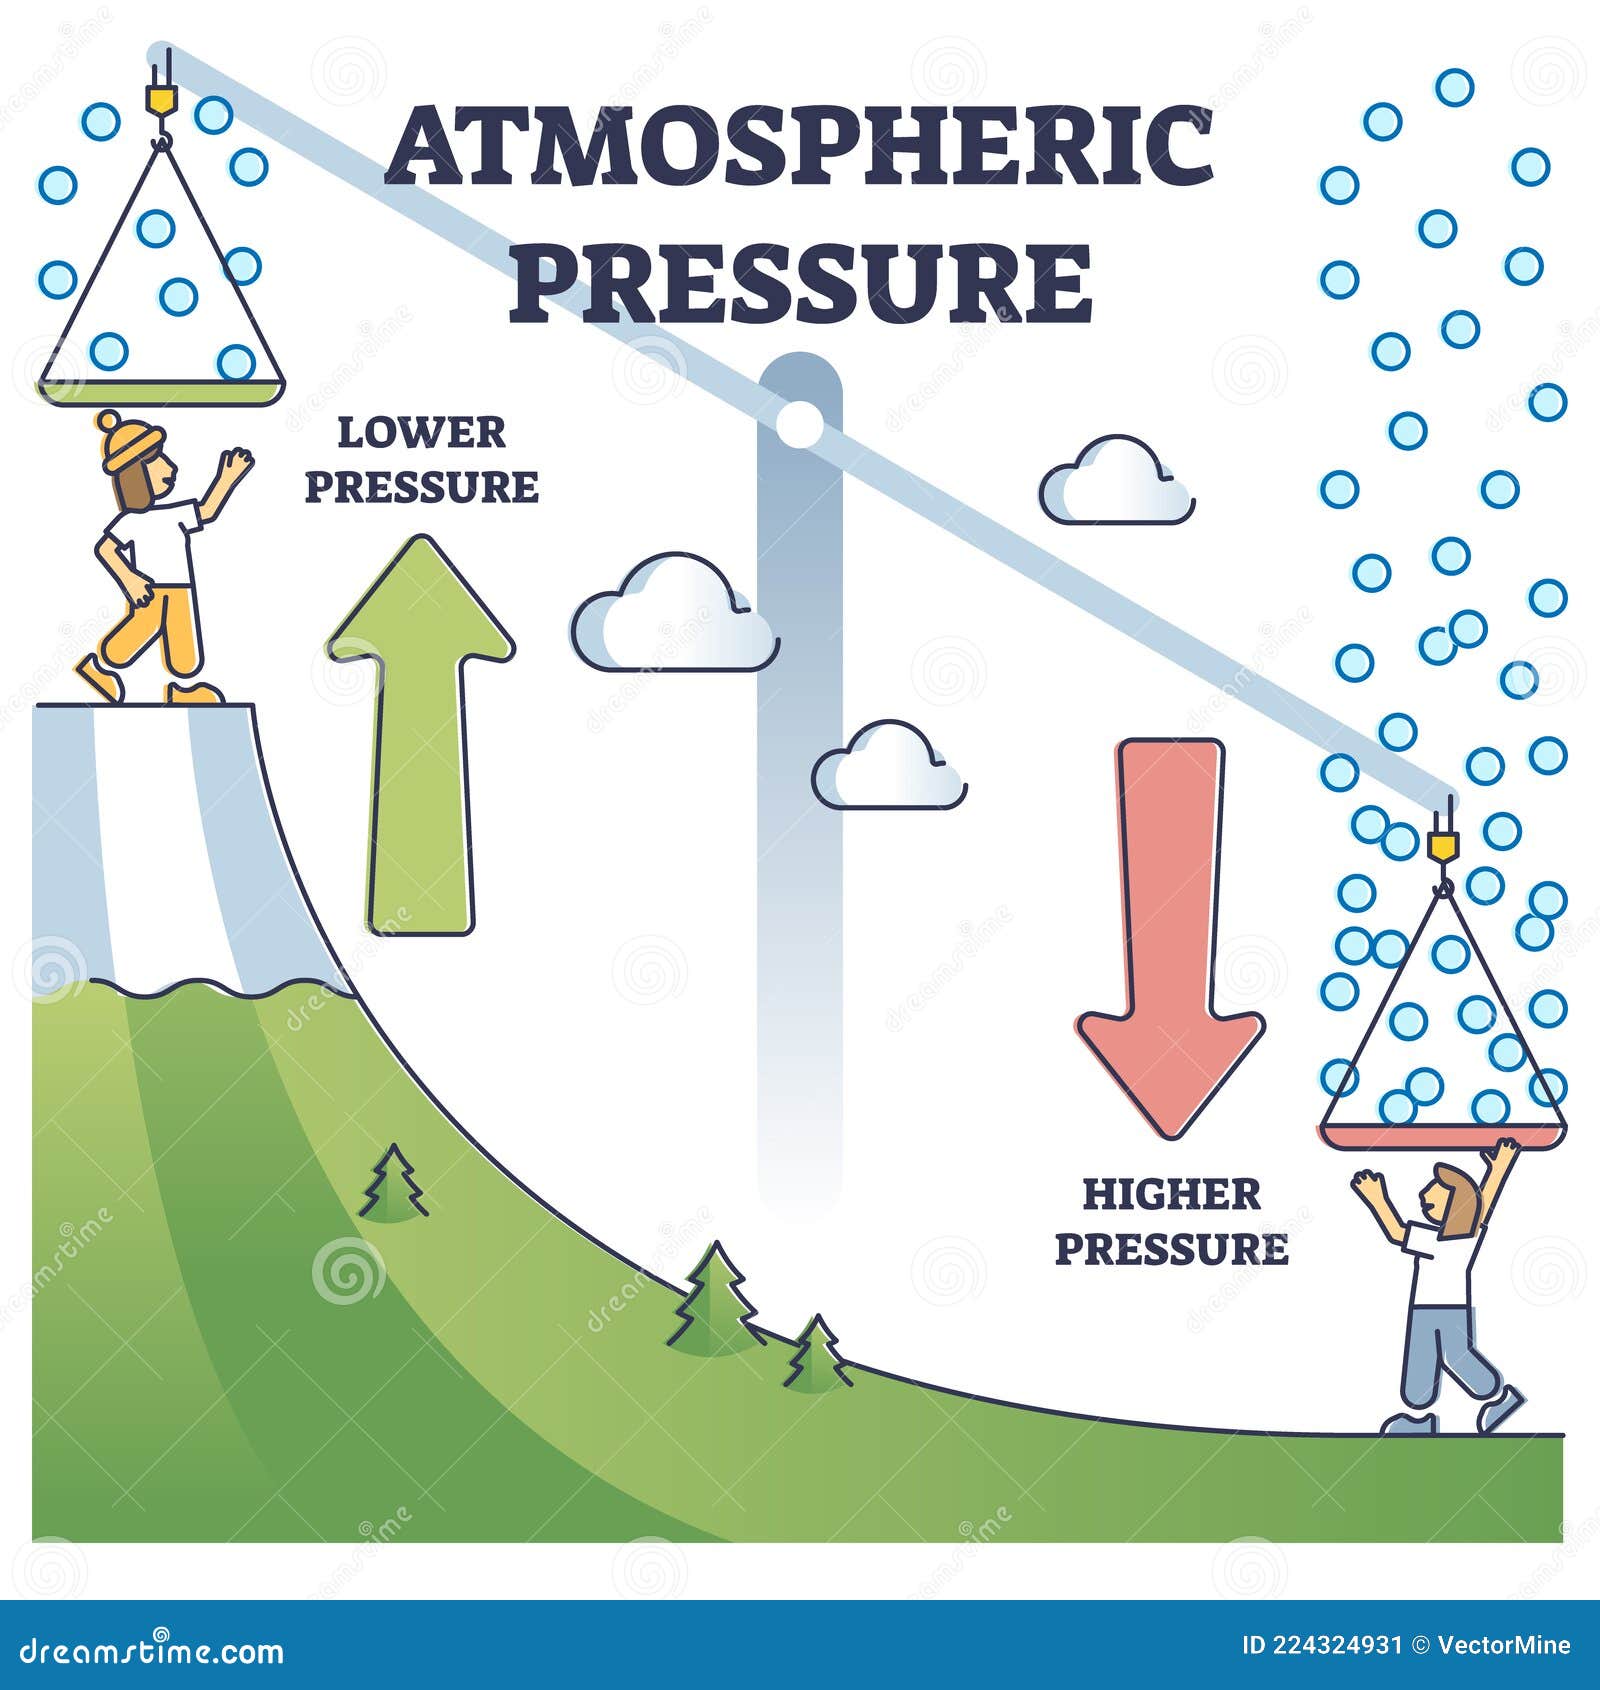
To understand high and low pressure, one must first conceptualize the atmosphere as a fluid. Although air is invisible, it possesses mass and is subject to the Earth's gravitational pull. At sea level, the average weight of the column of air above a single square inch of surface is approximately 14.7 pounds. This measurement represents the baseline for what meteorologists define as standard atmospheric pressure.
Pressure is not static; it fluctuates based on temperature, altitude, and moisture content. As of 2026, satellite-based remote sensing and advanced ground-based barometric arrays provide real-time data that allow us to visualize these fluctuations as isobars—lines of equal pressure on a weather map. When these isobars form closed loops, they identify "cells" of high or low pressure. The movement of air between these cells, driven by the quest for equilibrium, is what we perceive as wind.
The transition between pressure systems dictates the daily weather experienced by billions. A "High" (H) or "Low" (L) on a map is not just a letter; it represents a complex three-dimensional engine of vertical and horizontal air movement. Understanding the characteristics of these systems is fundamental to everything from commercial aviation to agricultural planning and disaster preparedness.
The Anatomy of a High-Pressure System (Anticyclone)
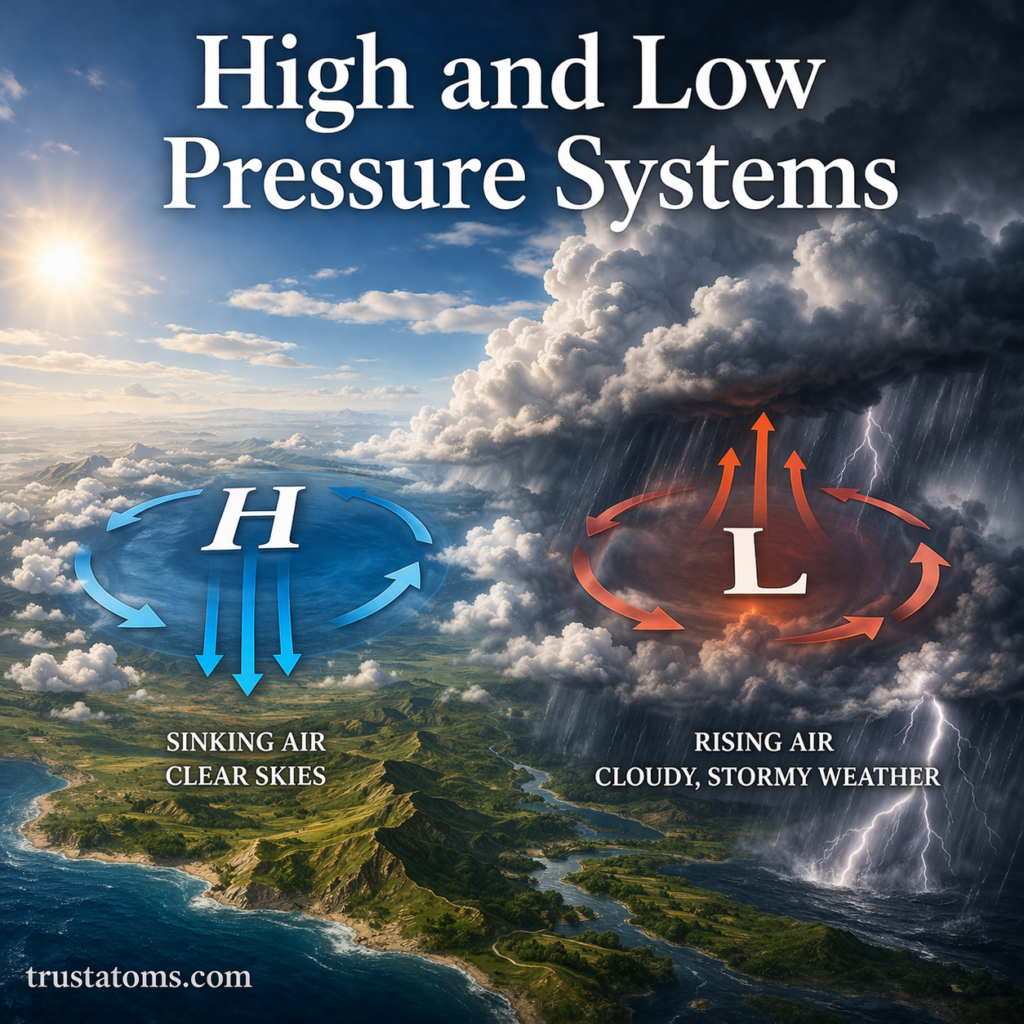
A high-pressure system, technically known as an anticyclone, occurs when the atmospheric pressure at the surface is higher than the surrounding environment. In the center of a high-pressure cell, air is gradually sinking from higher altitudes toward the surface. This process is known as subsidence.
As air sinks, it undergoes adiabatic heating. This means that as the air moves into regions of higher pressure closer to the ground, it is compressed, and its temperature rises. Because warmer air can hold more water vapor, sinking air prevents the condensation required for cloud formation. Consequently, high-pressure systems are almost universally associated with "fair weather," clear skies, and light winds.
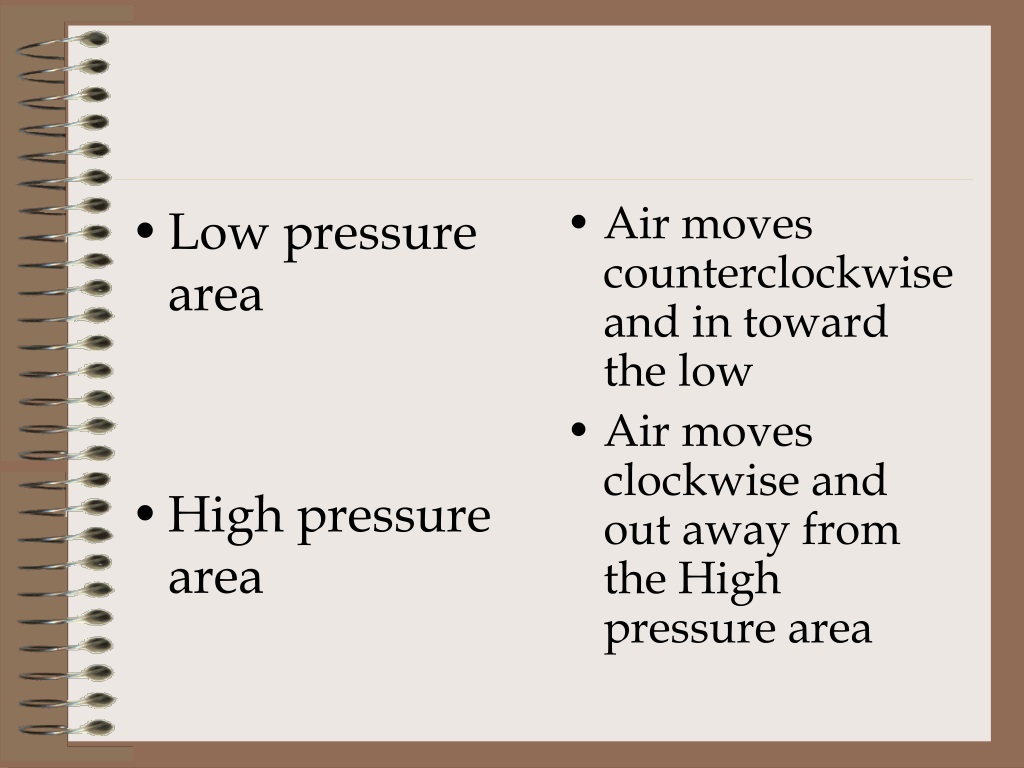
The rotation of a high-pressure system is governed by the Coriolis effect, a result of the Earth's rotation. In the Northern Hemisphere, air moves out from the center of a high in a clockwise direction. In the Southern Hemisphere, this outward flow is counter-clockwise. Because the air is moving away from the center (divergence), it must be replaced by air from above, which reinforces the sinking motion. During winter, high-pressure systems can lead to "temperature inversions," where cold air is trapped at the surface under a layer of warmer sinking air, sometimes leading to stagnant air quality in urban basins.
The Dynamics of a Low-Pressure System (Cyclone)
A low-pressure system, or cyclone, represents a region where the atmospheric pressure at the surface is lower than the surrounding areas. In these systems, air converges at the surface and is forced upward into the atmosphere. This rising motion is the primary driver of unsettled weather.
As air rises, it expands due to the decrease in ambient pressure at higher altitudes. This expansion leads to adiabatic cooling. When the air cools to its dew point, water vapor begins to condense into water droplets or ice crystals, forming clouds and eventually leading to precipitation. This is why "L" symbols on weather maps are frequently surrounded by rain, snow, or thunderstorms.
In terms of circulation, the Coriolis effect causes air to spiral inward toward the center of a low-pressure system. In the Northern Hemisphere, this rotation is counter-clockwise, while in the Southern Hemisphere, it is clockwise. The intensity of a low-pressure system is often measured by its "central pressure." The lower the pressure at the center, the steeper the pressure gradient between the system and its surroundings, which results in higher wind speeds. Extreme examples of low-pressure systems include tropical cyclones (hurricanes and typhoons) and mid-latitude "bomb" cyclones, which undergo rapid pressure drops.
Pressure Gradients and the Genesis of Wind
Wind is simply the atmosphere's attempt to balance the uneven distribution of pressure. Air naturally moves from areas of high pressure toward areas of low pressure. This movement is driven by the Pressure Gradient Force (PGF). The "gradient" refers to the rate of change in pressure over a specific distance.
On a meteorological chart, isobars that are packed closely together indicate a steep pressure gradient. This signifies a rapid change in pressure over a short distance, which translates to high wind speeds. Conversely, widely spaced isobars indicate a weak gradient and light winds.
However, wind does not move in a straight line from high to low. The Coriolis effect deflects the wind to the right in the Northern Hemisphere and to the left in the Southern Hemisphere. Additionally, at the surface, friction with the terrain (trees, buildings, mountains) slows the wind down and causes it to cross the isobars at an angle. In the upper atmosphere, where friction is negligible, the wind often flows parallel to the isobars, a phenomenon known as geostrophic wind. This interplay between pressure gradient, Coriolis force, and friction defines the global wind belts that navigate our planet.
Comparison of High and Low Pressure Characteristics
The following table summarizes the primary physical and meteorological differences between these two dominant atmospheric systems.
| Characteristic | High Pressure (Anticyclone) | Low Pressure (Cyclone) |
|---|---|---|
| Vertical Air Motion | Sinking (Subsidence) | Rising (Convection/Convergence) |
| Surface Air Motion | Diverging (Moving Outward) | Converging (Moving Inward) |
| Rotation (Northern Hem.) | Clockwise | Counter-clockwise |
| Rotation (Southern Hem.) | Counter-clockwise | Clockwise |
| Typical Weather | Clear skies, stable, dry | Cloudy, unstable, precipitation |
| Isobar Pattern | Usually broad and spread out | Often tight and circular |
| Temperature Effect | Often brings extreme highs or lows | Tends to moderate surface temps |
| Common Name | "Fair Weather" system | "Storm" or "Depression" |
The Relationship Between Temperature and Pressure
Temperature and pressure are inextricably linked, though the relationship is often counter-intuitive to those outside the field of meteorology. Thermal pressure systems are created by the heating or cooling of the Earth's surface.
For example, a "Thermal Low" often forms over desert regions during the summer. As the sun bakes the ground, the air directly above it heats up and expands. This less dense air rises, leaving lower pressure at the surface. These systems are usually stationary and rarely produce rain because the air is too dry, but they can drive significant local wind patterns like monsoons.
Conversely, "Thermal Highs" (or Cold Highs) form over frigid regions like Siberia or Northern Canada during winter. Cold air is much denser than warm air; it sinks and piles up at the surface, creating very high barometric readings. These systems are responsible for the "Arctic Blasts" that can push sub-zero temperatures deep into temperate latitudes. Understanding the 2026 climate models requires recognizing how shifting global temperature averages are altering the traditional boundaries and strengths of these thermal pressure centers.
Measuring Pressure: Units and Instruments
To maintain global standards, the World Meteorological Organization (WMO) and national agencies like NOAA utilize specific units and instruments. While the mercury barometer was the historical standard, modern meteorology relies on digital barometers and aneroid sensors.
- Millibars (mb) and Hectopascals (hPa): These are the most common units used by meteorologists. 1 mb is equal to 1 hPa. Standard sea-level pressure is defined as 1013.25 mb.
- Inches of Mercury (inHg): This unit is still widely used in aviation and by the general public in the United States. Standard sea-level pressure is 29.92 inHg.
- Altimeters: Pilots use pressure to determine altitude. Because pressure drops as you go higher (about 1 inch of mercury for every 1,000 feet), an aircraft’s altimeter is essentially a barometer calibrated to show height instead of weight.
In 2026, high-precision MEMS (Micro-Electro-Mechanical Systems) sensors are integrated into smartphones and wearable devices. While these provide localized data, professional forecasting still relies on the Global Observing System, which includes thousands of buoys, weather stations, and weather balloons (radiosondes) that profile the pressure from the surface to the stratosphere.
Global Pressure Belts and Climatic Impacts
Atmospheric pressure is not just a local phenomenon; it organizes the entire planet's climate through permanent and semi-permanent pressure belts.
- Equatorial Low (The Doldrums): Constant heating at the equator creates a permanent belt of low pressure. This results in heavy rainfall and the lush tropical rainforests of the Amazon and Congo basins.
- Subtropical Highs (Horse Latitudes): Around 30 degrees North and South, air that rose at the equator sinks back down. This creates permanent high-pressure zones where most of the world's great deserts, such as the Sahara and the Australian Outback, are located.
- Subpolar Lows: Located around 60 degrees latitude, these areas are the "graveyards" of many mid-latitude storms, characterized by frequent precipitation and variable weather.
- Polar Highs: The cold, dense air over the poles creates permanent high pressure, leading to the "polar deserts" of Antarctica and the High Arctic, where actual snowfall is surprisingly low.
The movement of these belts, influenced by the seasons, dictates the rainy and dry seasons for much of the world's population. In 2026, research continues into how the weakening of the Jet Stream—a river of fast-moving air driven by pressure differences—is causing weather systems to "block" or stay in place longer, leading to extended heatwaves or flooding events.
Practical Implications of Pressure Systems
Understanding these definitions has real-world applications beyond the evening news forecast. For instance, individuals with chronic joint pain or migraines often report increased sensitivity during low-pressure events. Scientifically, this is attributed to the fact that lower external air pressure allows body tissues to expand slightly, which can put pressure on nerves and joints.
In aviation, knowing the local pressure is a matter of safety. If a pilot flies from a high-pressure area to a low-pressure area without adjusting the altimeter, the aircraft will be lower than the instrument indicates—a dangerous situation in mountainous terrain. Similarly, for sailors and gardeners, a "falling barometer" (dropping pressure) is the most reliable traditional warning that storm conditions are approaching, often providing hours of lead time before the first rain cloud appears.
FAQ
How does altitude affect atmospheric pressure? Pressure decreases as altitude increases. This is because there is less atmosphere above you to "weigh down" on you. This is why water boils at a lower temperature in the mountains and why high-altitude athletes must acclimate to "thinner" air, which contains fewer oxygen molecules per breath.
What is a "bomb" cyclone? A bomb cyclone, or explosive cyclogenesis, is a low-pressure system that experiences a rapid drop in pressure—specifically at least 24 millibars in 24 hours. These systems produce extreme winds and heavy precipitation, often mimicking the intensity of a hurricane.
Why is high pressure usually associated with heatwaves? High pressure causes air to sink and compress, which warms it up. Additionally, the lack of clouds allows intense solar radiation to reach the surface all day. Because the system is stable, it can remain stationary for days or weeks, allowing heat to build up cumulatively.
Can you have rain in a high-pressure system? While rare, it is possible. If the high pressure is "shallow," moisture can still be trapped near the surface, leading to drizzle or light rain. However, organized, heavy thunderstorms and frontal rain are almost exclusively features of low-pressure systems.
What is the highest and lowest pressure ever recorded? The highest sea-level pressure ever recorded was 1084.8 mb in Agata, Siberia, during a massive cold-core high in 1968. The lowest non-tornadic pressure was 870 mb, recorded in the eye of Typhoon Tip in the Pacific Ocean in 1979.
Practical Recommendation
For the most accurate assessment of how atmospheric pressure will affect your local activities in 2026, monitor the "Barometric Trend" rather than just the current reading. A stable or rising barometer suggests several days of fair weather, ideal for construction, outdoor events, or travel. A rapidly falling barometer indicates that a low-pressure system is moving in, and you should prepare for wind and precipitation. To get the most reliable data, ensure your local weather app or home barometer is calibrated to "Sea Level Pressure" to account for your specific elevation.