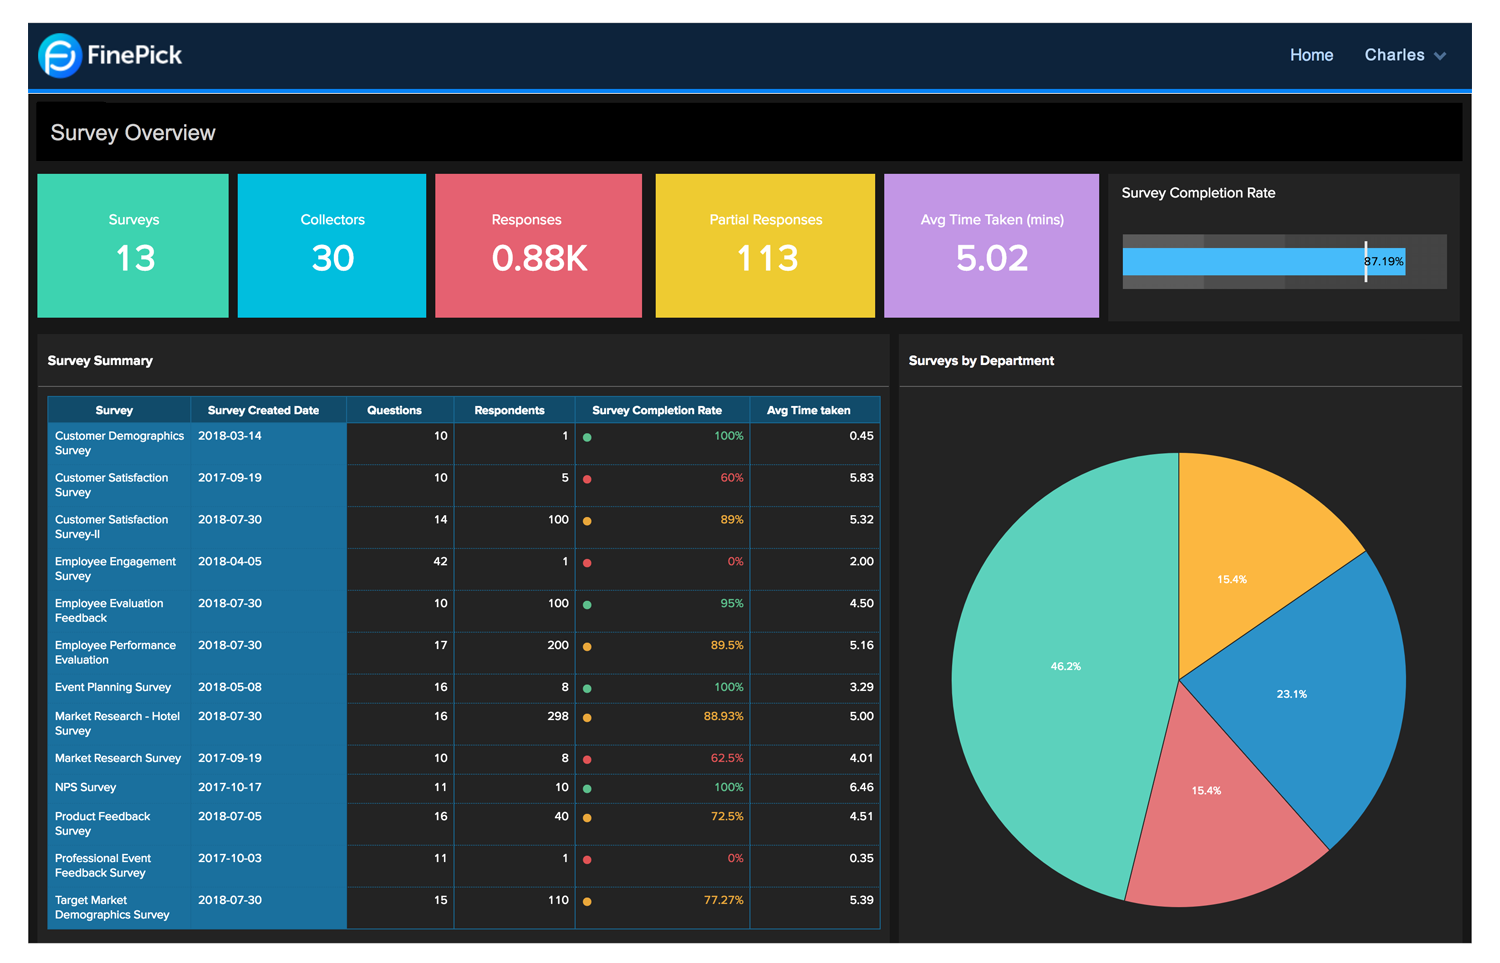
Analytics market research mapping represents the systematic process of identifying, measuring, and visualizing fluctuations in consumer behavior through the integration of qualitative data and quantitative datasets. By synthesizing disparate signals—from sentiment analysis on social platforms to transactional velocity and search query trends—organizations can transition from reactive observation to predictive modeling, allowing for more precise alignment between product development and evolving market demands.
The Evolution of Consumer Insight Mapping
The traditional model of consumer research relied heavily on longitudinal surveys, focus groups, and retrospective sales reporting. While these methods provided a degree of clarity, they were fundamentally limited by time lag and sample bias. In 2026, the landscape of analytics market research has shifted toward a high-frequency, multi-modal architecture.
Mapping consumer shifts is no longer about checking in with a target audience once a quarter; it is about establishing a continuous observational loop. By deploying advanced analytical frameworks, firms can now map the "delta" of consumer sentiment—the space between what a consumer says they want and how they actually interact with digital and physical touchpoints. This shift requires reconciling internal enterprise resource planning (ERP) data with external market signals, creating a unified view of the customer journey that accounts for macroeconomic volatility and localized cultural trends.
Data Prerequisites for Effective Mapping
Before an organization can effectively map consumer shifts, it must ensure its data infrastructure meets specific technical and structural requirements. The utility of an insight map is directly proportional to the quality and diversity of the underlying data streams.
- Transactional Integrity: Quantitative data must be clean, normalized, and timestamped. Discrepancies in how transactions are categorized across different regions or business units create "noise" that can invalidate trend mapping.
- Sentiment Normalization: Qualitative data, derived from unstructured text in reviews, support tickets, or social discourse, requires natural language processing (NLP) models tuned to specific industry lexicons. Sentiment scores must be weighted against objective metrics to avoid over-indexing on vocal minority opinions.
- Temporal Alignment: For mapping to be meaningful, data points must be aligned to the same temporal frequency. Attempting to map daily consumer shifts against quarterly financial reports will result in misalignment and missed patterns.
- Privacy and Consent Architecture: In 2026, the regulatory environment requires that all behavioral mapping must strictly adhere to data protection mandates like the GDPR or regional equivalents. Data used for mapping must be pseudonymized at the point of ingestion to ensure compliance while maintaining trend visibility.
Methodological Frameworks for Trend Analysis
Mapping shifts requires more than just gathering data; it necessitates the application of specific mathematical and heuristic frameworks to interpret what is happening in the marketplace.
Predictive Correlation Analysis
This method involves identifying lead indicators—data points that show movement before a broader market trend becomes apparent. For example, a surge in specific "problem-solving" search queries often precedes a shift in demand for a particular product category. By mapping these searches against sales velocity, analysts can create a predictive model that anticipates inventory requirements before a trend reaches peak saturation.
Cohort Sentiment Tracking
Rather than viewing consumers as a monolithic group, advanced mapping techniques isolate specific cohorts based on lifecycle stage, spending power, or brand affinity. By observing how sentiment shifts within these isolated groups, companies can identify which segments are early adopters of a shift and which are holdouts. This allows for targeted marketing interventions rather than broad-spectrum campaigns that may dilute the message.
Competitive Velocity Mapping
Analytics research is incomplete without assessing how competitors are responding to the same shifts. Competitive velocity mapping tracks the frequency and nature of new product launches, price adjustments, and marketing pivots. When a firm observes a shift in its own consumer base, overlaying competitive movement helps determine whether the shift is organic to the market or a reaction to a rival’s strategic move.
Comparison of Analytical Approaches
The following table summarizes the primary methods used in mapping consumer shifts, detailing their operational focus and the technical requirements for successful implementation.
| Approach | Primary Goal | Data Inputs | Implementation Difficulty |
|---|---|---|---|
| Trend Correlation | Forecasting demand | Search volume, ERP sales data | Moderate |
| Sentiment Sentiment Mapping | Brand perception shift | Social, review, support logs | High (NLP heavy) |
| Cohort Behavioral Analysis | Retention and loyalty shifts | CRM, customer journey logs | Moderate |
| Competitive Benchmarking | Strategic positioning | Public market signals, ad spend | Low |
Overcoming Common Implementation Mistakes
A frequent failure point in analytics market research is the tendency to equate correlation with causation. For instance, a firm might observe an increase in website traffic (a shift in interest) and a simultaneous drop in physical store visits, and incorrectly assume one directly caused the other. In reality, external factors—such as local weather patterns or regional infrastructure projects—might be the true drivers.
To mitigate this, analysts must incorporate "control variables" into their mapping models. By adjusting for seasonal, economic, or environmental factors, the resulting insight map provides a cleaner view of true consumer intent. Another common mistake is the "Dashboard Trap," where stakeholders focus exclusively on high-level KPIs (Key Performance Indicators) rather than the underlying raw data. Dashboards are excellent for monitoring, but they are poor tools for "discovery." To truly map a shift, one must be prepared to drill down into the granular data—the individual customer comments, the specific search strings, and the unique transaction IDs.
The Role of Artificial Intelligence in 2026
By 2026, the integration of generative AI has changed how market research mapping is performed. Rather than manual data extraction, machine learning models now continuously scan for anomalies in consumer behavior. These models can flag "weak signals"—tiny, persistent shifts in consumer language or behavior that might otherwise go unnoticed.
When a system detects a shift, it can now automatically cross-reference this with internal product performance data to suggest potential causes. However, the human role remains critical. AI identifies the "what," but human analysts are necessary to determine the "so what." Decision-makers must interpret the output of these models within the context of company strategy, corporate values, and long-term brand equity, ensuring that the response to a consumer shift does not compromise the core identity of the business.
FAQ: Navigating Consumer Insight Analytics
How often should an organization update its market research maps? Frequency depends on the volatility of your industry. In high-velocity sectors like consumer electronics or fashion, weekly mapping is often necessary to stay ahead of the curve. For slower-moving sectors like industrial equipment, quarterly or semi-annual mapping is generally sufficient.
What is the difference between descriptive and predictive mapping? Descriptive mapping explains what has already happened by analyzing past data. Predictive mapping uses those historical patterns to create statistical models that forecast likely future behaviors, giving businesses a proactive advantage.
Can small businesses perform this level of research without a massive budget? Yes. While large enterprises use proprietary suites, small businesses can utilize integrated CRM and web analytics tools to identify key customer segments and track behavioral trends. The barrier to entry is the analytical time and curiosity, not necessarily expensive software.
How do I ensure my research data is not biased? Biased data leads to skewed insights. To minimize this, use diversified data sources (e.g., combining direct sales data with independent third-party market reports) and regularly audit your data collection methods to ensure they capture a representative sample of your total addressable market.
Should we trust social media sentiment as a reliable metric for market shifts? Social media sentiment is a strong indicator of "trending" behavior but can be noisy. It should always be balanced against transactional reality. Treat social sentiment as a leading indicator for "intent," and transactional data as the confirming indicator for "action."
Next Steps for Implementation
To begin mapping shifts in consumer insight effectively, start by auditing your existing data silos. Identify what information you are already collecting that, if synthesized, would reveal the "why" behind your current sales performance. Once you have a unified data repository, initiate a 90-day pilot program where you track one specific consumer segment against a single market variable—such as price sensitivity or feature preference.
Document every correlation you find and, more importantly, every instance where your initial hypothesis was proven wrong. This process of continuous validation is the hallmark of a mature analytics program. As your proficiency grows, gradually expand your scope to include more complex variables, eventually building a robust, real-time map that informs not just your tactical responses, but your long-term strategic evolution.