The year 2015 stands as a profound meteorological milestone, officially recognized by major global scientific agencies as the hottest year in modern instrumental records up to that point. Driven by a potent combination of a powerful El Niño event and long-term anthropogenic climate change, global surface temperatures shattered previous records, fundamentally shifting public awareness and international policy surrounding environmental preservation.
The Scientific Consensus: How 2015 Shattered Global Temperature Records
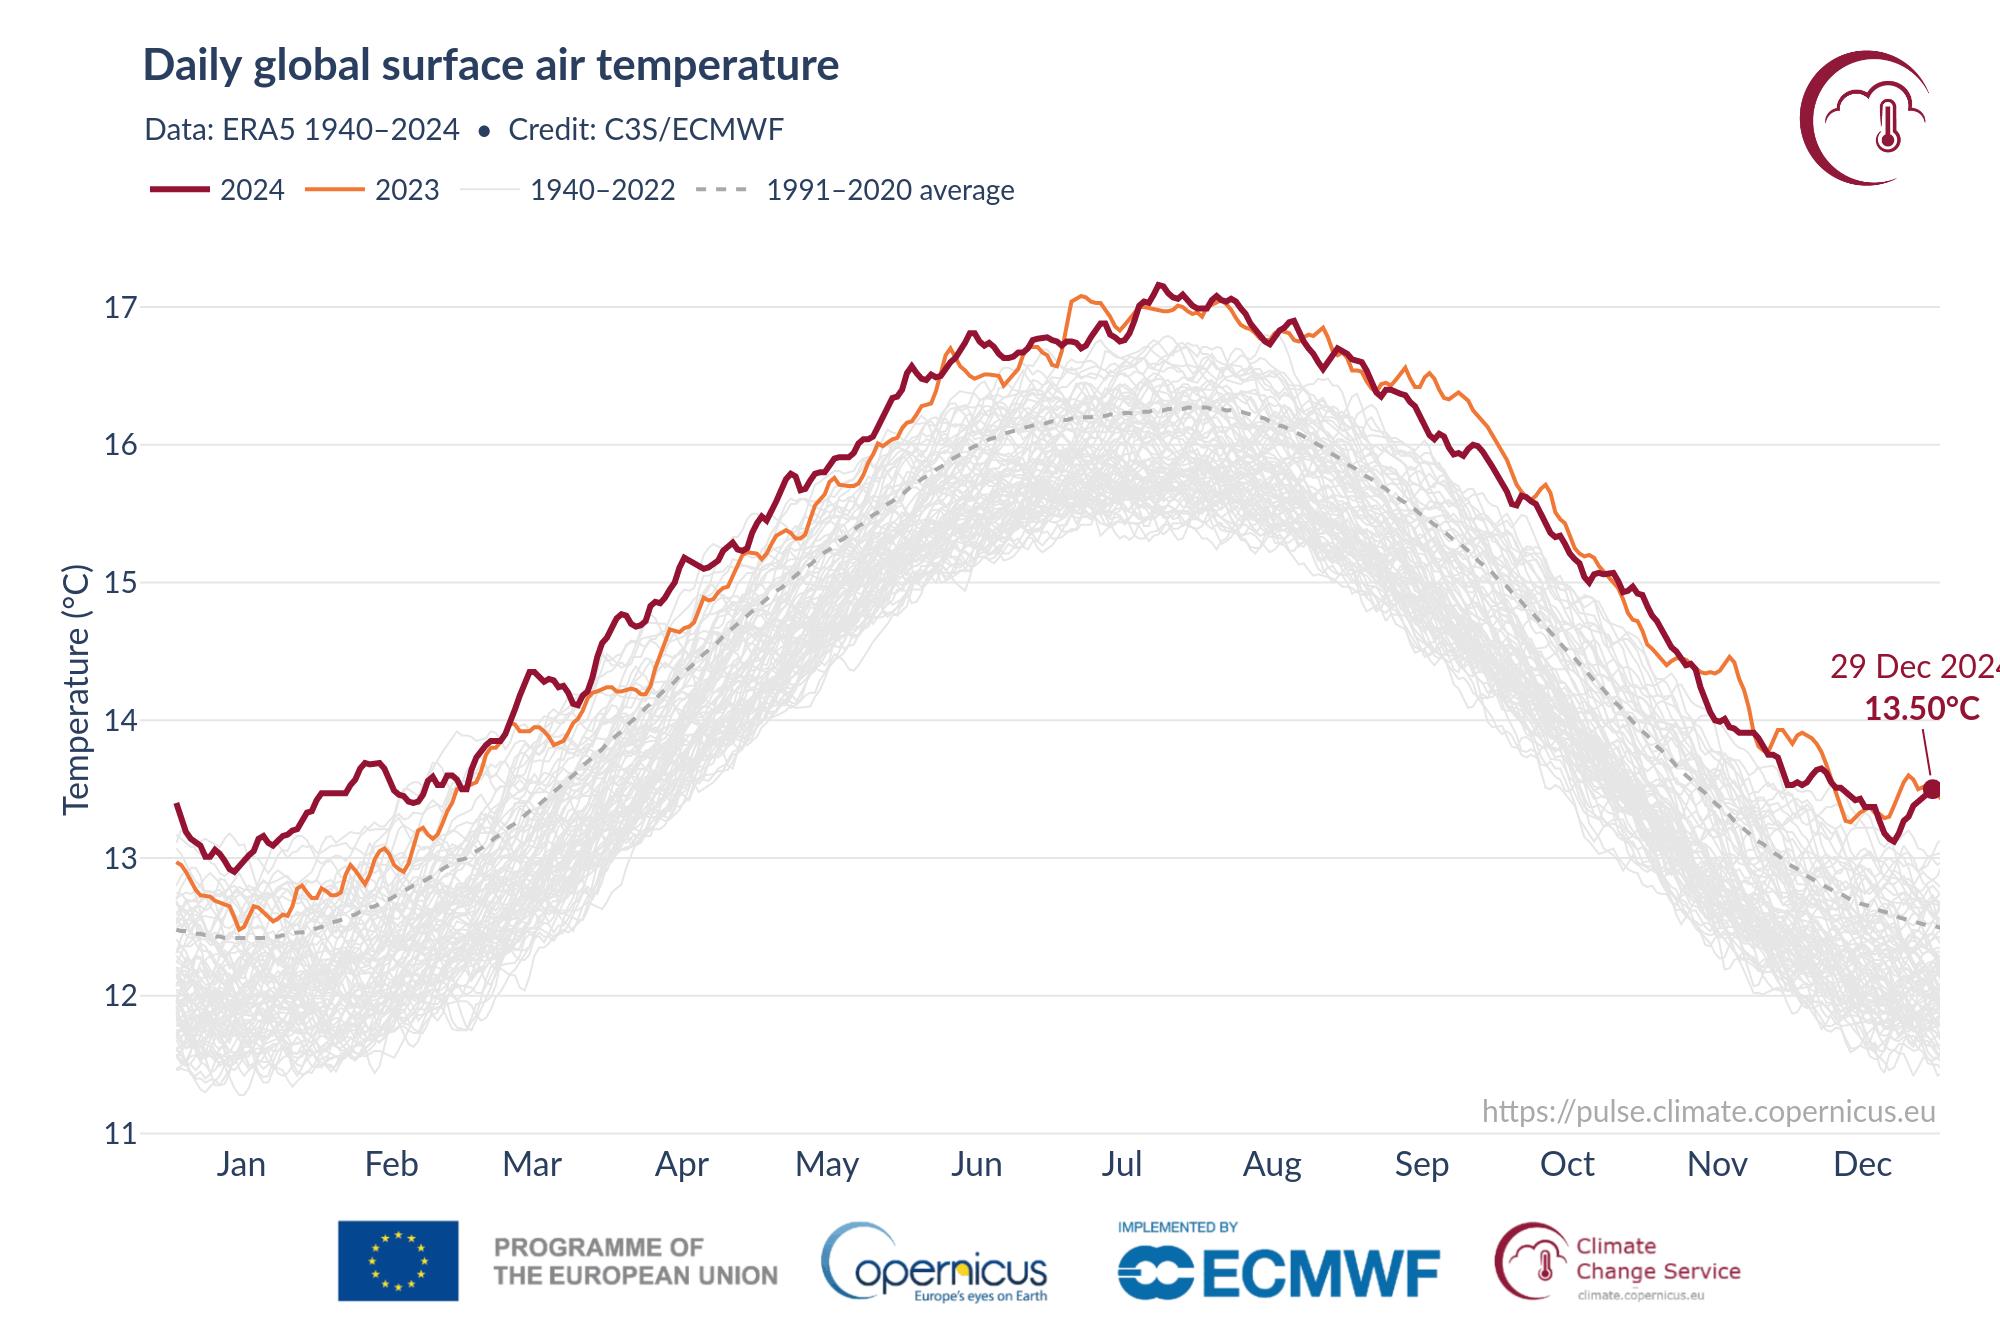
To understand the magnitude of 2015, climatologists look to long-term monitoring datasets maintained by international institutions such as the National Oceanic and Atmospheric Administration (NOAA), the National Aeronautics and Space Administration (NASA), the UK Met Office, and the World Meteorological Organization (WMO). Independent analyses from these organizations confirmed that the global average surface temperature for 2015 was approximately 0.90°C (1.62°F) above the 20th-century average.
For the first time in recorded meteorological history, the global mean temperature crossed the symbolic threshold of being 1 degree Celsius warmer than pre-industrial levels. This was not merely an incremental rise; it represented a significant jump from the previous record set just one year prior in 2014. Scientists utilized millions of meteorological measurements gathered from land-based weather stations, ships, ocean buoys, and advanced satellite telemetry to verify these figures, ensuring absolute data integrity across multiple independent methodologies.
Key Meteorological Indicators of 2015
- Global Land and Ocean Temperatures: Both land and ocean surfaces experienced near-record or record-breaking warmth, with ocean temperatures heavily influenced by expanding marine heatwaves.
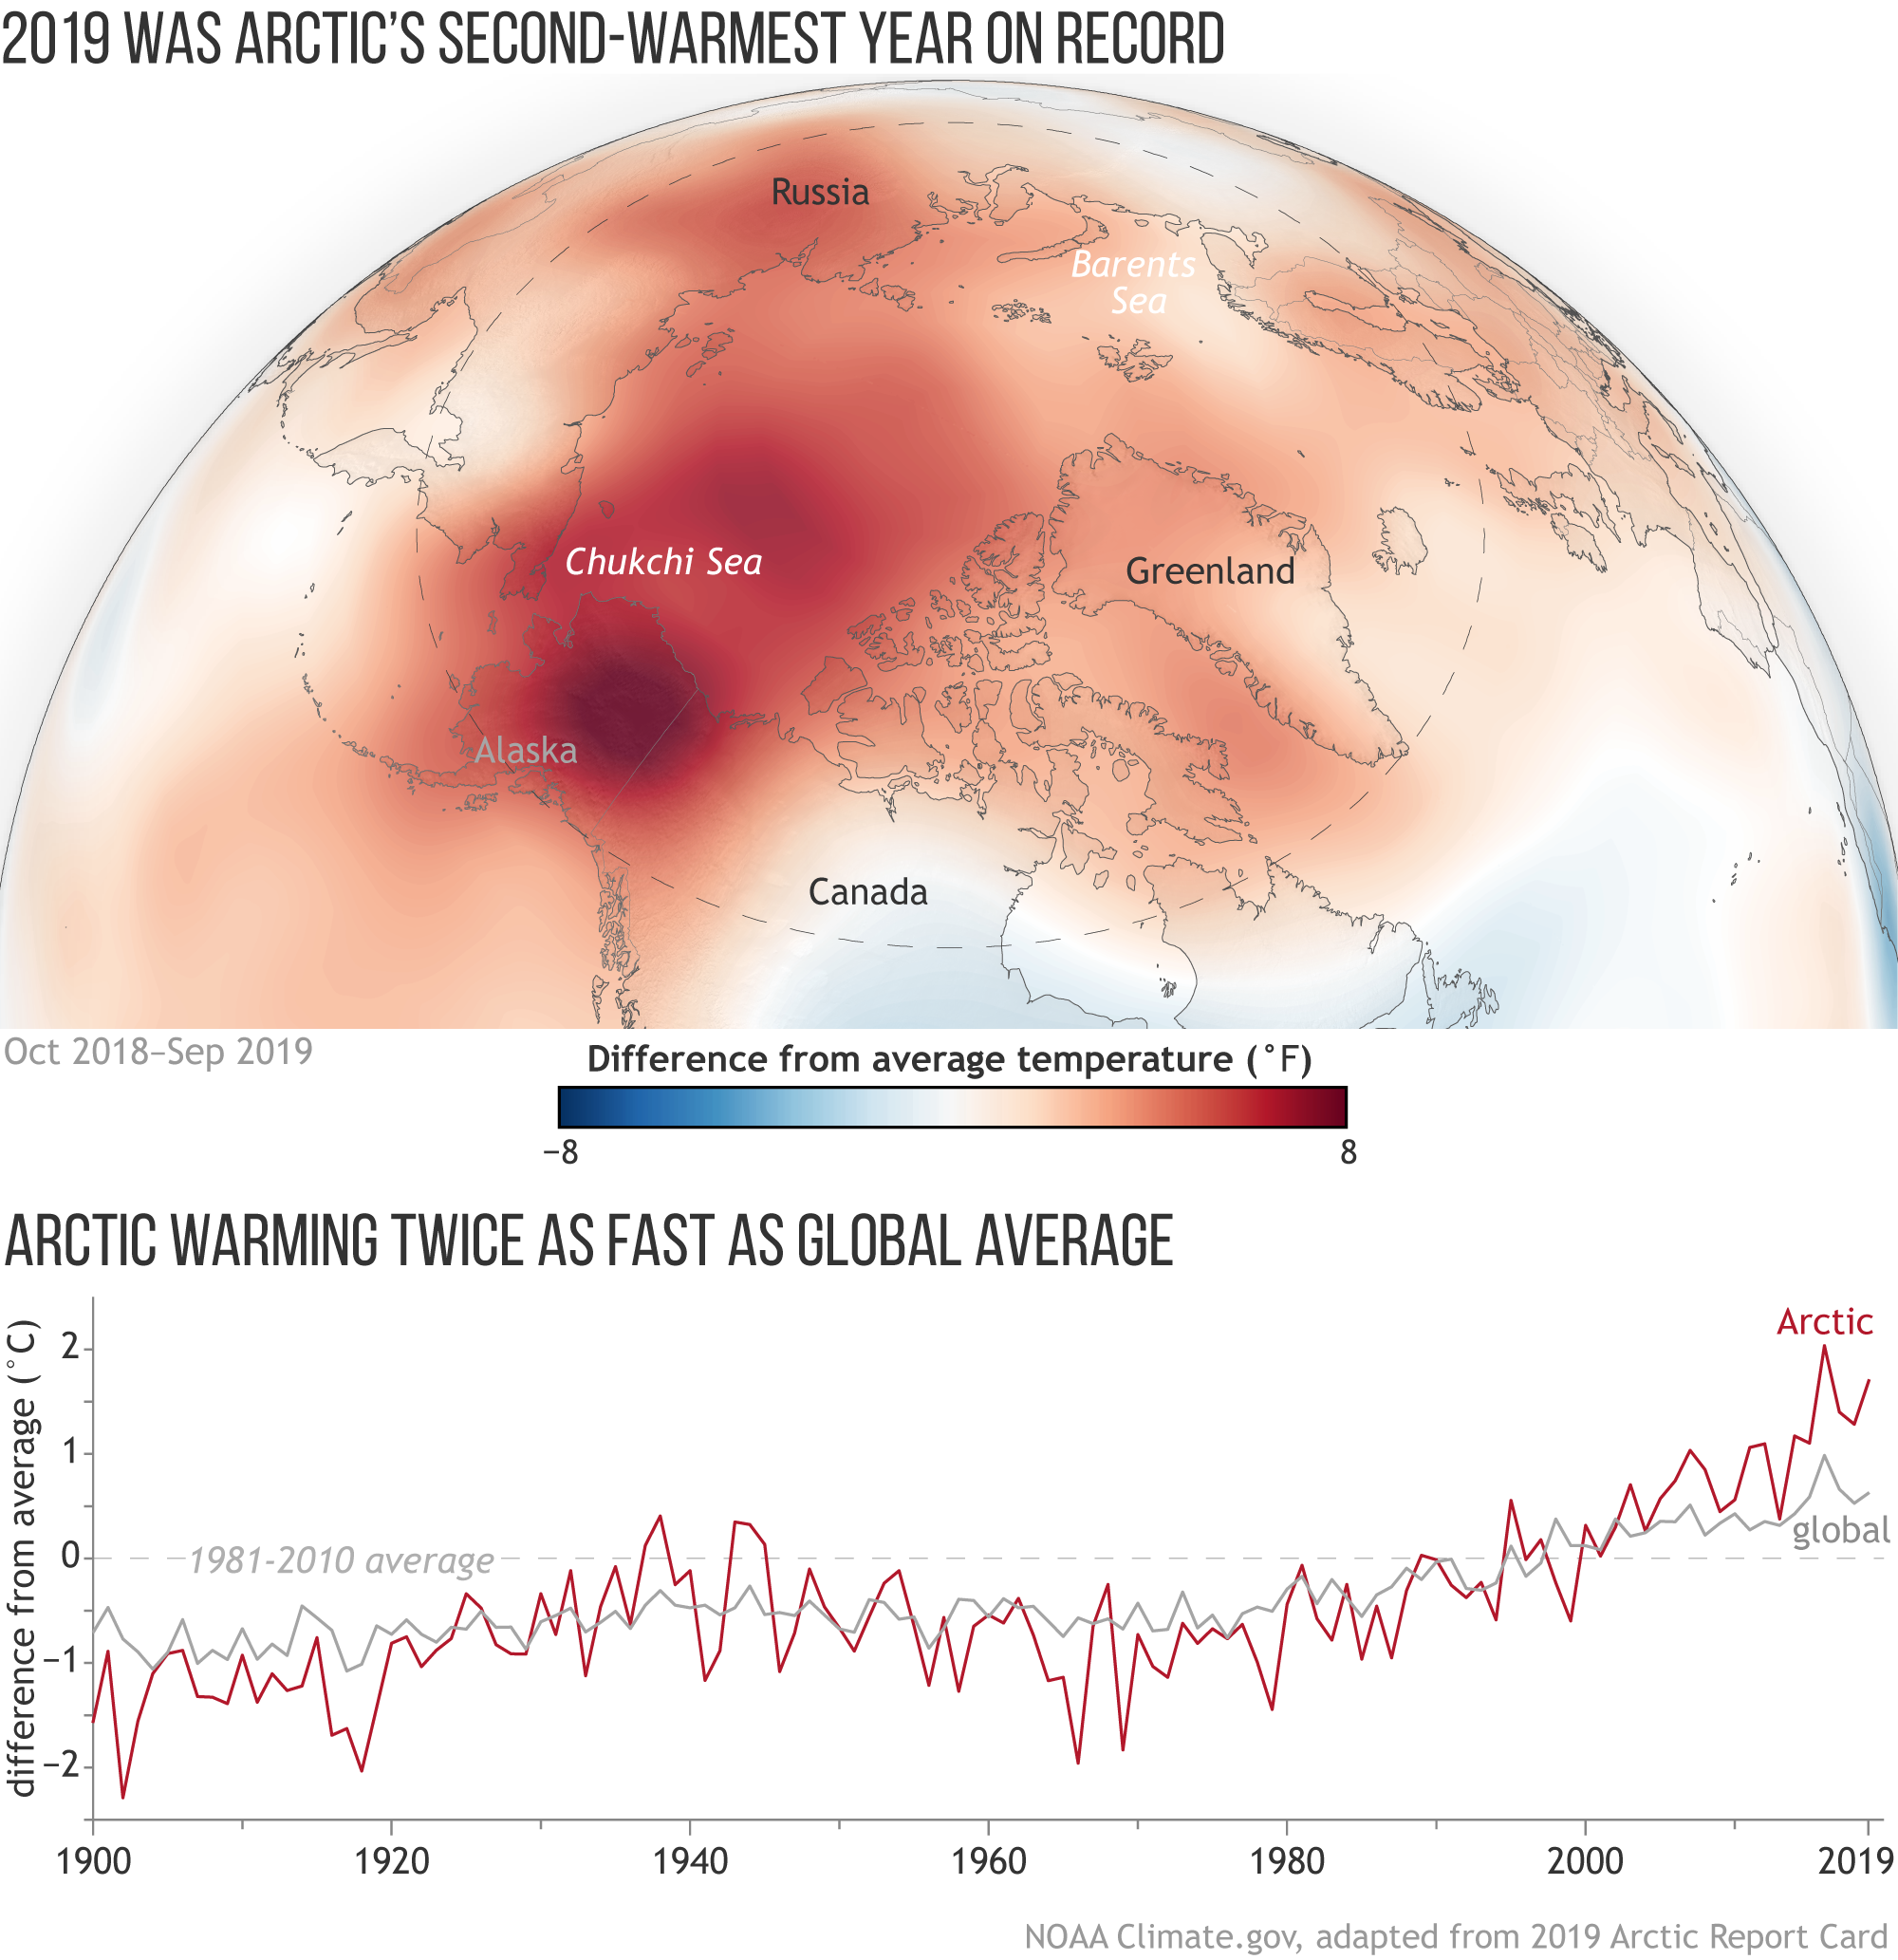
- Arctic Sea Ice Extent: Arctic sea ice reached near-record lows during its winter maximum and summer melt season, continuing a multi-decadal downward trend.
- Greenhouse Gas Concentrations: Atmospheric carbon dioxide ($CO_2$) concentrations surpassed a milestone average of 400 parts per million (ppm) globally across the entire year, a concentration unprecedented in human history.
Driving Forces: El Niño and Long-Term Anthropogenic Forcing
The extraordinary warmth of 2015 was the result of two primary drivers interacting on different temporal scales: a short-term, naturally occurring climate phenomenon and long-term, human-induced global warming. Recognizing the distinction between these two forces is essential for understanding modern climatology.
The 2015–2016 El Niño Southern Oscillation (ENSO)
The year 2015 played host to one of the strongest El Niño events ever recorded, rivaling the legendary events of 1982–1983 and 1997–1998. El Niño is characterized by the warming of surface waters in the central and eastern tropical Pacific Ocean. This massive injection of thermal energy from the ocean into the atmosphere temporarily spikes global mean temperatures. The 2015 El Niño altered global weather patterns, causing severe droughts in parts of Africa, Asia, and South America, while simultaneously triggering heavy precipitation events in North America.
The Underlying Baseline of Climate Change
While El Niño provided the short-term spike, human activities—primarily the burning of fossil fuels, industrial processes, and deforestation—provided the underlying upward trend. Without the background accumulation of greenhouse gases in the atmosphere, a natural cycle like El Niño would not have pushed global temperatures to such unprecedented extremes. Scientists noted that historical El Niño events of similar magnitude in the late 20th century did not yield global temperature anomalies as high as those recorded in 2015, proving that the planetary baseline had shifted permanently upward.
Global Impacts and Regional Climate Anomalies
The record warmth of 2015 manifested unevenly across the globe, creating distinct regional impacts that disrupted ecosystems, economies, and human livelihoods.
| Region / System | Primary 2015 Climate Impact | Associated Environmental Consequence |
|---|---|---|
| Arctic Circle | Record-low winter maximum sea ice | Accelerated permafrost thaw and coastal erosion |
| Coral Reefs | Widespread ocean warming and marine heatwaves | Triggering of the third global coral bleaching event |
| Western North America | Severe multi-year drought and high temperatures | Extensive, catastrophic wildfire seasons |
| Sub-Saharan Africa | Monsoonal disruptions and agricultural stress | Severe food insecurity and humanitarian challenges |
The Third Global Coral Bleaching Event
The thermal stress imposed on global oceans in 2015 triggered a massive, prolonged global coral bleaching event that began in mid-2014 and extended well into 2017. As ocean temperatures spiked, zooxanthellae—the microscopic algae that live symbiotically within coral tissues—were expelled, causing corals to turn white and starve. Iconic marine ecosystems, including parts of the Great Barrier Reef and reefs across the Pacific and Indian Oceans, suffered catastrophic mortality rates during this period.
Policy Watershed: The Paris Agreement
The extraordinary climatic conditions of 2015 served as a stark backdrop for international diplomacy. As scientists publicized mounting data regarding record warmth and accelerating ice loss, political leaders gathered in France for the 21st Conference of the Parties (COP21) of the United Nations Framework Convention on Climate Change (UNFCCC).
This diplomatic convergence culminated in the adoption of the Paris Agreement on December 12, 2015. 196 parties legally agreed to undertake ambitious efforts to combat climate change and adapt to its effects. A core pillar of the agreement was holding the increase in the global average temperature to well below 2°C above pre-industrial levels, while pursuing efforts to limit the temperature increase even further to 1.5°C. The sense of urgency catalyzed by the extreme weather and temperature records of 2015 was instrumental in achieving this unprecedented global consensus.
Frequently Asked Questions
Was 2015 the warmest year on record indefinitely?
No. While 2015 broke records at the time of its publication, subsequent years—particularly driven by recurring El Niño cycles and accelerating greenhouse gas accumulation—have continued to break global temperature records. The overall trend demonstrates a clear, unbroken warming trajectory over the past several decades.
How do scientists measure global temperature accurately?
Scientists calculate global temperature anomalies using thousands of land-based weather stations, ocean-going ships, moored and drifting buoys, and orbiting satellites. These diverse data streams undergo rigorous quality control, calibration, and spatial weighting to ensure that localized urban heat island effects or sensor changes do not skew the final global average.
What role did El Niño play compared to human-induced warming in 2015?
El Niño acts as a temporary amplifier of global temperatures by releasing heat stored in the Pacific Ocean into the atmosphere. However, human-induced greenhouse gas emissions provide the continuous thermal foundation. Natural variability like El Niño explains the year-to-year fluctuations, whereas industrial emissions explain the multi-decadal upward trend.
How did the 2015 temperature record impact international climate policy?
The clear, undeniable scientific evidence of record-breaking heat in 2015 created intense political momentum. This urgency directly influenced the successful negotiation and adoption of the Paris Agreement in December 2015, establishing global temperature targets that continue to guide international climate policy.
Recommended Next Actions
For researchers, students, and professionals examining historical climate milestones, reviewing the foundational data published by NOAA and NASA for the 2015 calendar year provides vital context. To explore how subsequent years compare to this benchmark, consult official reports from the World Meteorological Organization (WMO) or the Intergovernmental Panel on Climate Change (IPCC).