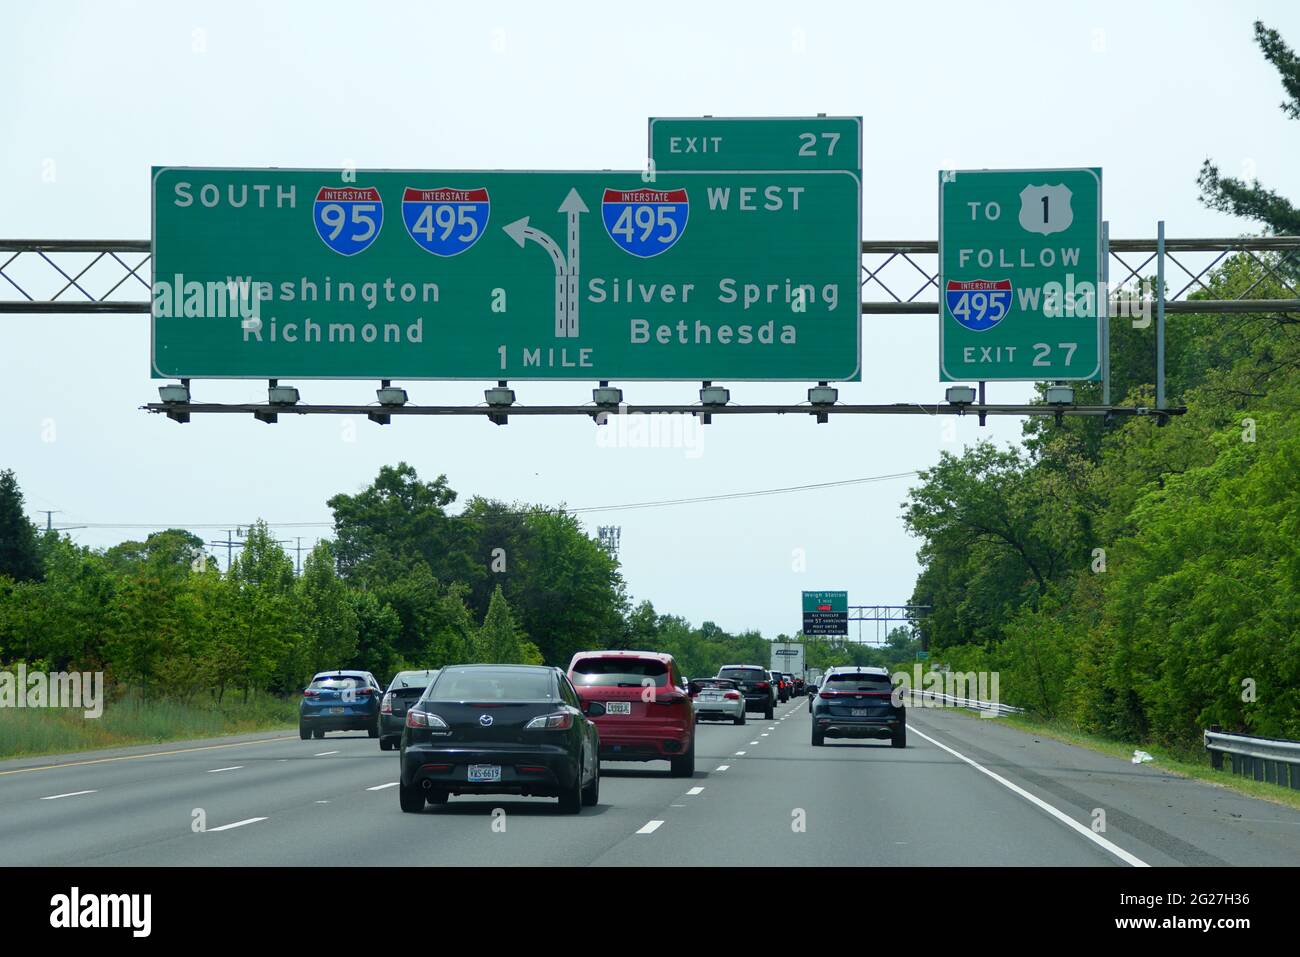
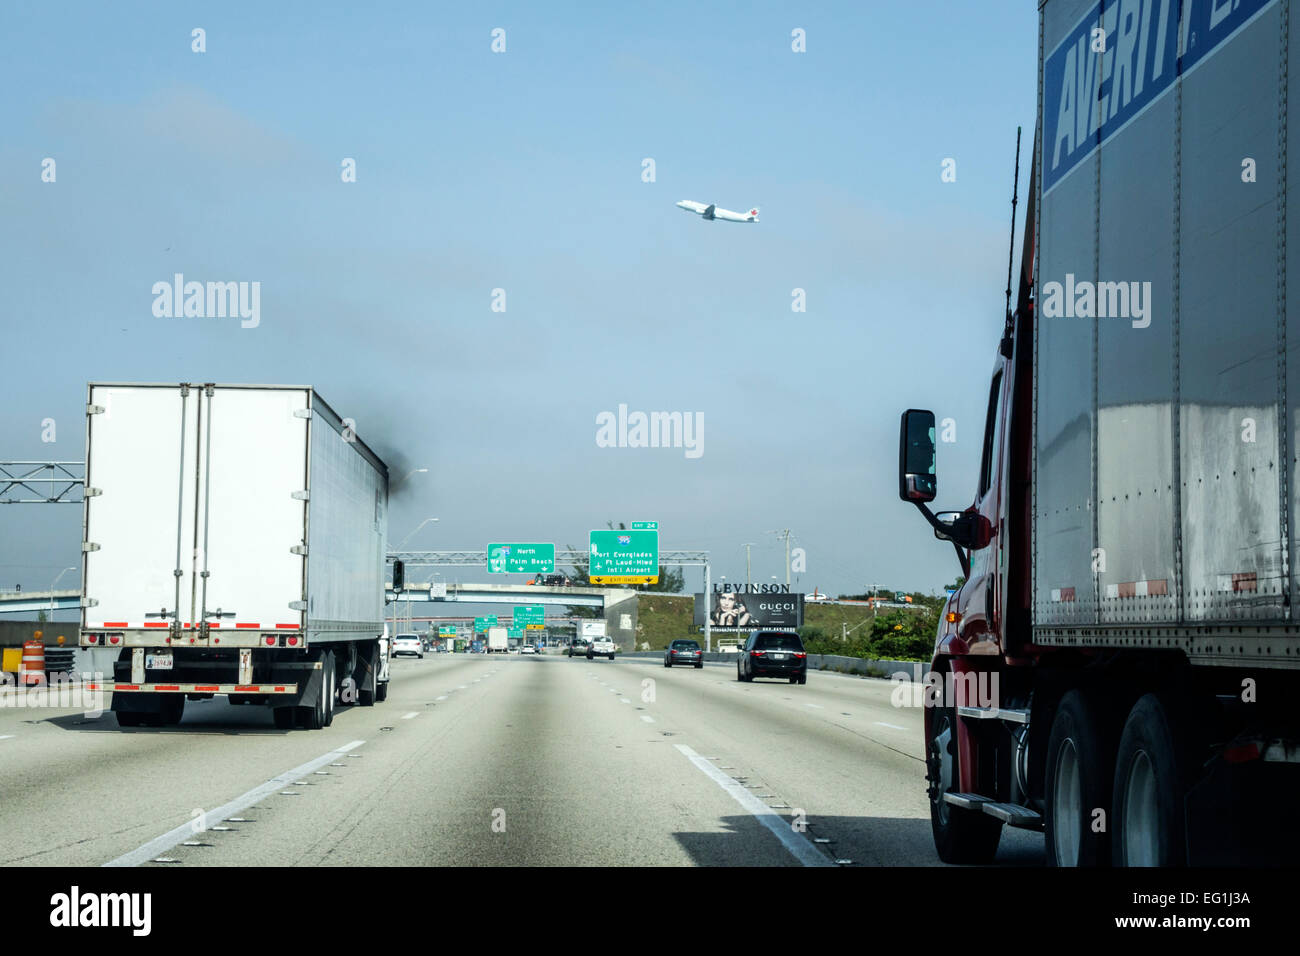
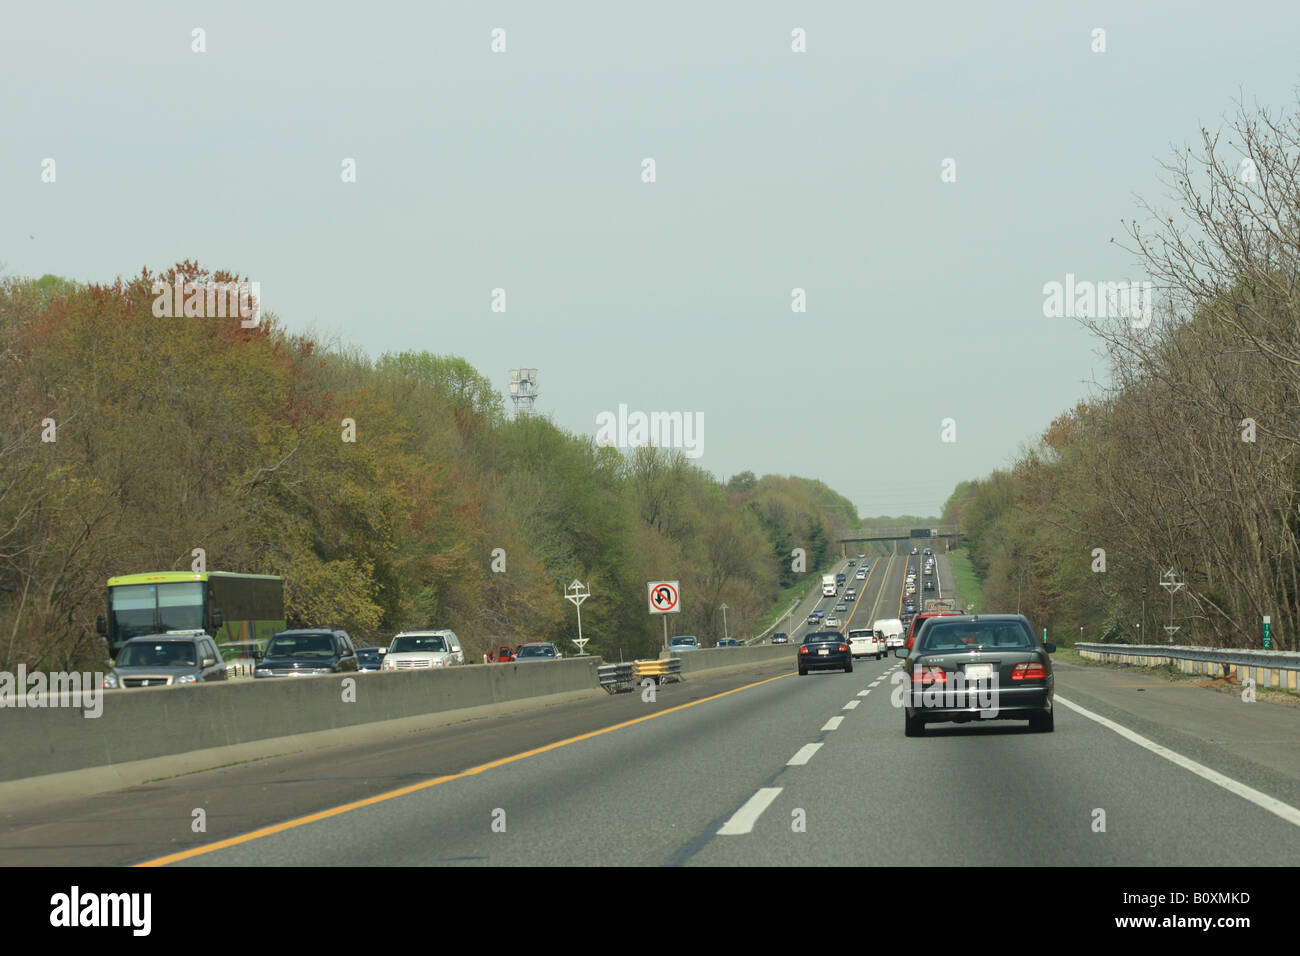
Analyzing Interstate 95 traffic changes involves evaluating shifting commuter patterns, the impact of multi-billion-dollar infrastructure projects, and the integration of real-time data analytics. By 2026, these changes are defined by a move toward managed toll lanes, the recovery of mid-week peak volumes, and the deployment of smart-corridor technologies across the 1,900-mile Eastern Seaboard.
The Evolution of the I-95 Corridor: A 2026 Perspective
Interstate 95 (I-95) remains the most critical transportation artery in the United States, serving as the primary link between the major economic hubs of the East Coast. However, the nature of traffic on this highway has undergone a fundamental transformation over the last several years. To analyze these changes effectively, one must look beyond simple congestion metrics and examine the interplay between demographic shifts, legislative funding, and technological advancement.
The passage of the Infrastructure Investment and Jobs Act (IIJA) several years ago has led to a peak in construction activity in 2026. This has created a paradoxical situation where long-term improvements—such as bridge replacements in Connecticut and lane expansions in Georgia—are causing short-term arterial friction. Furthermore, the decentralization of the workforce has smoothed out the traditional "rush hour" into a more sustained "rush day," where volume remains high from 7:00 AM through 7:00 PM in metropolitan segments like Northern Virginia and Philadelphia.
When analyzing these changes, it is essential to distinguish between recurrent congestion (caused by capacity issues) and non-recurrent congestion (caused by accidents, weather, or construction). In 2026, state Departments of Transportation (DOTs) are increasingly utilizing AI-driven predictive modeling to mitigate non-recurrent events, yet the underlying volume continues to grow as the population migrates toward the Southern United States.
Regional Breakdown of Traffic Pattern Shifts
The I-95 corridor is not a monolith. Traffic changes vary significantly by region, influenced by local geography and state-level transit policies.
The Northeast Megalopolis (Boston to Washington, D.C.)
In the Northeast, the primary driver of traffic change is the aging infrastructure and the density of urban centers. In 2026, the focus has shifted toward "Integrated Corridor Management." For example, in the New York and Connecticut segments, traffic analysis shows a 12% increase in off-peak commercial trucking volume compared to five years ago. This is largely due to the "Amazon effect" and the proliferation of last-mile delivery hubs that rely on I-95 as a staging ground.
In Philadelphia, the completion of major sections of the Revive 95 project has improved flow through the city's center, but bottlenecks have moved further north into the Bucks County transition zones. Analysts observe that while throughput has increased, average speeds remain low during midday hours due to the sheer volume of "lifestyle trips"—non-work-related travel that has surged in the post-pandemic economy.
The Mid-Atlantic and the "Express Lane" Era
Virginia and Maryland represent the most aggressive adoption of managed lanes. The extension of the I-95 Express Lanes toward Fredericksburg has fundamentally altered how commuters approach the D.C. metro area. By 2026, data suggests a "choice-based" traffic model where those willing to pay dynamic tolls experience speeds 30% higher than those in general-purpose lanes. However, this has led to "merge-point friction," where the transition from express to general lanes creates significant localized slowdowns.
The Southeast: Growth and Expansion
North Carolina, South Carolina, Georgia, and Florida are dealing with the most rapid increases in Annual Average Daily Traffic (AADT). Analysis of the Florida segments, particularly through Jacksonville and Miami, reveals that traffic volume has surpassed 2019 levels by nearly 20%. The changes here are driven by population growth rather than commuting shifts. In 2026, Georgia’s multi-billion dollar "Commercial Vehicle Lanes" project is a primary focus for analysts, as it seeks to separate heavy freight from passenger vehicles to improve safety and flow.
Key Drivers of Traffic Variability in 2026
To conduct a professional analysis of I-95, one must categorize the variables influencing current flow. These variables serve as the "why" behind the data points seen on traffic maps.
- The Rise of "Super-Commuting": As housing prices in urban cores have remained high, more workers are living 50–100 miles away from their offices. This has increased the length of the average I-95 trip, leading to higher vehicle miles traveled (VMT) even if the number of individual trips remains stable.
- Climate-Induced Traffic Disruptions: By 2026, "sunny day flooding" in coastal segments (particularly in South Carolina and Florida) has become a measurable factor in traffic delay. Analysts now must account for tidal cycles when predicting I-95 congestion in low-lying areas.
- Electric Vehicle (EV) Adoption and Weight Metrics: The increased weight of EVs compared to traditional internal combustion engine vehicles is accelerating pavement wear. This results in more frequent "maintenance-of-way" closures, which are a leading cause of weekend traffic spikes.
- Autonomous and Semi-Autonomous Freight: The testing of "platooning" (where trucks follow each other closely using automated systems) on I-95 in North Carolina has shown promise in increasing lane capacity, though it requires specific analysis of "gap-related" safety incidents.
Technical Analysis of Key I-95 Segments (2026 Data)
The following table compares the current status and primary traffic influencers for five critical segments of the I-95 corridor.
| Segment Location | 2026 Congestion Level | Primary Driver of Change | Recent Infrastructure Status |
|---|---|---|---|
| Stamford, CT | Extreme | Commercial Freight Volume | Bridge Replacement Completion (2025) |
| Philadelphia, PA | High | Urban Infill & Lifestyle Trips | I-95 CAP Construction Progress |
| Fredericksburg, VA | Moderate-High | Express Lane Convergence | Fredericksburg Extension Operational |
| Savannah, GA | Moderate | Port of Savannah Expansion | Lane Widening Phase 3 Underway |
| Miami, FL | Extreme | Population Density/Tourism | Smart Signal Integration Deployment |
Methodology for Analyzing Traffic Changes
Professional traffic analysts utilize a "layered data" approach to understand Interstate 95. If you are looking to perform your own analysis—whether for logistics planning, real estate investment, or urban studies—follow these methodological steps.
Step 1: Historical Baseline Comparison
Start by comparing current AADT (Annual Average Daily Traffic) with 2019 (pre-pandemic) and 2023 (post-pandemic recovery) data. Most state DOTs provide this through their "Traffic Data Programs" online. Look specifically for the "K-factor," which represents the proportion of daily traffic occurring during the peak hour. A declining K-factor while total volume rises suggests that traffic is spreading out across the day, a phenomenon known as "peak spreading."
Step 2: Evaluating Probe Data
Modern analysis relies heavily on "probe data" from GPS devices, smartphones, and connected vehicles. Companies like INRIX and HERE Technologies provide granular data that shows not just that a delay exists, but exactly where the "bottleneck head" and "bottleneck tail" are located. In 2026, the focus is on Travel Time Reliability (TTR). TTR measures the consistency of travel times; a high TTR means you can count on a 30-minute drive taking 30 minutes every day, whereas a low TTR suggests unpredictable delays.
Step 3: Assessing the Impact of Alternative Routes
I-95 does not exist in a vacuum. Changes on parallel routes—such as US-1, I-295 (the various bypasses), and even Amtrak’s Northeast Corridor—affect I-95 volume. For example, a 2026 analysis shows that improvements to high-speed rail in the Northeast have successfully diverted approximately 3% of passenger car traffic from I-95 during holiday weekends.
Technology and Smart Corridors
The most significant "unseen" change in 2026 is the deployment of Vehicle-to-Infrastructure (V2I) technology. Along stretches of I-95 in Maryland and Delaware, "smart" roadside units communicate directly with newer vehicles to provide real-time hazard warnings and speed recommendations.
This technology aims to reduce the "accordion effect"—the wave of braking that travels backward through a line of cars. By analyzing "shockwave data," engineers can now adjust variable speed limit signs miles ahead of a slowdown to prevent the hard braking that leads to rear-end collisions. When analyzing traffic changes, the presence of these systems often correlates with a decrease in the severity of congestion, even if the total volume remains high.
Environmental and Policy Considerations
Traffic analysis in 2026 is increasingly tied to environmental mandates. Under current federal guidelines, states are required to monitor carbon emissions along the I-95 corridor. This has led to "congestion pricing" discussions in urban centers like New York City, which indirectly impacts I-95 flow by encouraging motorists to bypass the city core or use mass transit.
Furthermore, the "National Electric Vehicle Infrastructure" (NEVI) formula program has resulted in the installation of high-speed charging hubs every 50 miles along I-95. This has changed "stop behavior." Instead of quick 10-minute fuel stops, analysts are seeing longer 20–30 minute dwell times at service plazas, which affects the flow of traffic entering and exiting the highway at specific nodes.
Frequently Asked Questions
How has the "Tuesday-Wednesday-Thursday" office schedule affected I-95?
The shift to hybrid work has created "mid-week peaks." In 2026, traffic volume on Tuesdays, Wednesdays, and Thursdays often exceeds historical Monday and Friday peaks. This concentration of travel into a three-day window has made mid-week congestion more intense, while Mondays and Fridays have become more predictable and easier for long-distance travel.
Are the toll lanes on I-95 actually reducing traffic?
Toll lanes (or Express Lanes) do not necessarily reduce the total number of cars on the road, but they improve throughput efficiency. By offering a guaranteed speed for a price, they prevent the entire highway from reaching a standstill. Analysis shows that these lanes are most effective in corridors with high "time-value" travelers, such as Northern Virginia and South Florida.
What is the most congested segment of I-95 in 2026?
While historically the George Washington Bridge (NY/NJ) held this title, the most significant "unreliable" segment in 2026 is the I-95 corridor through Stamford, Connecticut. The combination of high truck volume, narrow rights-of-way, and ongoing bridge maintenance makes it the most prone to unpredictable delays.
How do seasonal changes impact I-95 traffic analysis?
Seasonality remains a massive factor. The "Snowbird" migration (travelers moving between the Northeast and Florida) in the late fall and early spring creates a 15–20% surge in volume in the Carolinas and Georgia. Additionally, summer tourism creates weekend-long congestion in coastal regions from Maine down to Virginia Beach.
How accurate are AI traffic predictions in 2026?
AI models are now roughly 85-90% accurate in predicting "recurrent" congestion (daily patterns). However, they still struggle with "black swan" events, such as major multi-vehicle accidents or sudden severe weather, which can disrupt I-95 for 6–12 hours at a time.
Final Recommendations for Navigating and Analyzing I-95
For individuals and organizations looking to adapt to I-95 traffic changes in 2026, the following actions are recommended:
- Utilize Predictive Routing: Move beyond basic GPS apps and use professional-grade tools that account for "historical trend layering" and "real-time construction feeds."
- Monitor State DOT Social Feeds: In 2026, state DOTs (like VADOT or PennDOT) provide the most accurate, second-by-second updates on "active traffic management" interventions.
- Plan Around "The Mid-Week Squeeze": If possible, schedule long-distance freight or personal travel for Mondays or Fridays to avoid the heavy hybrid-commuter volume now prevalent in the middle of the week.
- Invest in V2X-Compatible Technology: For fleet managers, ensuring vehicles are equipped with V2X (Vehicle-to-Everything) receivers will be critical for receiving real-time safety and speed optimization data directly from the I-95 infrastructure.
Interstate 95 is no longer just a road; it is a complex, data-driven ecosystem. Success in navigating or analyzing it requires a deep understanding of how physical infrastructure, digital data, and human behavior intersect in this ever-evolving corridor.