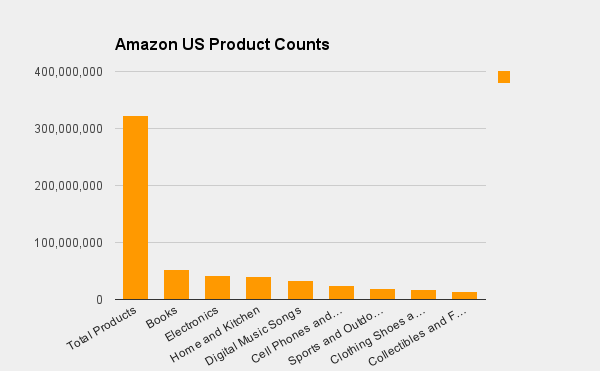
As of early 2026, the total number of individual products available across all Amazon global marketplaces is estimated to exceed 600 million distinct ASINs. While the United States remains the largest single catalog with approximately 360 million products, rapid expansion in emerging markets like India and Brazil has significantly bolstered the global figure, driven largely by third-party sellers.
Understanding the Scale of the Amazon Catalog
To accurately quantify how many products are on Amazon, one must first distinguish between a "product," a "listing," and an "ASIN." The Amazon Standard Identification Number (ASIN) is the foundational unit of the catalog. A single ASIN may represent a specific item, but through "variations" (different sizes, colors, or pack counts), a single parent product can encompass dozens of child ASINs.
By 2026, the complexity of this catalog has reached unprecedented levels. The distinction between first-party (1P) inventory—items sold directly by Amazon—and third-party (3P) inventory—items sold by independent merchants—is critical. While Amazon’s own inventory consists of roughly 12 to 15 million core products, the vast majority of the 600 million+ items are contributed by the millions of active third-party sellers who utilize the Fulfillment by Amazon (FBA) and Merchant Fulfilled (FBM) programs.
The Evolution of the ASIN System
In 2026, the ASIN system has evolved to integrate more robust metadata, including sustainability certifications and localized compliance data. This evolution was necessary to manage the sheer volume of data points. When we discuss "product count," we are typically referring to active, buyable listings. However, the "shadow catalog"—which includes out-of-stock items or suppressed listings—is estimated to be nearly double the active count, reflecting a decade of retail history stored within Amazon's servers.
Current Product Figures by Region in 2026
The distribution of products is not uniform across the globe. Mature markets show slower growth but higher quality listings, while emerging markets are experiencing a "listing explosion."
The North American Market (Amazon.com, .ca, .mx)
The U.S. marketplace remains the benchmark for product diversity. With over 360 million products, it offers the highest density of niche goods. In 2026, we have observed a trend toward "catalog cleaning," where Amazon has used AI-driven audits to remove duplicate or low-quality listings, keeping the growth rate stable at roughly 5-7% annually rather than the double-digit spikes seen in the early 2020s.
The European Expansion (EU5 and Beyond)
In Europe, the consolidated product count across the UK, Germany, France, Italy, and Spain exceeds 250 million items. However, due to the Digital Services Act (DSA) and stricter environmental regulations implemented through 2025, the barrier to entry for new products is higher. Sellers must now provide more comprehensive documentation before an ASIN becomes active, which has slightly throttled the raw volume of new listings in favor of higher compliance.
Emerging Powerhouses: India and Brazil
Amazon India (Amazon.in) has become a primary driver of global SKU growth. In 2026, the Indian catalog has surpassed 200 million products, fueled by the "Local Shops on Amazon" initiative and a massive influx of regional MSMEs (Micro, Small, and Medium Enterprises). Brazil has followed a similar trajectory, becoming the fastest-growing marketplace in terms of percentage growth in 2025 and 2026.
Breakdown of Product Categories and Dominance
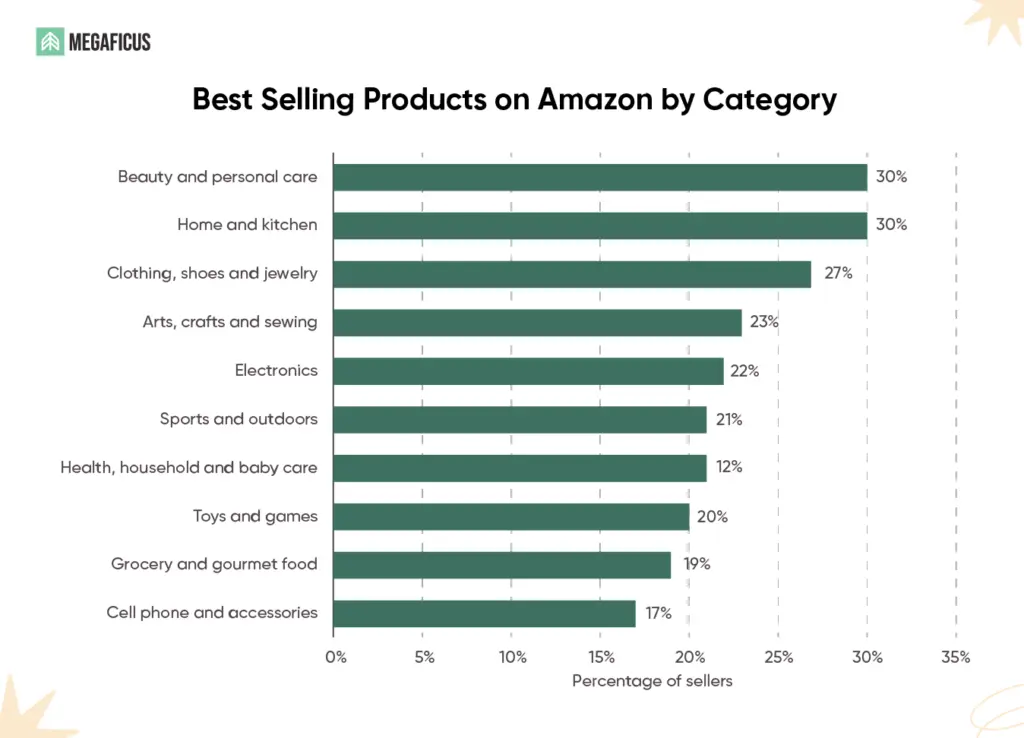
The distribution of products across categories reveals much about consumer behavior and market saturation. Not all categories are created equal; some are heavily commoditized, while others remain fragmented.
| Category | Estimated Product Count (US) | Growth Trend (2025-2026) | Competitive Saturation |
|---|---|---|---|
| Home & Kitchen | 105 Million | High Growth | Very High |
| Clothing, Shoes & Jewelry | 65 Million | Moderate (High Churn) | High |
| Electronics | 45 Million | Stable | High |
| Books | 50 Million | Low Growth | Moderate |
| Beauty & Personal Care | 30 Million | High Growth | Medium-High |
| Grocery & Gourmet Food | 12 Million | Explosive | Low-Medium |
| Industrial & Scientific | 8 Million | Moderate | Low |
The Dominance of Home & Kitchen
Home & Kitchen continues to hold the largest share of the catalog. This is due to the low barrier to entry for private-label sellers and the infinite variations of household goods. In 2026, this category also sees the highest rate of "zombie listings"—products that are technically active but have zero sales velocity.
The Grocery Pivot
A significant trend in 2026 is the expansion of the Grocery & Gourmet Food category. While the product count is lower than in Electronics, the frequency of new ASIN additions is higher. Amazon’s integration of physical retail data with online listings has encouraged more local food producers to list their inventory, leading to a 20% year-over-year increase in this specific segment.
Key Trends Shaping the Catalog in 2026
Several technological and economic factors have influenced how product counts have shifted over the last 24 months.
1. The Proliferation of AI-Generated Content
By 2026, the majority of new product listings are created using generative AI. This has led to a massive increase in the number of "long-tail" products. Sellers can now launch localized versions of products with optimized titles and descriptions in minutes. However, this has also created a challenge for Amazon in managing "listing clutter," where nearly identical products flood the search results under different brand names.
2. Marketplace Consolidation and Brand Registry
Amazon has aggressively pushed its Brand Registry program. In 2026, products listed by registered brands receive priority in search and better protection against counterfeiters. This has led to a trend where serious sellers are consolidating their catalogs—focusing on 10 high-quality ASINs rather than 100 generic ones. This "quality over quantity" shift is a primary reason why the total product count hasn't ballooned to billions, despite the increase in the number of sellers.
3. Sustainability and Circular Economy Listings
A new and significant trend in 2026 is the rise of the "Amazon Second Chance" or "Refurbished" catalog. With global pressure on ESG (Environmental, Social, and Governance) standards, Amazon has integrated used and refurbished items more deeply into the main search results. The product count for "Renewed" items has grown by 30% since 2024, reflecting a shift in consumer preference toward sustainable consumption.
4. Direct-from-Manufacturer (C2M) Growth
The "Consumer-to-Manufacturer" model, popularized by platforms like Temu and Shein, has forced Amazon to adapt. In 2026, we see a higher percentage of factory-direct listings originating from China, Vietnam, and Turkey. These listings often bypass traditional distributors, leading to a surge in unique, unbranded SKUs that compete purely on price.
Challenges in Accurately Counting Amazon Products
While 600 million is the widely accepted figure among retail analysts in 2026, the number is fluid for several reasons:
- Regional Overlap: Many products are listed on multiple marketplaces (e.g., .com and .ca) with different ASINs for the same physical item. This can lead to double-counting in global estimates.
- Listing Suppression: Amazon’s automated systems suppress thousands of listings daily for policy violations (pricing errors, prohibited claims, or copyright issues). These items exist in the database but are not "countable" from a consumer perspective.
- Dynamic Inventory: Seasonal products (e.g., holiday decorations) may account for 15% of the catalog in Q4 but essentially "disappear" or go inactive during the rest of the year.
Strategic Implications for Sellers and Investors
For those analyzing Amazon’s scale in 2026, the sheer number of products is less important than the Search Volume to SKU Ratio. In highly saturated categories like "Phone Cases," there may be 5 million products competing for 1 million monthly searches. Conversely, in specialized niches like "Industrial Lab Equipment," there may only be 50,000 products for 200,000 searches.
Investors should note that Amazon’s growth is no longer driven by adding more products, but by increasing the efficiency of the existing catalog through better AI-driven discovery and high-margin services like Amazon Advertising, which now accounts for a significant portion of the platform's revenue.
Frequently Asked Questions
How many products does Amazon sell directly (1P) compared to third-party sellers (3P)?
In 2026, Amazon's direct sales (1P) account for approximately 12 to 15 million products. These are typically high-volume, "essential" items. In contrast, third-party sellers (3P) provide over 97% of the total catalog, encompassing more than 585 million ASINs. This 3P dominance is the core of Amazon’s "long tail" business model.
Is the number of products on Amazon still increasing in 2026?
Yes, but the rate of growth has stabilized. Between 2015 and 2020, the catalog grew exponentially. In 2026, growth is more "replacement-based." For every new electronic gadget listed, an older, obsolete model is often archived or removed. The current annual net growth rate is estimated at 5-8% globally.
Which country has the most products on Amazon?
The United States (Amazon.com) remains the leader with over 360 million products. India is the fastest-growing major marketplace, currently holding the second-largest product count, followed by Germany and the United Kingdom.
Why do product counts vary so much between different reports?
Discrepancies usually arise from the definition of a "product." Some reports count only "unique items" (parent ASINs), while others count every possible variation (child ASINs). Furthermore, some analysts include out-of-stock items, while others only count active, buyable inventory.
How does Amazon's product count compare to competitors like Walmart or eBay?
As of 2026, Amazon remains the global leader. While Walmart has aggressively expanded its marketplace to over 150 million products, it still trails Amazon’s U.S. catalog. eBay maintains a high count (estimated at 1.8 billion listings), but a vast majority of those are unique, one-off used items rather than standardized retail products.
Final Recommendation
For businesses looking to enter the Amazon ecosystem in 2026, the key is to avoid "catalog noise." With over 600 million products available, success is no longer about simply being present; it is about brand authority and data accuracy. Sellers should prioritize enrolling in Brand Registry to differentiate their products from the hundreds of millions of generic listings. For researchers and investors, monitoring the growth of the Grocery and Industrial sectors provides the best insight into Amazon’s next phase of market capture, as these categories currently show the highest ratio of demand-to-SKU availability.