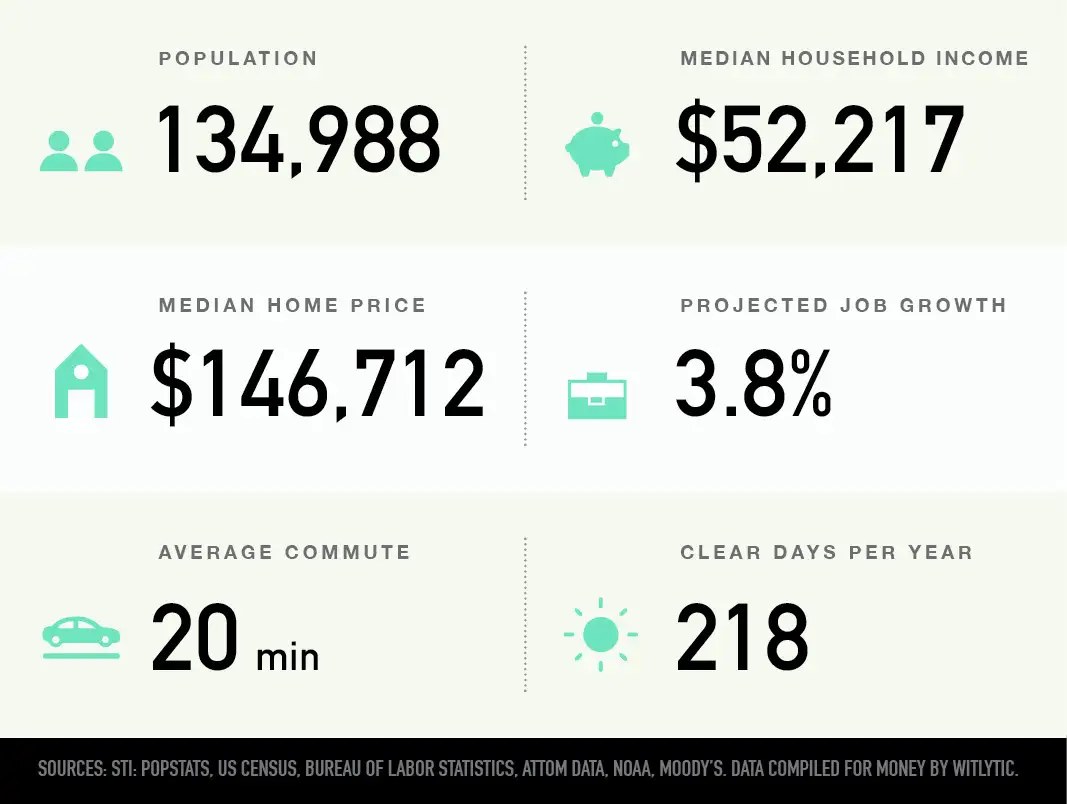
The population outlook for Columbia, South Carolina, reflects steady, sustained demographic expansion driven by job creation, high affordability, and stable institutional anchors. The Columbia Metropolitan Statistical Area (MSA) reaches an estimated 860,000 residents, supported by strong suburban growth in Lexington County, urban revitalization in Richland County, and continuous student and military rotation.
Columbia Metropolitan Demographic Profile:
- Core Anchors: State Govt | USC | Fort Jackson
- Richland County: Urban Core, Higher Density
- Lexington County: Rapid Suburban & Family Expansion
- Primary Drivers: Affordable Housing & Lower Cost of Living
Columbia Demographics and Population Overview
Understanding the population trajectory of Columbia requires distinguishing between the municipality itself and the broader metropolitan statistical area (MSA). While the municipal boundaries of the City of Columbia encompass roughly 138,000 to 140,000 residents, the multi-county metro area—comprising Richland, Lexington, Kershaw, Fairfield, Saluda, and Calhoun counties—serves as the true economic and demographic footprint of the region.
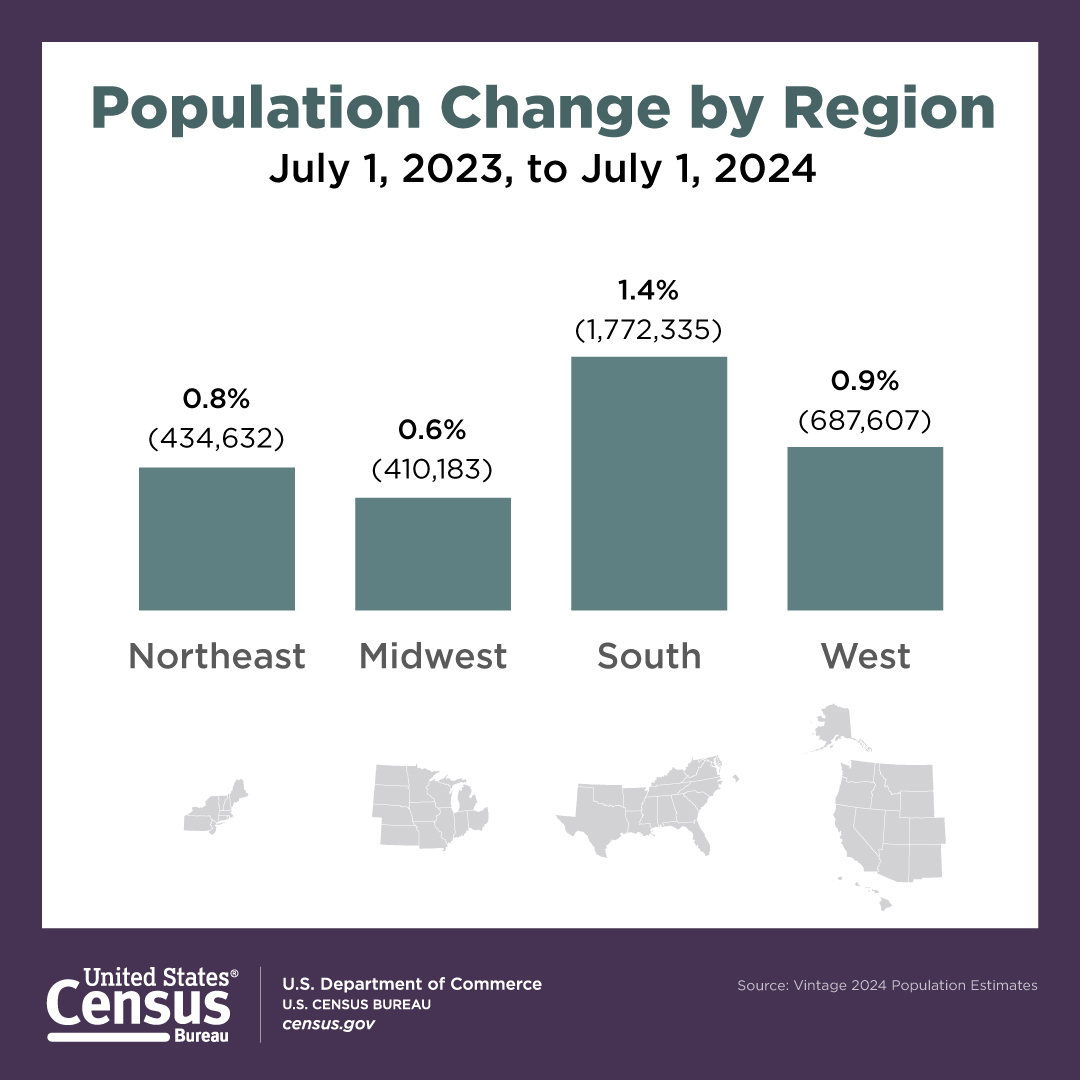
South Carolina consistently ranks among the top five fastest-growing states by percentage population change in U.S. Census Bureau estimates. While coastal metros like Charleston and Horry County (Myrtle Beach) along with Upstate hubs like Greenville experience high-profile migration surges, the Midlands region anchored by Columbia delivers durable, institutional growth. Columbia's growth model is less volatile than tourism- or retirement-dependent coastal markets because it relies heavily on state government administration, higher education, defense, and healthcare systems.
| Columbia Metro Demographic Snapshot | Value |
|---|---|
| City of Columbia Population: | ~138,000 - 140,000 |
| Columbia MSA Population: | ~855,000 - 865,000 |
| Statewide Growth Rank (SC): | Top 5 Nationally by % Growth |
| Primary Growth Center: | Lexington County Suburban Corridor |
Demographic shifts across the metro exhibit two distinct patterns:
- Urban Core Densification: High-density residential infill in downtown Columbia, the Vista, BullStreet District, and West Columbia attracting university students, young professionals, and health sector personnel.
- Suburban Expansion: Rapid single-family residential development in Lexington, Chapin, Irmo, and Blythewood driven by families seeking top-performing public school districts and lower land costs.
Primary Drivers of Demographic Expansion in the Midlands
The expansion of Columbia's population base rests on four foundational economic and structural drivers. Unlike regions reliant on a single dominant industry, Columbia benefits from a multi-pillar economy that insulates it from severe macroeconomic downturns while supporting steady inbound migration.
Inbound Migration Catalysts:
- Higher Education (USC Campus)
- Institutional Anchors (Govt & Fort Jackson)
- Cost of Living (Housing Value)
- Economic Shift (Logistics & Mfg)
1. Higher Education and Student Population Retention
The University of South Carolina (USC) system serves as a major demographic driver in the state. The flagship Columbia campus enrols over 36,000 undergraduate and graduate students, employing thousands of faculty and administrative staff. USC brings an annual influx of young adults to the city center, many of whom remain in the Midlands after graduation due to emerging tech, administrative, and engineering job opportunities.
USC's ongoing capital developments—such as the expanding Health Sciences Campus at the BullStreet District—further cement the university's role in attracting researchers, medical professionals, and specialized clinical personnel to the urban core.
2. Military and Federal Government Presence
Fort Jackson, located within Richland County, is the U.S. Army’s largest and most active Basic Combat Training center. Train-up activity brings more than 45,000 basic training soldiers and 12,000 additional advanced military personnel through the installation each year.
While basic trainees represent a transient population, Fort Jackson maintains a permanent cadre of several thousand active-duty military personnel, civilian Department of Defense employees, defense contractors, and military families. Additionally, McEntire Joint National Guard Base in eastern Richland County reinforces the regional defense economy, attracting veteran households who settle permanently in the Midlands upon retirement.
3. Cost-of-Living and Housing Affordability Advantages
Rising living costs in major Southeastern urban centers like Atlanta, Charlotte, Raleigh, and Charleston have positioned Columbia as an attractive alternative for regional transplants.
- Housing Value: Median single-family home prices in the Columbia MSA remain substantially lower than in Charleston or Charlotte, allowing buyers to secure larger properties and newer construction at more accessible price points.
- Property Taxes: South Carolina’s owner-occupied residential property tax structure (assessed at a 4% ratio for primary residences) offers significant operational savings for homeowners compared to neighboring states.
- Corporate Relocation: Lower commercial real estate costs and favorable tax environments encourage small-to-midsize enterprises to establish regional offices in the Midlands.
4. Healthcare Infrastructure and Industrial Diversification
The healthcare sector forms one of Columbia's largest employment bases, anchored by hospital networks including Prisma Health, Lexington Medical Center, and the Wm. Jennings Bryan Dorn VA Medical Center. As the population ages statewide, the expansion of medical facilities creates high-skilled nursing, surgical, and administrative jobs.
Simultaneously, the Midlands manufacturing and logistics corridor along Interstate 77 and Interstate 26 continues to attract industrial investment. Major manufacturing facilities, distribution centers, and clean-energy supply chain developments across Richland, Lexington, and Kershaw counties generate steady blue-collar and engineering employment growth.
Regional Breakdown: Richland vs. Lexington Counties
The demographic dynamics of the Columbia MSA vary significantly between its two primary counties. Understanding these distinctions is critical for real estate developers, municipal planners, and expanding businesses.
| Richland County | Lexington County |
|---|---|
| Seats state capital & USC | High suburban growth rate |
| Higher rental/multifamily ratio | High homeownership rate |
| Urban infill focus (BullStreet) | Master-planned communities |
| Population: ~425,000+ | Population: ~305,000+ |
Richland County: Urban Density and Institutional Stability
Richland County accounts for the larger total population share, exceeding 425,000 residents. It houses the state government complex, the primary USC campus, Fort Jackson, and major regional hospitals. Growth in Richland County relies primarily on urban infill, adaptive reuse, and high-density commercial corridors.
Key growth areas within Richland County include:
- The BullStreet District: A 181-acre campus transformation representing one of the largest urban redevelopments in the Southeast, combining medical research facilities, retail, apartments, and single-family residences.
- Blythewood and Northeast Richland: Suburban corridors along I-77 that attract families seeking newer residential subdivisions and proximate access to industrial job centers.
- Downtown Columbia & Cayce/West Columbia Riverbanks: Strong apartment demand driven by graduate students, young professionals, and state employees.
Lexington County: Rapid Suburban and Family Expansion
Lexington County, located west and south of the Congaree River, exhibits higher annual percentage growth rates than Richland County. With a population exceeding 305,000, Lexington County's expansion is driven by master-planned residential developments, top-rated school systems (such as Lexington County School District One), and expanding commercial corridors along U.S. Route 1 and Interstate 20.
Key growth areas within Lexington County include:
- Town of Lexington: A fast-growing suburban center seeing high demand for commercial services, retail, and healthcare facilities.
- Chapin and Lake Murray Corridor: Premium residential growth catering to higher-income households, remote workers, and retirees seeking waterfront living.
- Irmo and West Columbia: Key infill and suburban redevelopment zones benefiting from proximity to downtown Columbia employment nodes.
Age Distribution, Migration Shifts, and Workforce Patterns
Columbia’s demographic composition differs markedly from the coastal communities of South Carolina, which skew heavily toward retirees. The Midlands maintains a balanced median age, creating a resilient local workforce and sustained demand across both entry-level rental housing and move-up single-family properties.
Columbia MSA Demographic Composition:
- Young Adults (18–24): University & Military Impact
- Prime Working Age (25–54): Public & Private Sector
- Mature Adults & Retirees (55+): Lake & Suburban Living
Young Adult and Student Cohort (Ages 18–24)
Due to the University of South Carolina, Benedict College, Columbia College, and Midlands Technical College, the city of Columbia exhibits a high concentration of residents aged 18 to 24. This demographic maintains strong demand for multi-family rental units, entertainment venues, and entry-level service employment.
Prime Working-Age Professionals (Ages 25–54)
The influx of working-age adults to the Columbia MSA is supported by public sector administration, regional health systems, corporate logistics, and manufacturing plants. Remote and hybrid work arrangements have accelerated inbound domestic migration, as professionals from higher-cost Northeastern and West Coast markets relocate to Columbia for better housing affordability and lifestyle amenities.
Active Retirees and Senior Cohort (Ages 55+)
While coastal South Carolina captures the largest volume of out-of-state retirees, the Columbia area—particularly the communities surrounding Lake Murray—attracts retirees who prefer access to academic medical centers, lower natural hazard risks compared to the immediate coastline, and direct highway access to major regional hubs.
Statistical Comparison: Columbia MSA Growth Metrics
The table below summarizes key demographic indicators, population totals, and economic growth drivers across the core sub-markets within the Columbia Metropolitan Area based on current Census and regional planning data.
| Sub-Market / Jurisdiction | Estimated Population | Primary Housing Type | Key Growth Drivers | Primary Demographic Focus |
|---|---|---|---|---|
| City of Columbia | ~138,500 | Multi-family rentals, historic single-family | State government, USC campus, healthcare hubs | College students, young professionals, public sector workers |
| Richland County (Total) | ~428,000 | Urban apartments, suburban single-family | Fort Jackson, higher education, industrial manufacturing | Diverse workforce, military personnel, urban households |
| Lexington County (Total) | ~308,000 | Single-family subdivisions, lakefront homes | School performance, suburban commercial development | Families, move-up buyers, active retirees |
| Kershaw County | ~68,500 | Rural residential, single-family developments | Industrial expansion, lower land costs, I-20 access | Commuters, manufacturing workers, rural land buyers |
| Columbia MSA (Total) | ~860,000 | Mixed urban, suburban, and rural housing | Institutional anchors, economic diversification, affordability | Broad regional demographic spectrum |
Infrastructure and Housing Challenges Created by Population Growth
Sustained demographic expansion in the Midlands creates several operational and infrastructural challenges that local municipalities must address to maintain long-term economic competitiveness.
Growth Impact Challenges:
- Traffic Density (I-26 / I-20 Malfunction Jct)
- School Capacity (Lexington & Richland Dists)
- Utility Demand (Water Infrastructure)
Infrastructure and Transportation Bottlenecks
The rapid expansion of suburban populations in Lexington, Chapin, and Northeast Richland places significant pressure on existing highway networks. The primary bottleneck in the region—the interchange complex of Interstate 26 and Interstate 20 (known locally as "Malfunction Junction")—is undergoing a multi-phase, multi-billion-dollar infrastructure overhaul by the South Carolina Department of Transportation (SCDOT) titled the Carolina Crossroads project.
SCDOT Carolina Crossroads Project:
- Target: Upgrade I-26 / I-20 / I-126 Interchange Node
- Goal: Relieve congestion for suburban commuters
- Status: Multi-phase construction active across metro
Completing these highway improvements is essential to maintaining reasonable commute times for suburban residents traveling into downtown Columbia and major industrial parks.
Housing Supply and Affordability Pressures
While Columbia remains affordable relative to regional benchmarks, accelerated population growth has pushed median home values higher and lowered inventory levels across suburban neighborhoods. Renters in downtown neighborhoods face escalating monthly rates as new multi-family developments cater to luxury student housing and high-income professionals. Municipalities are responding by encouraging mixed-income housing initiatives and evaluating zoning codes to facilitate missing-middle housing developments.
School District Capacity Management
Rapid population growth in suburban areas requires continuous investment in public school infrastructure. Lexington County School District One and Richland County School District Two frequently adjust attendance zones and construct new elementary and high school facilities to accommodate growing student bodies in expanding subdivisions.
Future Demographic Outlook: Projections for the Next Decade
Projections from the South Carolina Revenue and Fiscal Affairs Office and regional planning councils indicate that the Columbia MSA will maintain a steady annual growth rate of 0.8% to 1.2% over the coming decade. This trajectory represents sustainable, manageable expansion compared to hyper-growth markets like Myrtle Beach or coastal Florida.
Long-Term Demographic Trend Summary:
- Regional Population (MSA): Projected to pass 900,000 before 2035
- Primary Growth Corridor: I-26 West toward Chapin/Newberry
- Secondary Growth Corridor: I-77 North toward Blythewood/Ridgeway
- Real Estate Focus: Multi-family urban core infill + suburban buildout
Key Trends to Watch:
- The 900,000 MSA Milestone: The Columbia metropolitan area is projected to surpass 900,000 total residents before 2035, bringing increased attention from national retailers, corporate employers, and institutional real estate investors.
- Continued Westward Suburban Shift: Growth will continue expanding along the Interstate 26 corridor toward Chapin and Newberry County, driven by homebuyers seeking larger lots and established school zones.
- Institutional Investments in Downtown: Ongoing capital spending by the University of South Carolina, Prisma Health, and downtown real estate developers will maintain high residential occupancy rates within the urban core.
Frequently Asked Questions
Is Columbia, SC growing faster than Charleston or Greenville?
In terms of raw percentage growth, coastal areas like Charleston and Horry County, along with parts of the Upstate (Greenville-Spartanburg), often record higher annual growth percentages. However, Columbia delivers steady, stable absolute population growth supported by state government, military, and university anchors that are less sensitive to economic cycles.
What is the current population of the Columbia, SC metro area?
The Columbia Metropolitan Statistical Area (comprising Richland, Lexington, Kershaw, Fairfield, Saluda, and Calhoun counties) has an estimated population of approximately 860,000 residents.
Why are households relocating to Columbia, South Carolina?
Primary catalysts include strong job stability in healthcare, government, and education; high housing affordability relative to national metrics; favorable property tax rates; proximity to outdoor amenities like Lake Murray; and a central state location with access to mountains and coastlines via major interstates.
How does Fort Jackson impact Columbia's demographic footprint?
Fort Jackson introduces tens of thousands of basic trainees and personnel to Richland County annually. Beyond temporary military populations, it employs thousands of permanent active-duty personnel and civilian contractors. It also creates a steady pipeline of military retirees who choose to settle permanently in the Midlands.
Which county in the Columbia metro area is growing the fastest?
Lexington County experiences the highest annual percentage growth rate in the metro area. Its rapid expansion is driven by suburban family housing developments, high-performing public school districts, and retail expansion along major transportation corridors.
Practical Recommendations for Decision-Makers
For Real Estate Investors and Homebuyers
- Focus on Key Infrastructure Corridors: Evaluate properties along transportation corridors benefiting from SCDOT improvements (such as the I-26/I-20 Carolina Crossroads project) to anticipate long-term access gains.
- Assess School District Maps: Families prioritizing long-term property values should monitor school district boundaries in fast-growing Lexington County District One and Richland County District Two.
- Target Infill Corridors: Investors looking for rental demand should target transit-accessible properties near the BullStreet District, USC Health Sciences campus, and West Columbia riverfront redevelopments.
For Business Leaders and Site Selectors
- Leverage the Regional Workforce Pipeline: Tap into the annual graduate pool produced by the University of South Carolina, Midlands Technical College, and exiting military personnel from Fort Jackson.
- Evaluate Transport Infrastructure: Plan logistics and warehousing operations around the Interstate 77 and Interstate 26 corridors to take advantage of central access to Charlotte, Charleston, and Atlanta ports.