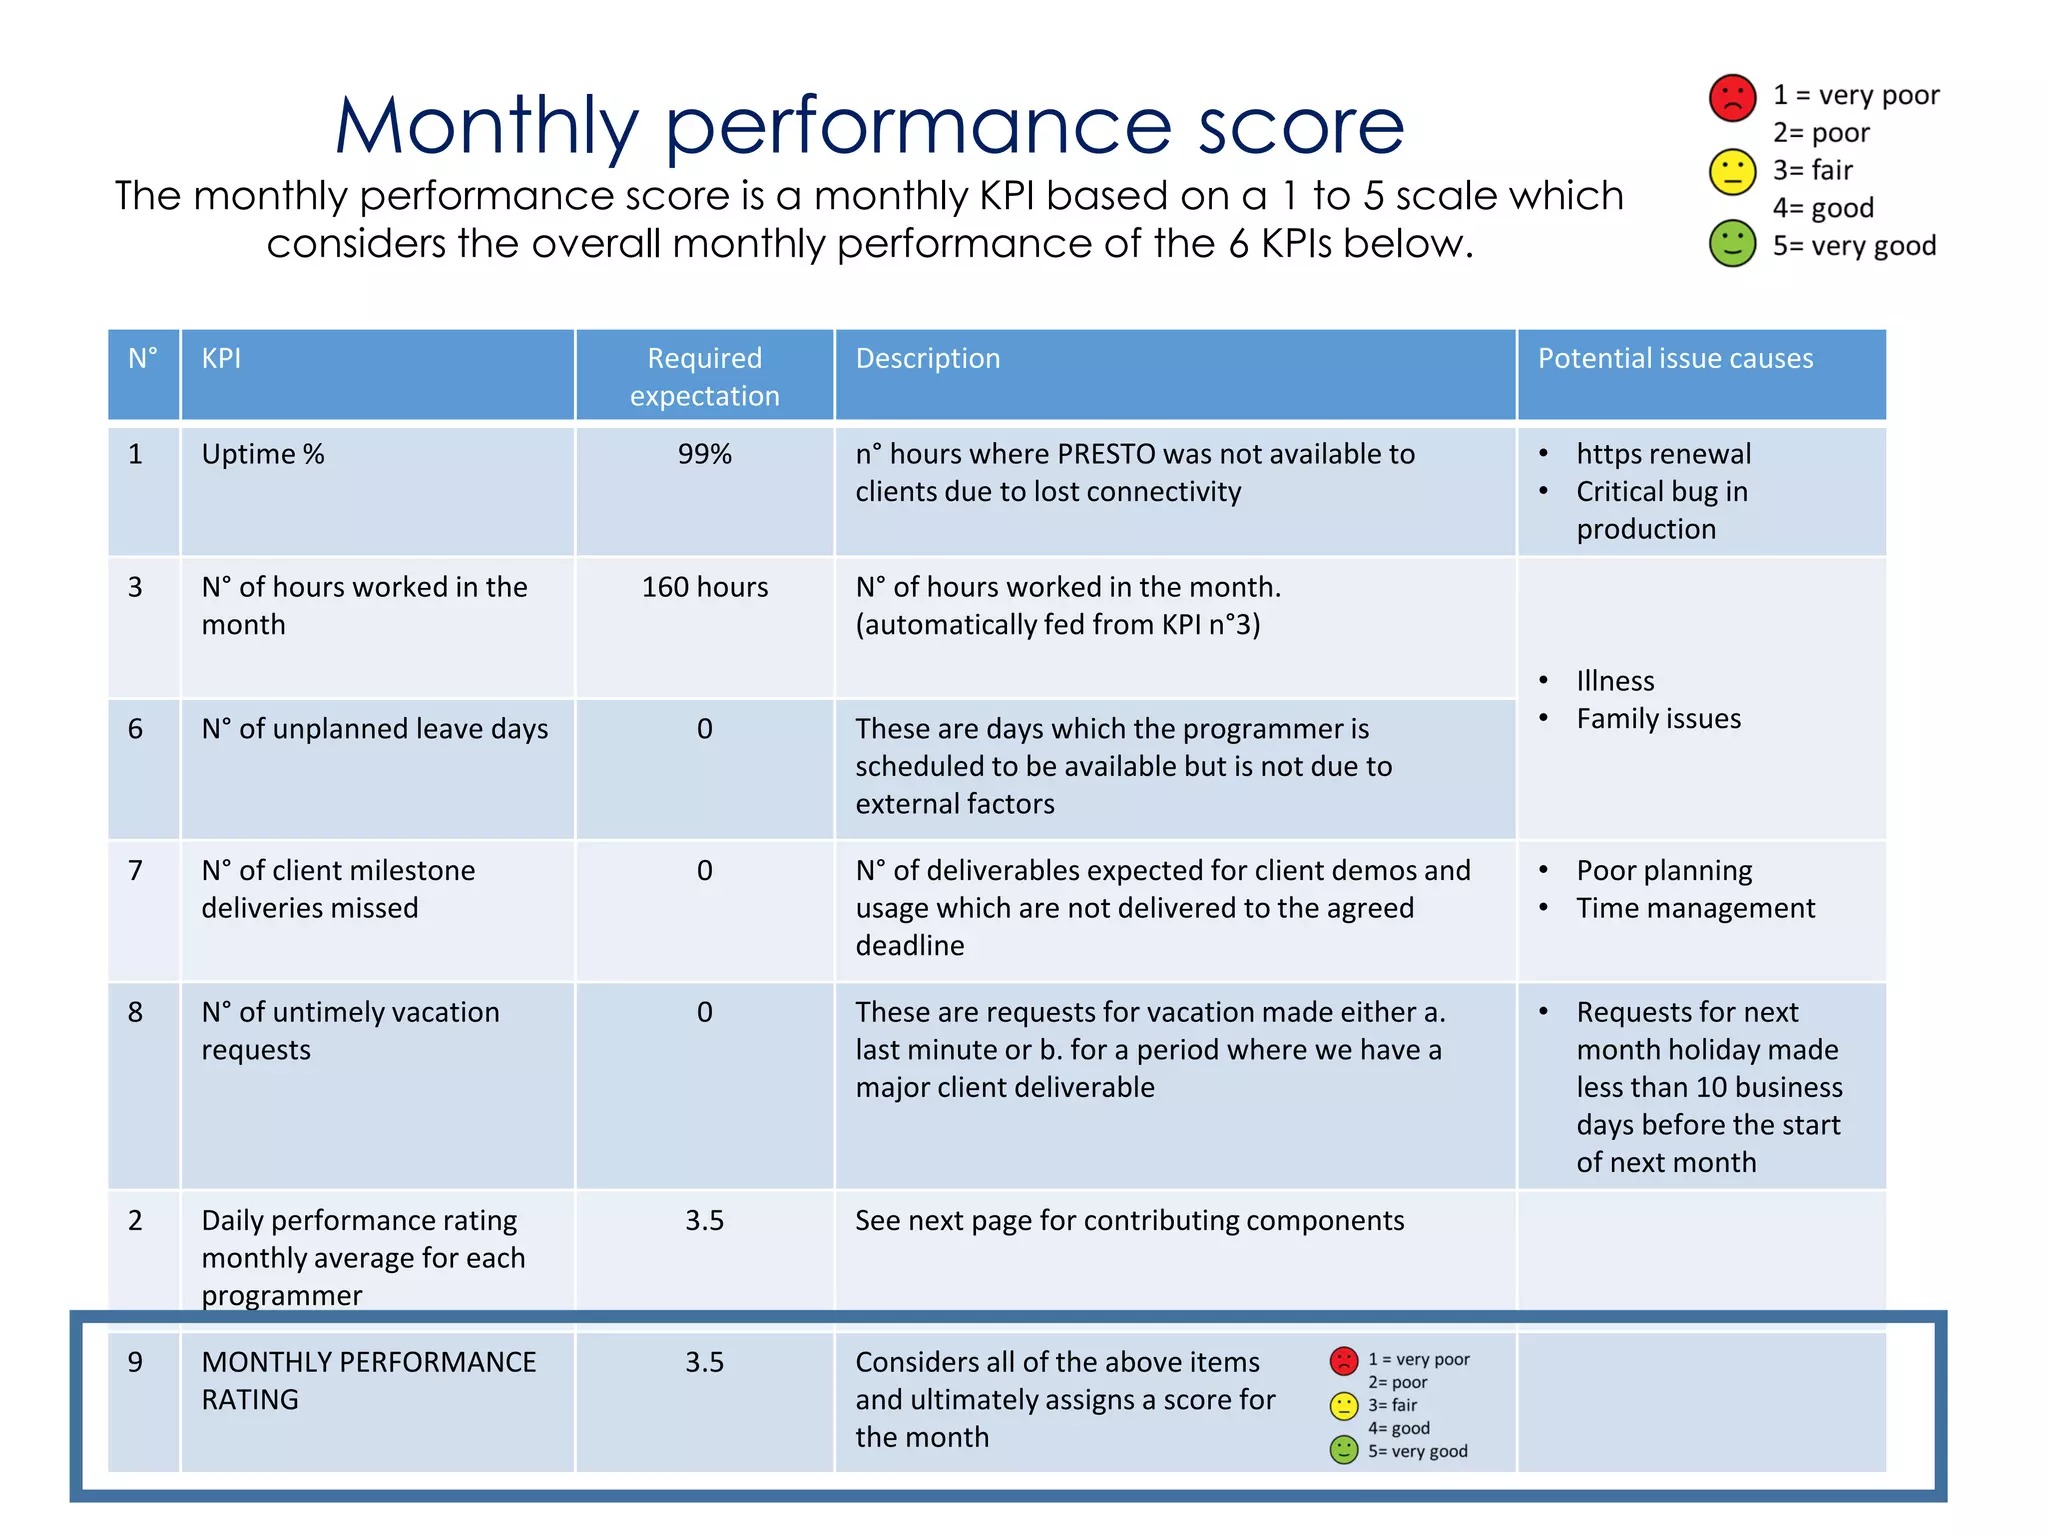
A practical monthly management report provides a standardized framework to track key performance indicators, assess operational health, and identify variances against financial budgets. By consolidating metrics into a concise, actionable format, management teams can bridge the gap between daily operations and long-term organizational goals through timely, data-driven decision-making.
The Purpose of a Monthly Management Report
The fundamental purpose of a monthly management report is to translate raw business data into a narrative that explains the "why" behind the numbers. Unlike a static financial statement, a management report acts as a bridge between the accounting department and the leadership team. It is intended for department heads, C-suite executives, and operational managers who need to know if the organization is hitting its targets and, if not, what factors are causing the deviation.
A well-structured report creates accountability. When stakeholders see a consistent format every 30 days, they become adept at identifying trends. Instead of spending hours discussing whether the data is accurate, meetings transition toward strategy: addressing supply chain bottlenecks, reallocating marketing spend, or scaling production based on actual demand. In 2026, where data velocity is higher than ever, the report’s value lies in its ability to filter "noise" and highlight only the information that requires immediate managerial intervention.
Essential Components of an Effective Report
To be practical, a report must balance breadth with brevity. It should not be a data dump; it should be a distilled reflection of organizational health.
1. Executive Summary and High-Level KPIs
The first page should answer the most critical questions: Are we on track? The executive summary should contain a short paragraph outlining the monthly performance, followed by a table of 5–8 high-level Key Performance Indicators (KPIs). Examples include Monthly Recurring Revenue (MRR), Customer Acquisition Cost (CAC), Net Profit Margin, and Employee Utilization Rates.
2. Financial Performance Analysis
This section compares actual results against the budget and the previous month’s figures. Focus on the P&L (Profit and Loss) statement, but highlight variances specifically. If revenue was 10% lower than projected, provide a brief bulleted list explaining the external or internal drivers behind that shortfall.
3. Operational and Departmental Metrics
This is the "engine room" of the report. Depending on the industry, this may include production output, service desk resolution times, or inventory turnover ratios. Break this down by department so that managers have a clear view of their specific domain’s health.
4. Variance Analysis and Corrective Actions
This is the most critical section for "practical" reporting. For every major variance—positive or negative—there must be a corresponding explanation. If a department exceeded its budget, identify whether this was a one-time spike or a systemic issue that requires a policy change.
5. Forward-Looking Projections
A management report should not merely look backward. Include a section on the forecast for the upcoming 30, 60, and 90 days. If the current month’s data indicates a looming cash flow issue or a surge in demand, this is where that insight belongs.
Comparison of Management Report Structures
Organizations often struggle with choosing the right level of granularity. The table below outlines how different departments typically prioritize their reporting focus.
| Department | Primary Metric Category | Typical Frequency | Key Reporting Focus |
|---|---|---|---|
| Finance | Cash Flow & Profitability | Monthly | Budget vs. Actual (BvA) |
| Sales | Pipeline & Conversion | Monthly | Lead volume and win rates |
| Operations | Efficiency & Throughput | Weekly/Monthly | Capacity utilization |
| HR | Retention & Headcount | Monthly | Turnover rates and cost-to-hire |
Developing Your Reporting Workflow
Creating a monthly report should be an automated, repeatable process rather than a manual labor-intensive task. Relying on manual spreadsheet entry creates room for human error and delays the distribution of the report, often making the data obsolete by the time it reaches the decision-makers.
Step 1: Define Your Data Sources
Identify where your "source of truth" resides. For financial data, this is typically your ERP or accounting software. For operational data, it might be your CRM (Customer Relationship Management) or project management tool. Ensure that these systems are updated consistently by the end of the calendar month to avoid reconciliation delays.
Step 2: Establish a Standardization Template
Standardization is the key to clarity. Use a template—whether in a business intelligence tool or a controlled spreadsheet—that uses the same layout every single month. By keeping the structure consistent, you allow readers to skim the document and find the metrics they need immediately without re-learning the format.
Step 3: Set the Calendar
Management reports are useless if they arrive too late. Establish a firm deadline, such as the 5th business day of the following month. This provides sufficient time for the finance team to close the books while ensuring that the data is fresh enough to inform the next month’s operational adjustments.
Step 4: The Review and Sign-Off
Before distribution, the report should be reviewed by a lead analyst or CFO. This peer review helps identify any "outlier" data points that might suggest a reporting error rather than a genuine business performance trend.
Common Mistakes to Avoid
The most common failure in management reporting is providing too much data with too little context. When a report exceeds 20 pages of charts, the human brain begins to disengage. Leaders end up ignoring the report entirely because it requires too much effort to synthesize.
Another significant error is the lack of "So What?" analysis. Providing a chart showing that sales dropped by 15% is informative, but it is not a management report. A proper management report tells the reader: "Sales dropped 15% due to a seasonal supply chain delay in our secondary manufacturing facility; we have already rerouted the shipping lane and expect recovery by the 15th of next month."
Finally, avoid the "vanity metric" trap. Do not fill your report with metrics that look good but do not influence business outcomes. If a metric does not trigger a decision, it does not belong in the monthly management report.
Utilizing Technology for Reporting
In 2026, the reliance on static PDFs is waning in favor of interactive dashboards. Business Intelligence (BI) platforms allow managers to drill down into the data. While a PDF summary is still useful for high-level distribution, embedding links to live, read-only dashboards enables stakeholders to investigate specific variances without needing to email the reporting analyst for more details.
Ensure that your reporting software complies with your organization’s data security protocols. When dealing with sensitive financial or personnel data, access should be strictly role-based. Only those who need to see specific line items should have the permissions to drill into the raw data.
Frequently Asked Questions
How long should a monthly management report be? Ideally, it should be no longer than 5 to 10 pages. If it is longer, the supporting data should be moved to an appendix, leaving the main body of the report for high-level summaries and actionable insights.
What is the difference between a financial statement and a management report? Financial statements are for external stakeholders and must follow strict accounting standards (like GAAP or IFRS). Management reports are internal tools designed to help you run the business; they can be formatted however you find most useful.
Should every department contribute to the report? Yes, but the scope should be limited to the metrics they control. Each department head should own their section of the report, ensuring they are held accountable for the data representing their team’s performance.
How do I handle "bad news" in a report? Transparency is vital. If there is a major issue, state it clearly in the executive summary. Follow the statement with a clear, time-bound plan to rectify the issue. Leadership is more likely to trust a report that identifies a problem early than one that attempts to bury it.
What is the best way to visualize trends? Use line charts for time-based data (e.g., revenue over the last 12 months) and bar charts for categorical comparisons (e.g., performance of different product lines). Avoid complex 3D charts or overly cluttered visuals that obscure the trend.
Next Steps for Improving Your Reporting
To implement a better reporting structure starting next month, audit your current process by asking the stakeholders who receive the report which sections they actually read. Remove anything that hasn't prompted a conversation in the last three months. Replace those sections with insights regarding future risks or opportunities.
Begin by drafting a "Performance Narrative" rather than just a set of charts. Start with the "Bottom Line" (the result), then explain the "Drivers" (what caused the result), and finish with the "Next Steps" (what you are going to do about it). This simple framework will transform your management reports from a chore into a core strategic asset.