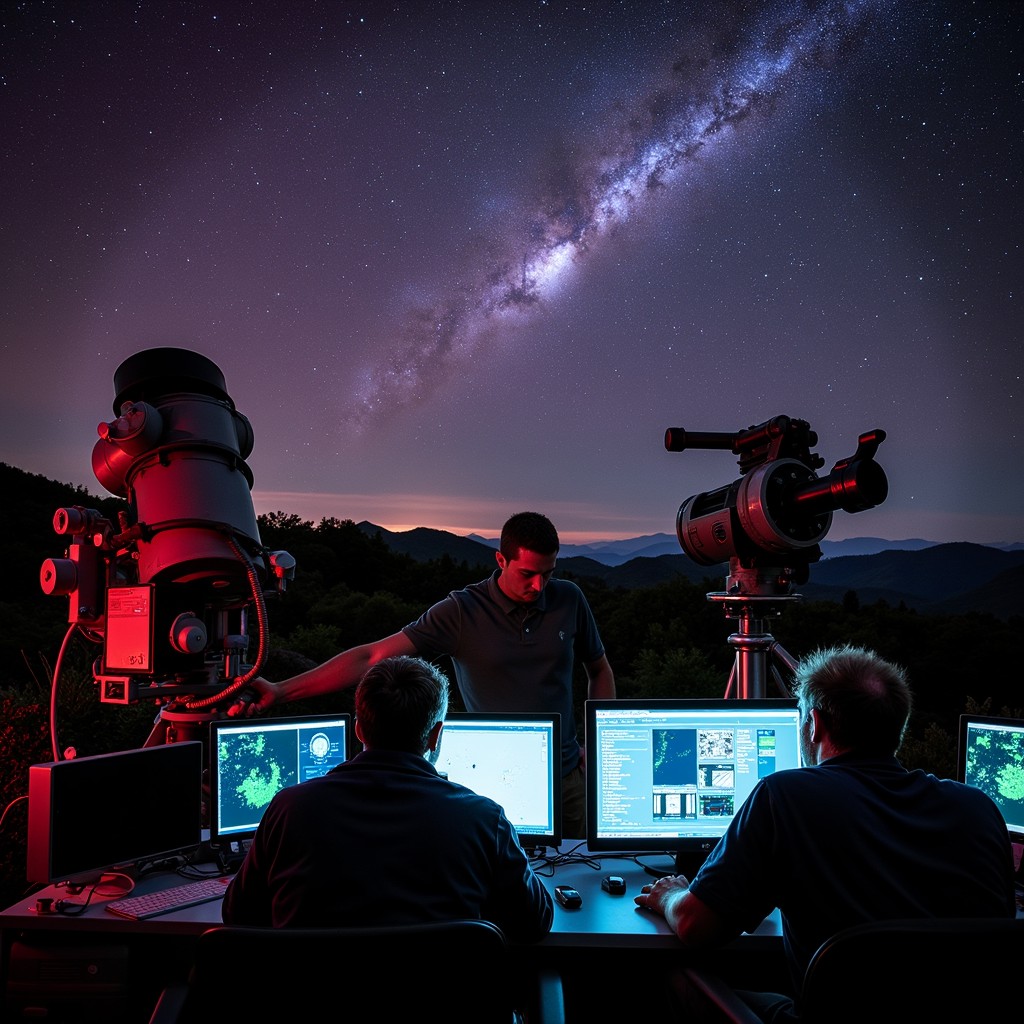
Astronomer videos showing the cosmos provide high-definition, data-driven visualizations of our universe, ranging from 3D galaxy maps to deep-space fly-throughs. These videos, often produced by agencies like NASA or the Space Telescope Science Institute (STScI), use actual telescope data to illustrate the scale, structure, and history of the known universe for educational and research purposes.
The Evolution of Cosmic Visualizations
The way astronomers depict the cosmos has undergone a radical transformation. In the mid-20th century, a "video" of the cosmos was often a simple slideshow of grainy black-and-white plates captured by terrestrial observatories. Today, in 2026, we have transitioned into an era of "cinematic science," where raw data from space-based observatories is processed into immersive, three-dimensional environments.
The primary driver behind this shift is the sheer volume of data. Modern telescopes do not just take "pictures"; they capture multi-spectral data points. When an astronomer video shows the cosmos now, it is often a rendering of millions of distinct coordinates. For example, the Gaia mission has mapped over a billion stars, allowing creators to generate fly-throughs where every point of light is positioned with mathematical precision. This transition from artistic impression to data-fidelity visualization allows viewers to experience the "Cosmic Web"—the large-scale structure of the universe—as it actually exists.
Iconic Astronomer Videos and Their Impact
Several key productions have defined how the public perceives the universe. Understanding these helps categorize the type of "cosmos video" one might be searching for.
The JWST Deep Field Fly-Throughs
Since the James Webb Space Telescope (JWST) began its mission, the Space Telescope Science Institute has released several "fly-through" videos. These videos begin with a wide-angle view of the night sky and zoom progressively deeper into a tiny patch of space. As the camera "moves," viewers see thousands of galaxies of various shapes and ages. These videos are unique because they use redshift data to determine the distance of each galaxy, effectively turning a 2D image into a 3D journey through time.
The Millennium Simulation
Produced by the Max Planck Institute for Astrophysics, this is less of a "camera in space" and more of a "supercomputer in space." It shows the distribution of matter from the early universe to the present day. When watching this video, you aren't seeing stars; you are seeing the dark matter scaffolding that allows galaxies to form. It remains one of the most significant astronomer-led visualizations for understanding the "bones" of the cosmos.
The Sloan Digital Sky Survey (SDSS) 3D Maps
The SDSS has produced some of the most comprehensive videos of the large-scale structure of the universe. Their videos often depict the "Great Wall" of galaxies and the vast voids between them. These visualizations are essential for understanding that the universe is not a random soup of stars but a structured network.
The Technology Behind the Visuals
Creating a video that accurately shows the cosmos requires a fusion of astrophysics and advanced computer graphics. The process generally follows a specific pipeline to ensure that the scientific integrity of the data is maintained while making it visually comprehensible.
- Data Acquisition: Telescopes like the JWST, Hubble, and the Vera C. Rubin Observatory capture light in various wavelengths (infrared, visible, ultraviolet). This data arrives as "FITS" files—flexible image transport system files—which are essentially massive spreadsheets of radiation values.
- Astrophotometry and Redshift Analysis: Astronomers calculate the distance of objects using redshift (the stretching of light as an object moves away). This provides the "Z-axis" or depth needed for a 3D video.
- Point Cloud Generation: Software converts the 2D coordinates and the distance data into a 3D point cloud. In a video showing the cosmos, each "pixel" of a galaxy is a calculated point in space.
- Rendering and Lighting: Because most of the cosmos is invisible to the human eye (infrared or X-ray), astronomers use "representative color." For instance, they might assign blue to shorter wavelengths and red to longer ones. This isn't "fake"; it is a translation of data into the visible spectrum.
- Path Animation: Finally, a virtual camera is moved through this 3D data set. This is the "astronomer video" most people see on platforms like NASA’s Scientific Visualization Studio.
Key Sources for Authentic Cosmic Footage
If you are looking for high-quality, scientifically accurate videos of the cosmos in 2026, several official sources provide the most reliable content. These institutions prioritize data accuracy over purely aesthetic choices.
- NASA Scientific Visualization Studio (SVS): This is the gold standard for astronomer-led videos. They offer everything from solar dynamics to animations of black hole accretion disks.
- European Southern Observatory (ESO): Known for their "Zoom" videos, the ESO uses footage from the Very Large Telescope (VLT) and ALMA to show the transition from the Milky Way to deep-space nebulae.
- HubbleSite and WebbTelescope.org: These are the primary repositories for the two most famous space telescopes. Their video galleries include "tours" of iconic structures like the Pillars of Creation.
- ESA Sky: The European Space Agency provides interactive and video-based tools that allow users to toggle between different wavelengths of the entire sky.
Interpreting What You See: False Color and Scale
One of the most common points of confusion for viewers watching an astronomer video of the cosmos is the concept of "realism." It is important to distinguish between what the human eye would see and what the telescope "sees."
Representative Color (False Color)
Most professional cosmos videos use representative color. Since the JWST operates in the infrared, a "true color" video would be completely black to human eyes. Astronomers shift these infrared signals into the visible spectrum. When you see a glowing purple nebula, you are often looking at a specific gas, like ionized oxygen or hydrogen, which has been assigned that color to make it visible.
The Problem of Scale
The distances in the cosmos are so vast that a "realistic" speed for a video would be agonizingly slow. To make a video that shows the cosmos engaging, astronomers must compress time and space. A fly-through of a galaxy that takes 60 seconds would, in reality, require traveling at many trillions of times the speed of light. Good astronomer videos will often include a scale bar or a timestamp to help the viewer maintain context.
Comparison of Major Cosmic Visualization Projects
| Project Name | Primary Focus | Data Source | Best For |
|---|---|---|---|
| NASA SVS | General Astrophysics | Multiple (JWST, Chandra, Hubble) | Educational overviews & current news |
| Gaia Sky | The Milky Way Galaxy | ESA Gaia Mission | Understanding star positions & motions |
| WorldWide Telescope | Interactive Sky Map | Multi-institutional | Research and custom exploration |
| The Illustris Project | Cosmic Evolution | Supercomputer Simulation | Understanding galaxy formation |
| ESO Zooms | Deep Space Objects | VLT, ALMA, La Silla | Seeing scale from Earth to Space |
Challenges in Visualizing the "Invisible" Cosmos
The most difficult task for an astronomer creating a video of the cosmos is representing things that do not emit light. Dark matter and dark energy make up roughly 95% of the universe's content, yet they are invisible.
In modern visualizations, astronomers use "proxy data." For example, if they observe light from a distant galaxy being bent (gravitational lensing), they can calculate where a mass of dark matter must be. In a video, this is often represented as a ghostly blue or gray web. Without these visualizations, a video of the "cosmos" would only show the 5% that is "normal" matter, leaving out the most significant forces shaping the universe's structure.
Furthermore, black holes present a unique challenge. Since light cannot escape them, an astronomer video of a black hole must focus on the "event horizon" and the "accretion disk"—the swirling, glowing gas trapped in the black hole's gravity. The famous visualization from the Event Horizon Telescope (EHT) and subsequent high-definition animations are among the most technically complex videos ever produced in the field.
Frequently Asked Questions
Where can I find 4K or 8K videos of the cosmos for my home theater?
The best source for ultra-high-definition astronomer videos is the NASA Scientific Visualization Studio or the European Southern Observatory (ESO) Multimedia Gallery. They offer free downloads in various formats, including 4K and 8K, which are significantly higher quality than compressed YouTube versions.
Are these cosmos videos actual footage or just animations?
They are a hybrid. While they are "animations" in the sense that a camera didn't physically fly through a nebula, they are based on actual photon data captured by telescopes. Every star and galaxy is placed according to its measured coordinates in space. They are "data-driven visualizations" rather than artistic creations.
Why do some astronomer videos show galaxies as being different colors?
The colors usually represent different chemical elements or temperatures. For example, in many NASA videos, red might represent cold dust, while blue or white represents hot, young stars. This is called chromatic ordering, where the longest wavelengths are assigned to red and the shortest to blue.
How do astronomers know what the universe looks like from the "outside"?
We cannot actually go outside our galaxy or the universe. Videos that show the Milky Way from a distance are created using maps of our galaxy generated from within. By measuring the distance and velocity of stars (using tools like the Gaia satellite), astronomers can build a 3D model of our galaxy and then "place" a virtual camera outside of it.
What is the most accurate 3D map of the cosmos available to watch?
As of 2026, the Sloan Digital Sky Survey (SDSS) and the Dark Energy Spectroscopic Instrument (DESI) maps are considered the most accurate visualizations of the large-scale structure of the cosmos. These maps show the distribution of millions of galaxies across billions of light-years.
Practical Recommendation for Further Exploration
If you are looking to immerse yourself in the cosmos through the lens of an astronomer, start by visiting the NASA Scientific Visualization Studio. Unlike standard YouTube channels, the SVS provides detailed "Science Story" metadata for every video, explaining exactly which telescope was used, what the colors represent, and the scientific discovery the video illustrates. For those with a VR headset, searching for "NASA VR" or "ESA Gaia VR" offers an even more profound experience, allowing you to stand in the center of a data-driven model of our galaxy.