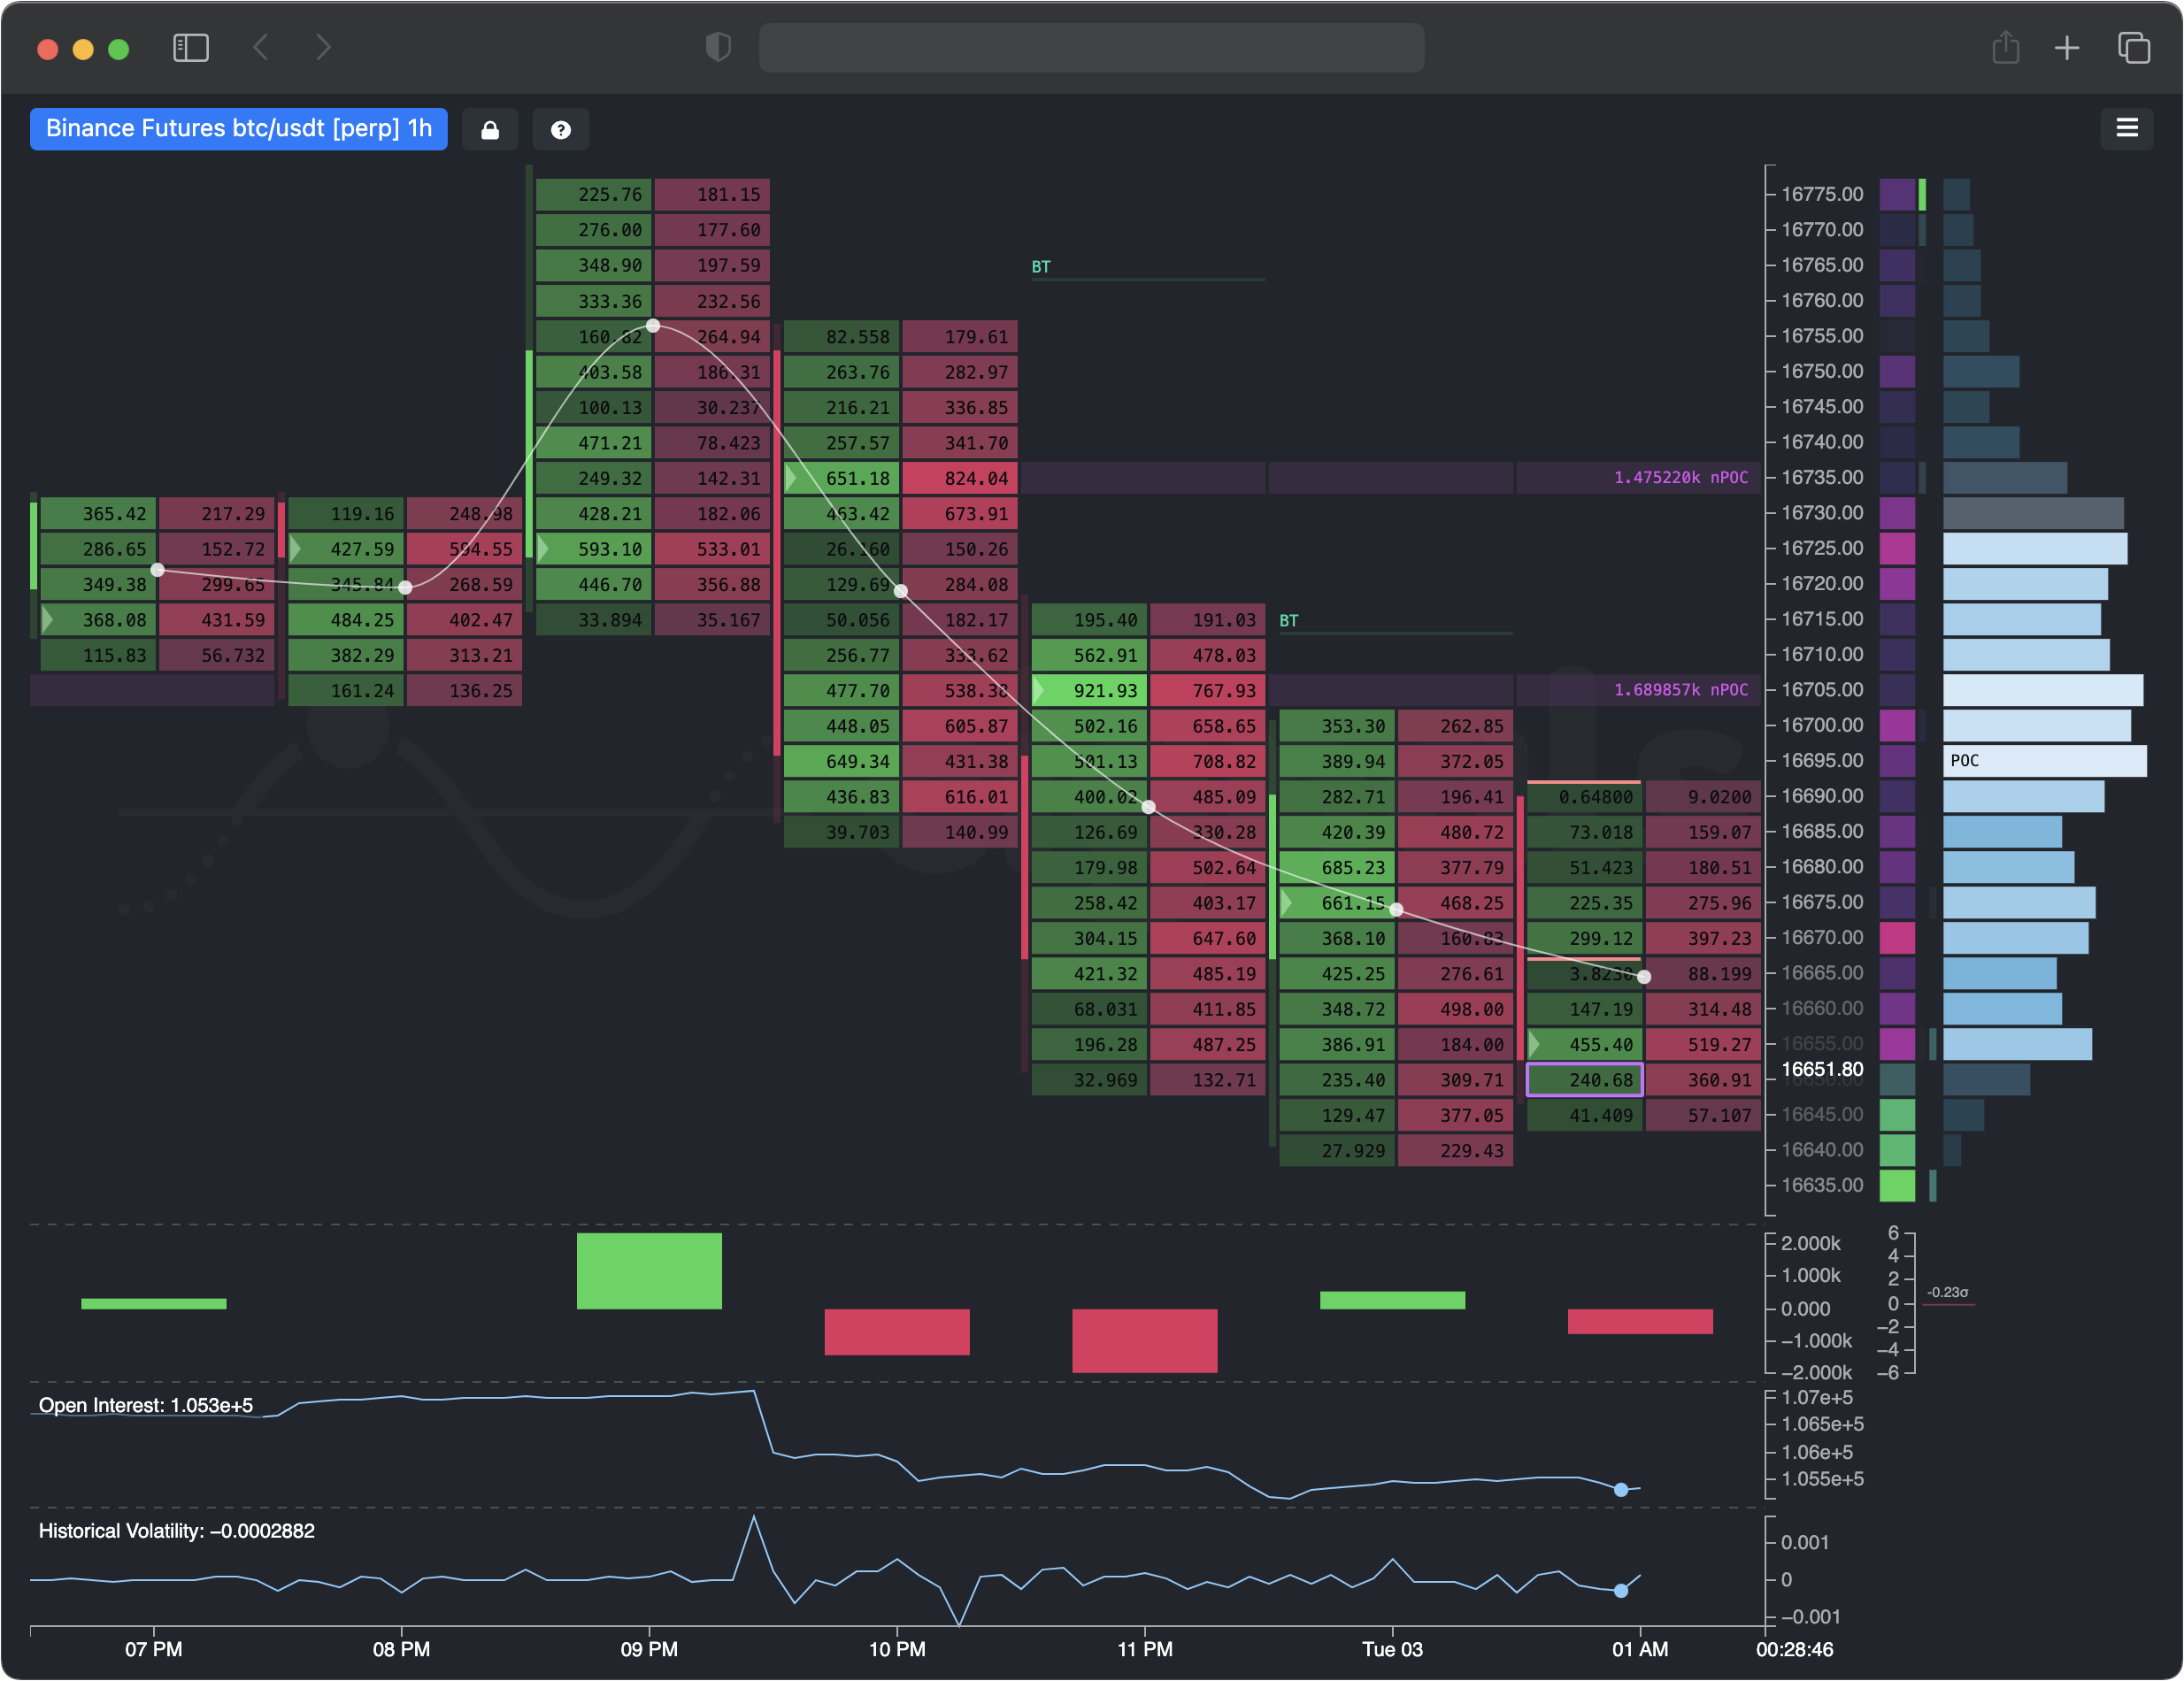
Professional Bitcoin chart reading involves synthesizing price action, volume profiling, and cross-market correlations to identify high-probability trade setups. By moving beyond basic candlestick patterns to analyze institutional liquidity, on-chain confluence, and multi-timeframe structures, traders can navigate the complex volatility of the 2026 crypto markets with greater precision and emotional discipline.
The transition from a retail observer to a professional analyst requires a fundamental shift in how one perceives data. In the current 2026 market environment, characterized by deep institutional liquidity and the dominance of Spot Bitcoin ETFs, simple "support and resistance" lines are often insufficient. Professional traders look for the "why" behind price movements, seeking to understand where large-scale buy and sell orders are clustered and how macroeconomic shifts influence Bitcoin’s intraday volatility. To master the art of chart reading, one must integrate technical indicators with the underlying mechanics of market auctions and liquidity hunting.
1. Master Multi-Timeframe Analysis (MTA)
The most common mistake among novice traders is focusing exclusively on a single timeframe, often the 15-minute or 1-hour chart. Professional Bitcoin analysts utilize Multi-Timeframe Analysis (MTA) to establish a "top-down" perspective. This process begins with the Monthly and Weekly charts to determine the primary trend, then drills down to the Daily and 4-hour charts for structural shifts, and finally uses the 1-hour or 15-minute charts for precise execution.
In 2026, Bitcoin's price action is heavily influenced by institutional rebalancing cycles. By looking at the Monthly chart, a trader can identify long-term supply and demand zones that have been relevant for years. When the Daily chart shows a bullish reversal pattern, it only carries "pro-level" weight if it aligns with a support level identified on a higher timeframe. This concept is known as confluence. If a 4-hour "Golden Cross" occurs at the same price level as a Weekly "Order Block," the probability of a successful trade increases exponentially.
Furthermore, MTA helps filter out "market noise." Intraday volatility can create "fakeouts"—price movements that look like breakouts but quickly reverse. By keeping an eye on the higher timeframe, a professional can see that a 15-minute price spike was merely a retest of a Daily resistance level, preventing them from "FOMO-ing" (Fear Of Missing Out) into a losing position.
2. Utilize Volume Profile Visible Range (VPVR)
Traditional volume bars at the bottom of a chart show when trading occurred, but they do not show at what price the most activity took place. Professional Bitcoin traders prioritize the Volume Profile Visible Range (VPVR). This tool plots a histogram on the Y-axis, showing the amount of volume traded at specific price levels over a selected period.
The most critical component of the VPVR is the Point of Control (POC), which is the price level with the highest traded volume. In 2026, the POC often acts as a massive magnet for price. If Bitcoin is trading significantly above its POC, the market is considered "overextended," and a reversion to the mean is likely. Conversely, price levels with very low volume, known as Low Volume Nodes (LVN), act as "gaps" where the price tends to move very quickly because there is little historical resistance or support to slow it down.
Pros use VPVR to identify "Value Areas"—the price range where 70% of the volume occurred. When Bitcoin breaks out of a Value Area, it signifies a transition from a balanced market to an imbalanced one, often leading to a sustained trend. Understanding these "high-rent" and "low-rent" districts on the chart allows a trader to set profit targets and stop losses based on where actual money has been spent, rather than arbitrary percentages.
3. Identify Institutional Liquidity and Order Blocks
In a mature market like Bitcoin in 2026, price movement is often a search for liquidity. Institutions and large-scale "whales" cannot enter or exit positions all at once without moving the market against themselves. Therefore, they look for areas where there is a high concentration of retail stop-loss orders to fill their large orders.
Professional chart readers look for Order Blocks, which are specific candles where institutional participants previously entered the market. An "unmitigated" order block is a price zone that hasn't been revisited since a massive move began. When price eventually returns to this zone, it often finds significant support or resistance as institutions "defend" their positions or finish filling their orders.
Reading a chart like a pro means anticipating where the "liquidity grab" will happen. Often, Bitcoin will briefly dip below a clear support level—triggering thousands of retail sell-stops—only to immediately reverse and head higher. This is known as a Stop Run or "SFP" (Swing Failure Pattern). A professional doesn't panic during these moves; they recognize them as the necessary fuel for the next leg of the trend.
4. Decode Fibonacci Extensions for Price Discovery
When Bitcoin enters "Price Discovery"—meaning it has broken its previous All-Time High and there is no historical resistance above it—traditional horizontal levels become useless. This is where professional traders turn to Fibonacci Extensions.
While many retail traders use Fibonacci Retracements (like the 0.618 "Golden Pocket") to find entries, pros use Extensions (1.618, 2.618, and 4.236) to project where a rally might exhaust itself. These levels are not magic; they are psychological self-fulfilling prophecies. Because so many high-frequency trading (HFT) algorithms and institutional desks use these mathematical ratios to take profits, the market naturally tends to stall or reverse at these points.
In 2026, the 1.618 Extension of a previous major market cycle remains one of the most watched levels by global analysts. By measuring the distance from a cycle low to a cycle high and projecting it outward, traders can identify potential "climax" zones months in advance. Combining these Fibonacci levels with oscillators like the Relative Strength Index (RSI) to look for "bearish divergence" creates a powerful framework for exiting a bull market before the crash.
5. Monitor the Ichimoku Cloud (Kumo)
The Ichimoku Kumo Cloud is a comprehensive technical indicator that provides a "one-look" assessment of trend, momentum, and support/resistance. While it looks intimidatingly complex at first, professional traders value it because it accounts for the time element of price action, not just the price itself.
The "Cloud" (the Kumo) represents a zone of support or resistance. If Bitcoin's price is above the Cloud, the trend is bullish; below it, the trend is bearish. However, the "pro" way to read this chart is to look at the thickness of the Cloud. A thick Cloud indicates strong support/resistance that will be difficult to break. A thin Cloud, or a "Kumo Twist," suggests a point of weakness where the trend is likely to flip.
Another pro-tip within the Ichimoku system is the Chikou Span (the lagging line). Professionals use this to confirm a trend change. If the price breaks above the Cloud, but the Chikou Span is still stuck behind historical price action, the breakout is considered "unconfirmed." Only when all elements of the Ichimoku system align does a professional commit significant capital to a trade.
6. Analyze Cross-Market Correlations (DXY and TradFi)
In 2026, Bitcoin does not trade in a vacuum. It is a core component of the global financial system. To read a Bitcoin chart like a pro, you must simultaneously watch the U.S. Dollar Index (DXY) and major equity indices like the S&P 500.
Historically, Bitcoin has maintained a strong inverse correlation with the DXY. When the Dollar is strong, Bitcoin tends to struggle; when the Dollar weakens, Bitcoin thrives. A professional chart reader will often have the DXY chart open next to the BTC/USD chart. If Bitcoin is approaching a resistance level and the DXY is simultaneously bouncing off a major support level, the probability of Bitcoin breaking through that resistance is low.
Additionally, the integration of Bitcoin into the traditional finance (TradFi) world via ETFs means that Bitcoin often follows the "risk-on" or "risk-off" sentiment of the stock market. If the Nasdaq is sold off aggressively during New York trading hours, a pro-analyst will look for Bitcoin to follow suit, regardless of what the "crypto-specific" indicators are saying. Understanding these macro-linkages is what separates a specialized crypto trader from a global macro professional.
7. Integrate On-Chain Confluence
The final "pro" layer to chart reading is the inclusion of on-chain data. Because Bitcoin exists on a transparent public ledger, we can see exactly how much BTC is moving onto or off of exchanges. While traditional charts show price movements, on-chain data shows the intent of market participants.
For example, if Bitcoin's price is rising into a resistance zone, but the "Exchange Inflow" metric shows that thousands of BTC are being moved onto Binance and Coinbase, a professional knows that a sell-off is likely imminent. Conversely, if price is crashing but the "Exchange Outflow" is hitting record highs, it indicates that "smart money" is buying the dip and moving their assets into cold storage.
Key on-chain metrics for chart confluence in 2026 include:
- MVRV Z-Score: Indicates when Bitcoin is overvalued or undervalued relative to its "realized" price.
- Hash Rate Trends: Ensures the network security is growing alongside the price.
- Stablecoin Supply Ratio (SSR): Measures the "buying power" currently sitting on the sidelines in the form of USDT or USDC.
| Indicator/Method | Level | Primary Use Case | Pro Tip |
|---|---|---|---|
| MTA (Multi-Timeframe) | Macro/Micro | Trend confirmation | Never trade against the Weekly trend. |
| VPVR (Volume Profile) | Structural | Finding "real" support/resistance | Focus on the Point of Control (POC). |
| Order Blocks | Institutional | Entry/Exit zones | Look for "unmitigated" blocks. |
| Fibonacci Extensions | Predictive | Price discovery targets | Use the 1.618 for major cycle peaks. |
| Ichimoku Cloud | Momentum | Trend health assessment | Watch for "Kumo Twists" for reversals. |
| DXY Correlation | Macro | Global sentiment | BTC usually moves inverse to the USD. |
| On-Chain Metrics | Fundamental | Market sentiment/Liquidity | Watch Exchange Inflows during rallies. |
Frequently Asked Questions
What is the most reliable timeframe for reading Bitcoin charts?
The Daily (1D) timeframe is generally considered the most reliable for identifying significant trend changes. While day traders use shorter timeframes like the 5-minute or 15-minute for entries, these are prone to extreme noise and manipulation. Professional swing traders rely on the 4-hour (4H) and Daily charts to filter out volatility and focus on the "market structure" created by institutional participants.
Should I use "Logarithmic" or "Linear" scales for Bitcoin?
For long-term analysis (years), the Logarithmic scale is essential. Because Bitcoin’s price has grown by orders of magnitude, a linear scale makes early price movements look like a flat line. However, for intraday or short-term trading (weeks or days), the Linear scale is often more accurate for identifying precise horizontal support and resistance levels that other traders are watching.
Can technical analysis predict Bitcoin's price 100% of the time?
No. Technical analysis is a tool for probability management, not a crystal ball. Even the most perfect "pro" setup can be invalidated by "Black Swan" events, regulatory shifts, or sudden macroeconomic shocks. Professional traders use chart reading to find setups where the potential reward significantly outweighs the risk, and they always use stop-losses to protect their capital when a chart "fails" to play out as expected.
Is the RSI (Relative Strength Index) still relevant for Bitcoin in 2026?
Yes, but pros use it differently. Instead of just looking for "overbought" (above 70) or "oversold" (below 30) levels—which Bitcoin can stay in for weeks during a strong trend—pros look for RSI Divergence. If the price makes a higher high but the RSI makes a lower high, it is a "bearish divergence" and a strong signal that the trend is losing steam and a reversal is coming.
What are "Liquidations" and why do they appear on pro charts?
Liquidation maps show price levels where high-leverage traders will be forced to close their positions. In 2026, Bitcoin often "hunts" these clusters of liquidity. If there is a massive cluster of "Short Liquidations" just above the current price, the market will often spike up to hit those levels (triggering forced buying) before reversing. Professional traders use heatmap tools to avoid getting "hunted" themselves.
Next Actions for Aspiring Pro Analysts
To begin implementing these professional strategies, start by cleaning your charts of "clutter." Remove excessive indicators and focus first on Market Structure (Higher Highs and Higher Lows) on the Daily timeframe. Incorporate the VPVR to see where the real volume lies, and begin cross-referencing your findings with the DXY to ensure you aren't trading against a macro-trend. Finally, always validate your technical setups with on-chain data to ensure that "smart money" is moving in the same direction as your trade. Consistency in this multi-layered approach is what ultimately builds a professional edge in the Bitcoin market.
Professional Advice Limitation: This article is for informational and educational purposes only and does not constitute financial, investment, or legal advice. Cryptocurrency markets are highly volatile and involve significant risk. Always conduct your own research and consult with a licensed financial advisor before making any investment decisions.