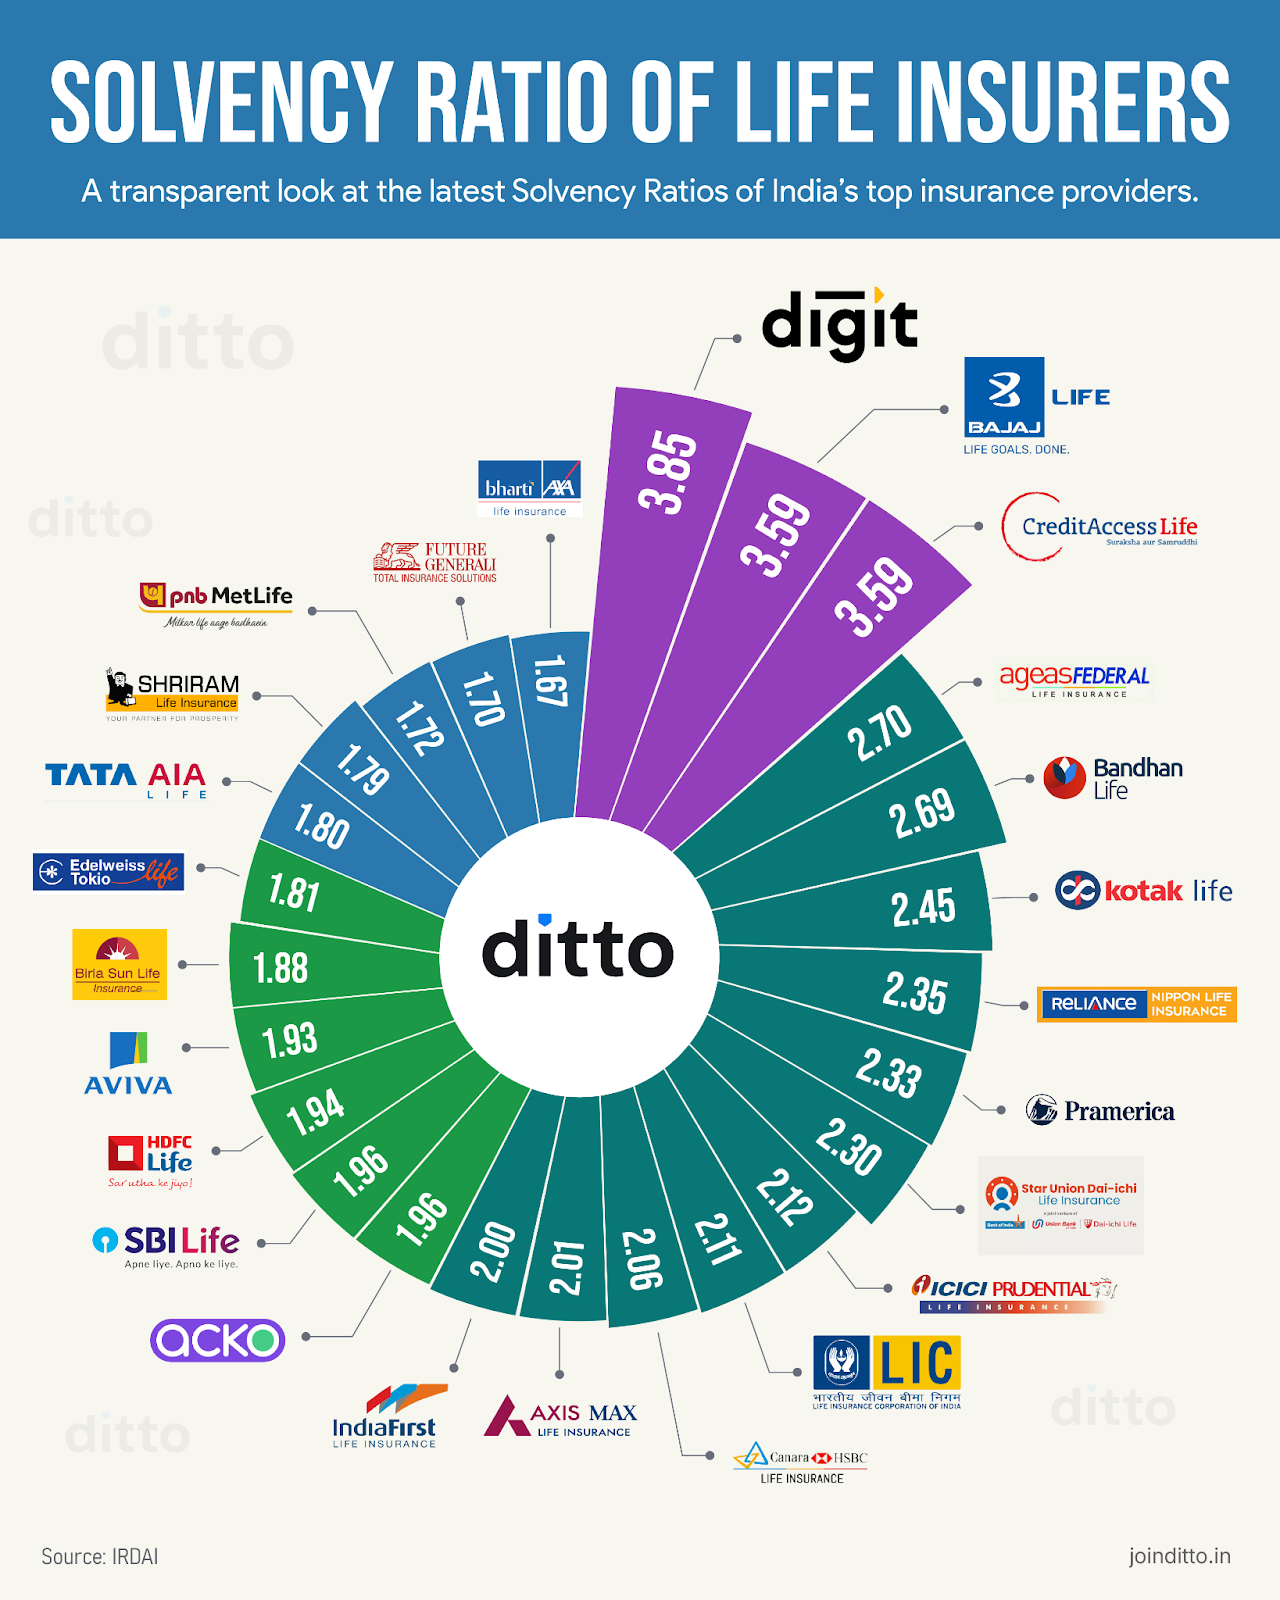
The Solvency I ratio is a fundamental metric used to assess the capital adequacy of insurance companies by comparing their available capital against a required minimum based on premium volume or claims history. While largely superseded by Solvency II in the European Union, it remains a critical benchmark for historical trend analysis, regulatory frameworks in emerging markets, and simplified capital assessment for legacy portfolios.
In the financial landscape of 2026, it is easy to dismiss older regulatory frameworks as relics of a bygone era. However, the Solvency I ratio—once the gold standard for insurance regulation across Europe—continues to exert a significant influence on how we understand risk, capital management, and the evolution of financial stability. Even a decade after the full implementation of its successor, Solvency II, the "Solvency I mindset" provides essential context for analysts, regulators in developing jurisdictions, and legal experts managing long-tail insurance liabilities.
Understanding the Solvency I ratio is not merely an exercise in financial archaeology. It is a necessary component of comprehensive risk management. By looking at why this ratio still matters, we gain insights into the strengths and weaknesses of volume-based capital requirements versus the more modern, complex risk-based approaches.
Understanding the Foundation: What was Solvency I?
To appreciate why the ratio matters in 2026, one must first understand its mechanics. Established through a series of European Directives starting in the 1970s (most notably 73/239/EEC for non-life and 79/267/EEC for life insurance), Solvency I was designed to ensure that insurance undertakings had a "cushion" of capital to absorb unexpected losses.
The Solvency I ratio was calculated using a relatively straightforward formula:
Solvency I Ratio = (Available Solvency Margin / Required Solvency Margin) × 100
The Available Solvency Margin (ASM) consisted of the company’s equity, reserves, and certain subordinated debt. The Required Solvency Margin (RSM) was the minimum amount of capital the regulator demanded. Crucially, the RSM was "volume-based." For non-life insurers, it was typically the higher of two calculations: one based on annual premiums and another based on average claims over the previous three years. For life insurers, it was generally a percentage of mathematical provisions plus a percentage of the capital at risk.
This simplicity is precisely why the ratio remains a point of reference today. Unlike modern frameworks that rely on complex stochastic modeling, Solvency I was transparent and difficult to manipulate through internal model "optimization."
1. Historical Benchmarking and Longitudinal Data Analysis
The primary reason the Solvency I ratio remains relevant for financial analysts in 2026 is its role in longitudinal data analysis. Insurance is a long-term business; life insurance contracts and certain liability policies can span 30, 40, or even 50 years.
When analysts evaluate the performance of a multi-decade insurance group, they cannot simply switch their data models at the 2016 mark (when Solvency II was implemented) without losing valuable context. The Solvency I ratio provides a consistent baseline for how capital levels responded to historical crises, such as the 2008 financial crash or the early 2000s dot-com bubble.
By back-testing modern portfolios against Solvency I standards, analysts can identify "capital drift." If a company appears well-capitalized under modern risk-based models but would have failed a Solvency I test, it suggests that the company’s safety margin is heavily dependent on the assumptions within its internal models—assumptions that may or may not hold true in a systemic tail-risk event.
2. Global Regulatory Influence and Emerging Markets
While the European Union and the United Kingdom have moved toward risk-based capital (RBC) regimes like Solvency II and the "Solvency UK" reforms, a significant portion of the global insurance market still operates on principles derived from Solvency I.
Many jurisdictions in the Middle East, Africa, and parts of Asia use "Solvency I-style" frameworks because they are easier to implement and supervise. For an insurance regulator in a developing economy, a volume-based approach is often more effective than a risk-based approach because:
- Data Requirements: It requires less granular data from insurers.
- Supervisory Capacity: It is easier for regulatory staff to audit a premium-based calculation than a complex Monte Carlo simulation.
- Predictability: It offers more predictable capital requirements for new market entrants.
For international insurance conglomerates operating in these regions, the Solvency I ratio is not a historical memory but a current reporting requirement. In 2026, understanding the nuances of this ratio is essential for managing capital across a global footprint where regulatory standards are not uniform.
3. The "Simplicity Check" Against Model Risk
One of the criticisms of modern financial regulation is "model risk"—the danger that the mathematical models used to calculate capital are fundamentally flawed or based on "garbage in, garbage out" data. Solvency II is highly sensitive to market fluctuations; if interest rates shift or equity markets dip, capital requirements can swing wildly.
The Solvency I ratio, being volume-based, is much more stable. In 2026, many risk officers use Solvency I-style calculations as a "sanity check." If the sophisticated internal models say the company is safe, but the simple Solvency I ratio shows a declining cushion relative to premium growth, it serves as an early warning signal.
This "back-to-basics" approach helps prevent the over-leveraging of balance sheets. A company that grows its premium income by 50% but keeps its capital static might look fine under a risk-based model if it claims the new business is "low risk." Under Solvency I, that company would immediately see its solvency ratio drop, forcing a conversation about whether the capital base is truly sufficient to support the increased scale of operations.
4. Management of Legacy Portfolios and Run-Off Business
In the insurance world, a "run-off" occurs when a company stops writing new business but continues to manage and pay out claims on existing policies. In 2026, there are billions of dollars in liabilities sitting in "closed books" or run-off entities that were originally priced and capitalized under Solvency I rules.
When these portfolios are sold or transferred between companies—a common occurrence in the current "capital-light" trend of major insurers—the historical Solvency I data is critical for the due diligence process. Buyers need to understand the capital trajectory of the portfolio since its inception.
Furthermore, legal disputes regarding the "reasonable expectations" of policyholders often hinge on the regulatory environment that existed when the policy was sold. If a life insurance policy from 1995 is the subject of litigation regarding its bonus structure or surrender value, the Solvency I capital requirements of that era become a material fact in explaining the insurer's management of the underlying funds.
5. Educational and Conceptual Clarity
Finally, the Solvency I ratio matters because it is the most effective way to teach the core concepts of insurance prudential supervision. Before a student or a junior analyst can grasp the complexities of "Pillar 1, 2, and 3" of modern regulation, they must understand the fundamental relationship between an insurer's obligations (liabilities) and its ability to pay (capital).
Solvency I strips away the noise of market volatility, credit spreads, and operational risk factors to focus on the two most visible drivers of insurance risk: how much business is being written (premiums) and how much is being paid out (claims). By mastering the Solvency I ratio, professionals build a conceptual foundation that allows them to better critique and improve modern risk-based systems.
Comparison: Solvency I vs. Solvency II (The 2026 Perspective)
The following table highlights the material differences between the legacy Solvency I approach and the modern standards that followed, illustrating why the older ratio remains a useful "crude" instrument.
| Feature | Solvency I (Legacy/Global) | Solvency II (Modern Standard) |
|---|---|---|
| Primary Basis | Volume-based (Premiums/Claims) | Risk-based (Market, Credit, Op Risk) |
| Calculation Logic | Deterministic (Fixed percentages) | Stochastic (Probability of ruin) |
| Risk Sensitivity | Low (Does not vary by asset quality) | High (Varies by specific asset risk) |
| Diversification | Not recognized | Highly incentivized |
| Structure | Single-pillar (Capital only) | Three-pillar (Capital, Governance, Disclosure) |
| Transparency | High (Calculations are simple) | Moderate (Internal models are "black boxes") |
| Primary Goal | Minimum policyholder protection | Comprehensive risk-adjusted capital |
Detailed Breakdown of the Required Solvency Margin (RSM)
To fully understand the weight of the Solvency I ratio, one must examine the specific mechanics of the Required Solvency Margin. In the 2026 context, these formulas are still used for comparative stress testing.
For Non-Life Insurers
The RSM was calculated as the higher of the Premium Basis or the Claims Basis.
- Premium Basis: This typically involved taking 18% of the first €61.3 million of gross premiums and 16% of the remainder. This was then multiplied by the "retention ratio" (the proportion of risk the company kept versus what it gave to reinsurers).
- Claims Basis: This involved taking 26% of the average claims cost for the first €42.9 million and 23% of the remainder, again adjusted for reinsurance.
The "higher of" rule ensured that if an insurer was under-pricing its premiums (a common cause of insurance failure), its capital requirement would eventually be caught by the rising cost of claims. This "automatic stabilizer" is one of the features of Solvency I that modern analysts still admire for its simplicity and effectiveness.
For Life Insurers
Life insurance was more complex but still deterministic. The RSM was generally 4% of the mathematical provisions (the reserves held to pay future claims) plus 0.3% of the capital at risk (the amount the insurer would have to pay if the policyholder died immediately).
In a world of zero or negative interest rates—as seen in various periods leading up to 2026—the Solvency I "4% rule" often proved to be a more rigorous standard than modern models that allowed for "matching adjustments" or "volatility adjustments," which effectively lowered the amount of capital insurers needed to hold.
Common Pitfalls and Misunderstandings
When discussing the Solvency I ratio in 2026, several common errors occur in financial reporting:
- Confusing "Solvency Ratio" with "Solvency II Ratio": In many financial statements, the term "Solvency Ratio" is used as shorthand for the Solvency II SCR (Solvency Capital Requirement) ratio. It is vital to verify whether the report is referencing the legacy volume-based ratio or the modern risk-based ratio.
- Assuming Higher is Always Better: Under Solvency I, an extremely high ratio (e.g., 500%) often indicated "lazy capital"—money sitting on the balance sheet not generating a return for shareholders. Because Solvency I didn't recognize diversification, companies were often forced to hold more capital than necessary for certain low-correlation risks.
- Ignoring the Reinsurance Cap: Solvency I allowed companies to reduce their capital requirement through reinsurance, but it often capped this reduction at 50%. Analysts sometimes forget this cap when calculating the ratio for modern companies that use heavy reinsurance.
Frequently Asked Questions
Why is Solvency I still used in some countries in 2026?
Many emerging markets prioritize regulatory simplicity and enforceability over the precision of risk-based capital. Solvency I provides a clear, "hard" floor for capital that is easy for local regulators to monitor without requiring expensive actuarial software or highly specialized PhD-level staff.
Can a company be solvent under Solvency II but insolvent under Solvency I?
Yes. Because Solvency I is volume-based, a company with very high premium growth but "low-risk" business might fail the Solvency I test while passing the Solvency II test. This usually triggers a regulatory investigation into whether the company's growth is sustainable and whether the "low-risk" label is accurate.
What is the "Minimum Guarantee Fund" in the Solvency I context?
The Minimum Guarantee Fund (MGF) was an absolute floor in Solvency I. Regardless of the percentage-based calculation, an insurer's capital could not fall below a specific Euro-denominated amount (which varied by the type of insurance). This ensured that even very small companies had enough liquidity to handle basic operational costs and initial claims.
How does the Solvency I ratio impact insurance pricing?
In jurisdictions where Solvency I is the standard, the ratio directly impacts the "cost of capital." Because the capital requirement is tied to premium volume, every dollar of new premium written requires a corresponding increase in capital. This can lead to higher prices for consumers compared to risk-based regimes where certain types of business require very little capital.
Is Solvency I related to the Basel Accords for banking?
While they share the goal of financial stability, they are different. Solvency I was the insurance equivalent of Basel I. Both focused on simple, fixed percentages of assets or volumes. As banking moved to Basel II and III, insurance moved toward Solvency II.
Practical Recommendation for 2026 Analysts
For those working in financial services, insurance auditing, or investment analysis in 2026, the Solvency I ratio should be treated as a secondary diagnostic tool.
While the Solvency II (or equivalent local RBC) ratio is the primary regulatory hurdle, you should calculate the "Shadow Solvency I Ratio" for any company you are analyzing. If the two ratios are trending in opposite directions—for example, if the Solvency II ratio is improving while the Solvency I ratio is deteriorating—it is a clear sign that the company is relying on model adjustments or "capital optimization" to mask a fundamental increase in its exposure relative to its size.
In the event of a market-wide liquidity crisis, history has shown that "simple" capital usually proves more resilient than "model-optimized" capital. Keeping the Solvency I ratio in your analytical toolkit provides a necessary layer of skepticism in an increasingly complex financial world.