Key Performance Indicators (KPIs) are quantifiable metrics used to evaluate the success of an organization or a specific activity in reaching its strategic and operational goals. Real-world examples include Net Promoter Score (NPS) for customer loyalty, Customer Acquisition Cost (CAC) for marketing efficiency, and Monthly Recurring Revenue (MRR) for financial stability.
Effective business management requires more than just high-level intuition; it demands a rigorous, data-driven approach to performance. In 2026, the proliferation of real-time data analytics and automated reporting has made it easier than ever to track progress. However, the challenge remains: which metrics actually move the needle? By focusing on specific, actionable indicators, businesses can bridge the gap between abstract strategy and day-to-day execution.
The Role of KPIs in Modern Business Strategy
Before exploring specific examples, it is essential to understand why KPIs are the cornerstone of organizational health. A KPI is not just any data point; it is a vital sign. If a general metric tells you what happened, a KPI tells you whether what happened matters in the context of your long-term objectives.
As of 2026, most high-performing organizations distinguish between Leading Indicators and Lagging Indicators. A lagging indicator, such as quarterly profit, tells you how you performed in the past. A leading indicator, such as the sales pipeline velocity, predicts future performance. Balancing these two types of metrics allows leaders to react to current problems while proactively planning for future shifts in the market.
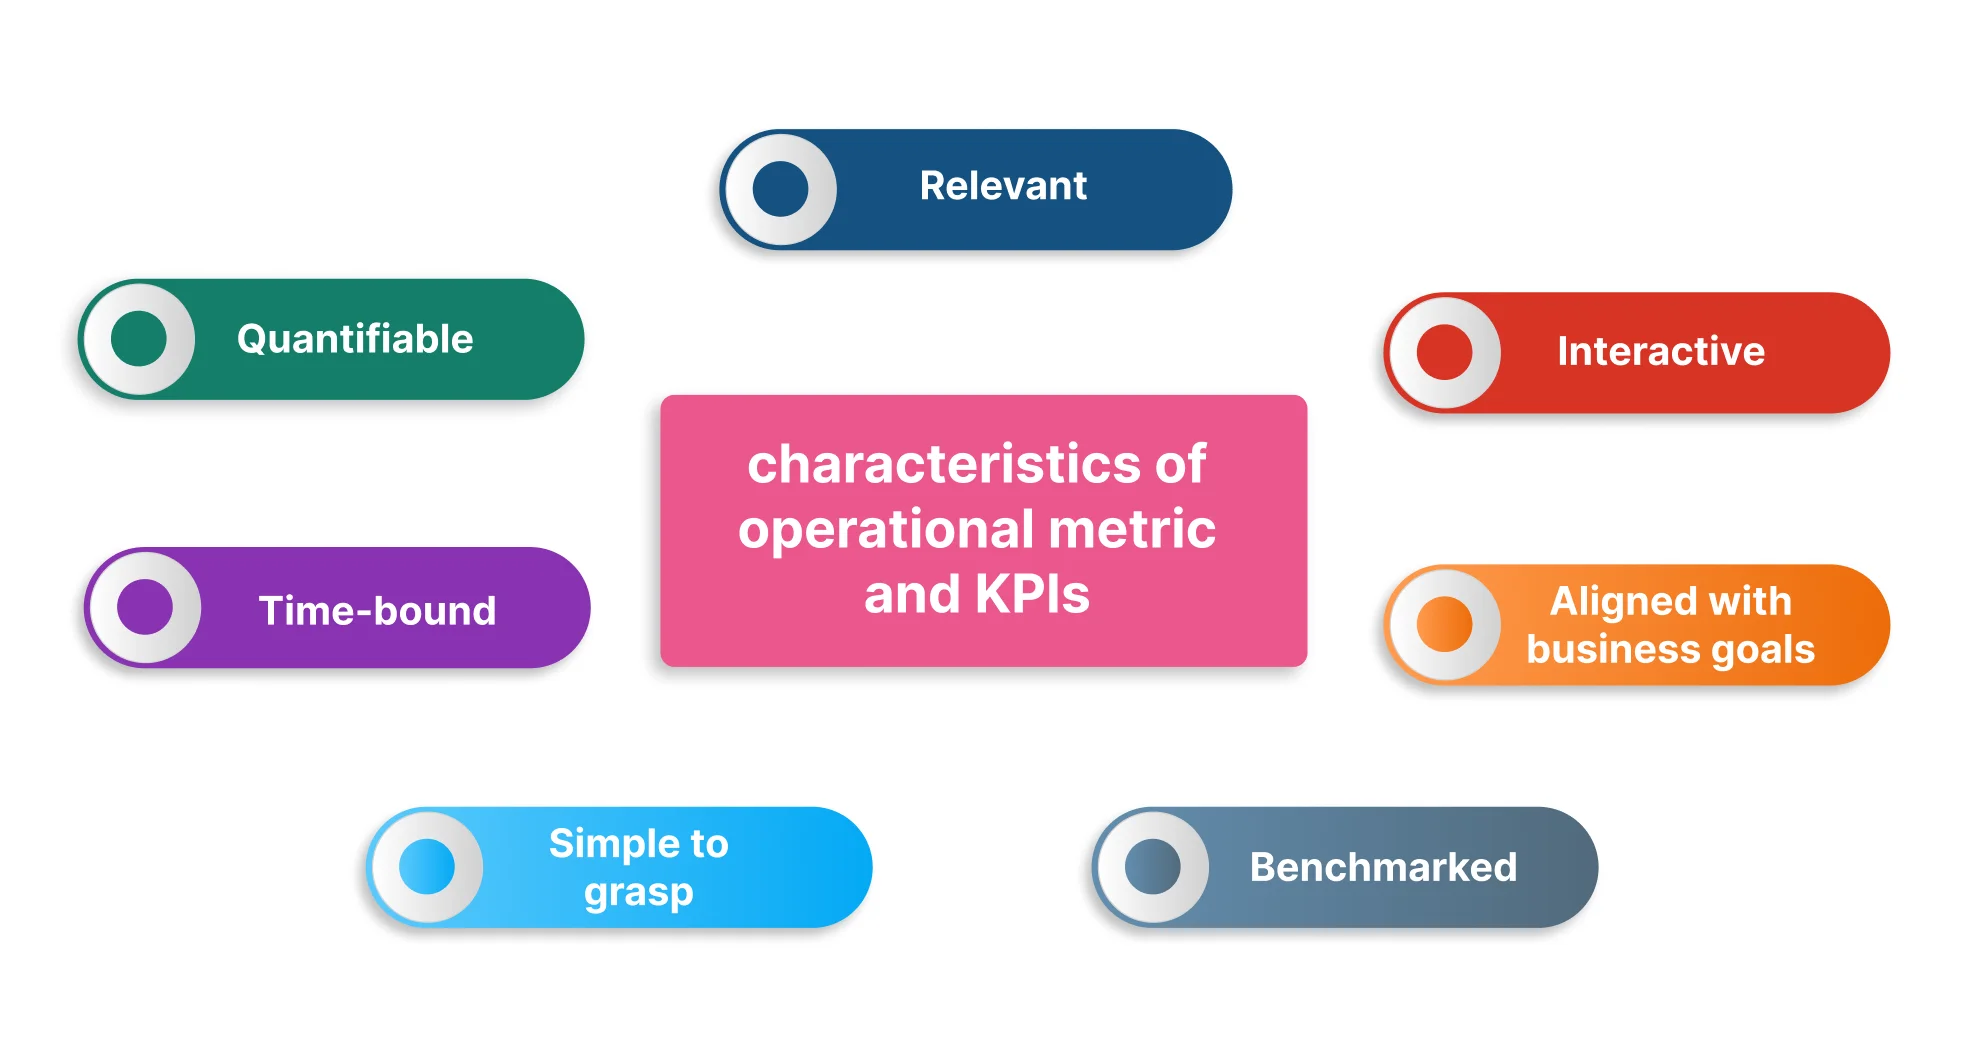
To be effective, a KPI must be:
- Aligned: It must connect directly to a specific business objective.
- Attainable: The data required must be accessible and the goals realistic.
- Acute: It should provide a clear signal, not "noise" that confuses decision-makers.
1. Customer Acquisition Cost (CAC)
Department: Marketing and Sales Type: Lagging (Efficiency)
Customer Acquisition Cost (CAC) measures the total expense required to gain a new customer. This includes all marketing spend, sales salaries, commissions, and overhead associated with the conversion process over a specific period.
Why It Matters in 2026
In an era of rising digital ad costs and privacy-focused tracking limitations, understanding the exact cost of a new customer is critical. If your CAC exceeds the Lifetime Value (LTV) of that customer, your business model is fundamentally unsustainable. Marketing teams use CAC to determine which channels (e.g., social media, search engine marketing, or organic content) provide the best return on investment.
How to Calculate It
The formula is straightforward:
Total Marketing + Sales Expenses / Number of New Customers Acquired.
For example, if a software company spends $50,000 on LinkedIn ads and $50,000 on sales personnel in June and acquires 100 new clients, the CAC is $1,000. In a real-world scenario, this $1,000 must be weighed against the revenue those customers generate to ensure profitability.
2. Net Promoter Score (NPS)
Department: Customer Success / Experience Type: Leading (Growth/Loyalty)
Net Promoter Score (NPS) is a widely used metric that gauges customer loyalty and the likelihood of organic growth through word-of-mouth. It is based on a single question: "On a scale of 0 to 10, how likely are you to recommend our product/service to a friend or colleague?"
Why It Matters in 2026
Customer retention is significantly cheaper than acquisition. A high NPS indicates a healthy relationship with the user base, while a low or declining NPS serves as an early warning sign of "churn"—when customers stop using your service. In 2026, NPS is often integrated with AI sentiment analysis to understand the "why" behind the numerical score, but the score itself remains the primary benchmark for customer satisfaction.
How to Calculate It
Respondents are categorized as follows:
- Promoters (9-10): Loyal enthusiasts.
- Passives (7-8): Satisfied but unenthusiastic customers.
- Detractors (0-6): Unhappy customers who can damage your brand.
The KPI is calculated by subtracting the percentage of Detractors from the percentage of Promoters. A score above 50 is generally considered excellent, while anything below 0 indicates a need for immediate intervention in the customer experience journey.
3. Monthly Recurring Revenue (MRR)
Department: Finance / Executive Type: Lagging (Stability)
For subscription-based businesses, Monthly Recurring Revenue (MRR) is the most critical metric for assessing financial health. It represents the total amount of predictable revenue the company expects to receive every month.
Why It Matters in 2026
MRR provides the clarity needed for long-term planning. Unlike one-time sales, MRR allows a company to forecast cash flow with high precision, which is essential for making hiring decisions, investing in R&D, or seeking venture capital.
Practical Application
Business leaders often break MRR down into sub-components:
- New MRR: Revenue from brand-new customers.
- Expansion MRR: Revenue from existing customers who upgraded their plans.
- Churned MRR: Revenue lost from customers who canceled.
By monitoring these segments, a CEO can see if growth is coming from new sales or if the product is so valuable that existing customers are spending more over time.
4. Inventory Turnover Ratio
Department: Operations / Supply Chain Type: Lagging (Efficiency)
Inventory Turnover measures how many times a company has sold and replaced its inventory during a specific period. It is a vital metric for retail, manufacturing, and e-commerce businesses.
Why It Matters in 2026
Following the supply chain volatility of previous years, maintaining the "Goldilocks" level of inventory—not too much, not too little—is a competitive advantage. A low turnover ratio suggests overstocking or a decline in demand, which ties up capital that could be used elsewhere. Conversely, an extremely high turnover might suggest that the company is missing sales because items are frequently out of stock.
How to Calculate It
Cost of Goods Sold (COGS) / Average Inventory.
If a business has a COGS of $1,000,000 and carries an average inventory of $200,000, its turnover ratio is 5. This means the company clears its entire warehouse five times a year. Comparing this against industry benchmarks helps operations managers optimize their purchasing cycles.
5. Employee Turnover Rate
Department: Human Resources Type: Lagging (Culture/Cost)
Employee Turnover Rate is the percentage of employees who leave an organization during a certain period, typically a year. This includes both voluntary resignations and involuntary terminations.
Why It Matters in 2026
The cost of replacing an employee—including recruiting, onboarding, and lost productivity—can range from 1.5 to 2 times the employee’s annual salary. High turnover is often a symptom of deeper cultural issues, poor management, or uncompetitive compensation. In 2026, HR departments use this KPI to evaluate the success of "Employee Value Propositions" (EVP) and remote-work flexibility policies.
Real-World Example
A tech firm with 500 employees that loses 100 people in a year has a 20% turnover rate. If the industry average is 10%, the leadership must investigate why their staff is leaving at double the rate of competitors. Reducing this by even 5% can save the organization millions in operational costs.
6. Gross Profit Margin
Department: Finance Type: Lagging (Profitability)
Gross Profit Margin is the percentage of revenue that exceeds the Cost of Goods Sold (COGS). It represents the fundamental efficiency of a company’s production or service delivery process before accounting for overhead like rent or marketing.
Why It Matters in 2026
With ongoing fluctuations in raw material costs and labor, Gross Profit Margin is a primary indicator of "pricing power." If a company can maintain or increase its margin despite rising costs, it demonstrates a strong competitive moat. It also tells investors how much money is "left over" to reinvest in the growth of the business.
How to Calculate It
(Total Revenue - COGS) / Total Revenue x 100.
A high-margin business (like software) may have a gross margin of 80% or more, while a low-margin business (like a grocery store) might operate on 15-20%. Monitoring this KPI ensures that as a company scales, it doesn't become less efficient.
7. Average Order Value (AOV)
Department: E-commerce / Sales Type: Lagging (Revenue)
Average Order Value (AOV) tracks the average dollar amount spent each time a customer places an order. While many businesses focus on getting more customers, increasing the value of existing transactions is often a more profitable strategy.
Why It Matters in 2026
In 2026, AOV is heavily influenced by AI-driven recommendation engines. By suggesting complementary products (cross-selling) or premium versions (up-selling) at the point of purchase, businesses can increase revenue without increasing their marketing spend.
Practical Application
If an online retailer has 1,000 orders totaling $50,000 in revenue, the AOV is $50. By implementing a "Free Shipping on orders over $75" policy, the retailer may successfully push the AOV to $65, significantly boosting the bottom line while the acquisition costs remain static.
Comparison of Real-World KPIs
The following table summarizes these seven KPIs, their primary ownership within a business, and the typical frequency of review.
| KPI Example | Primary Department | Measurement Type | Typical Review Frequency |
|---|---|---|---|
| Customer Acquisition Cost | Marketing | Efficiency / Cost | Monthly |
| Net Promoter Score | Customer Success | Sentiment / Loyalty | Quarterly |
| Monthly Recurring Revenue | Finance / Exec | Growth / Stability | Monthly |
| Inventory Turnover | Operations | Efficiency | Weekly / Monthly |
| Employee Turnover Rate | Human Resources | Retention / Culture | Annually / Quarterly |
| Gross Profit Margin | Finance | Profitability | Monthly / Quarterly |
| Average Order Value | Sales / E-com | Revenue Optimization | Weekly |
Implementing KPIs: Best Practices and Common Pitfalls
Selecting the right KPIs is only half the battle; the other half is implementation. Many organizations suffer from "Data Fatigue," where they track so many metrics that they lose sight of the most important ones.
The "Less is More" Principle
A common mistake is trying to track 30 or 40 different KPIs. This dilutes focus. Most senior leaders should focus on a "North Star" metric—the one KPI that best captures the company's core value proposition—supported by 3 to 5 secondary KPIs. For a SaaS company, the North Star might be MRR; for a shipping company, it might be On-Time Delivery Rate.
Avoiding Vanity Metrics
A vanity metric is a data point that looks good on paper but doesn't correlate with actual business success. Examples include social media "likes," raw page views, or total registered users (if most are inactive). When choosing your KPIs, always ask: "If this number goes up, does it mean the business is actually healthier?"
Visualizing Data in 2026
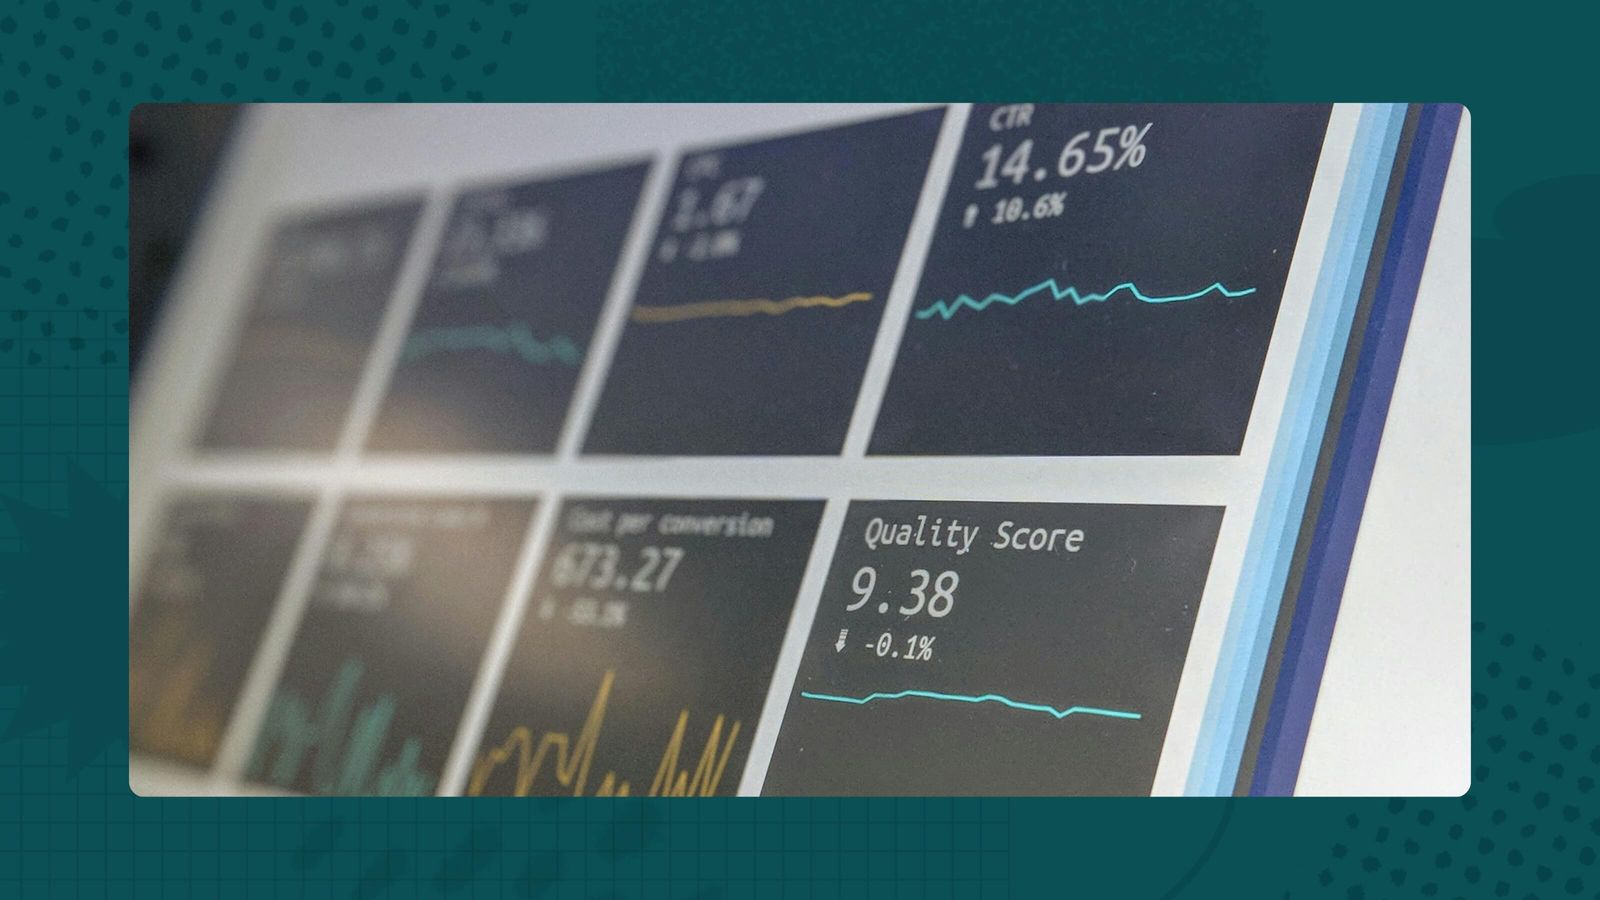
In the current business landscape, manual spreadsheets are being replaced by dynamic dashboards. Tools like Power BI, Tableau, and specialized industry platforms allow managers to see KPI fluctuations in real-time. This allows for "Agile Management," where a drop in a KPI on Monday can be addressed by a strategy shift on Tuesday, rather than waiting for a month-end report.
Frequently Asked Questions
How many KPIs should a small business track?
Small businesses should typically focus on 3 to 5 core KPIs. Over-complicating performance measurement can overwhelm a small team. Focus on one financial metric (like Cash Flow), one customer metric (like NPS), and one operational metric (like Sales Conversion Rate). As the business scales, more granular KPIs can be added to specific departments.
What is the difference between a KPI and an OKR?
While often used together, they serve different purposes. A KPI (Key Performance Indicator) measures the ongoing "health" or performance of a business process. An OKR (Objective and Key Results) is a framework for setting and achieving ambitious, time-bound goals. Think of a KPI as your car's speedometer (constant monitoring) and an OKR as your GPS destination (where you want to go).
Can KPIs be qualitative?
KPIs are by definition "quantifiable." However, they can measure qualitative concepts. For example, employee satisfaction is a qualitative feeling, but an Employee Satisfaction Index (calculated via surveys) turns that feeling into a quantitative KPI. To be a true KPI, the data must be measurable and comparable over time.
Why do some KPIs fail to improve performance?
KPIs fail when they are not tied to incentives or when employees do not understand how their daily work affects the number. If a warehouse worker doesn't know that "Inventory Turnover" is a priority, they won't change their behavior. Furthermore, if a KPI is poorly designed, it can encourage "gaming the system"—for example, sales reps offering deep discounts just to hit a "New Customer" quota, which inadvertently destroys the "Gross Profit Margin" KPI.
How often should KPI targets be updated?
In 2026, most businesses review their KPI targets annually but adjust them quarterly based on market conditions. If a target is too easy, it fails to motivate; if it is impossible, it demoralizes the team. Regular "re-baselining" ensures that the targets remain challenging but achievable.
Practical Recommendation for Business Leaders
To successfully implement these KPIs, start by auditing your current data collection methods. Ensure that your data is "clean" and that every department agrees on the definition of each metric. For instance, does "Customer" mean someone who signed a contract or someone who actually paid their first invoice?
Once definitions are set, choose one metric from the list above that addresses your biggest current challenge. If you are struggling with growth, focus on CAC and AOV. If you are struggling with profitability, focus on Gross Profit Margin. Consistently report these numbers in every leadership meeting to foster a culture of accountability and transparency. In the business environment of 2026, those who master their data are the ones who define the market.