Athletic department revenue rankings represent the total operating income generated and allocated by university sports programs within a fiscal year. In 2026, these rankings are dominated by members of the Big Ten and SEC, with top-tier programs consistently exceeding $250 million in annual revenue. This income is primarily driven by massive multi-media rights agreements, record-breaking donor contributions, and high-volume ticket sales for football and men’s basketball.
The Landscape of College Athletics Finance in 2026
The financial hierarchy of collegiate athletics has undergone a seismic shift as of 2026. Following the full implementation of the House v. NCAA settlement and the subsequent introduction of direct revenue-sharing models with student-athletes, the "revenue" figure on a balance sheet no longer tells the whole story. While gross revenues have reached historic highs due to expanded playoff formats and consolidated conference power, the "operating margin" for these departments has tightened.
Rankings are generally derived from two primary sources: the Equity in Athletics Disclosure Act (EADA) reports and the more granular NCAA Financial Reports. The EADA data provides a broad look at revenue and expenses required by federal law, whereas the NCAA reports offer a deeper dive into "generated" vs. "allocated" revenue. In 2026, the distinction between these two categories is the primary indicator of an athletic department’s true financial health.
Understanding Revenue Streams: Generated vs. Allocated
To accurately interpret athletic department revenue rankings, one must distinguish between the money a program earns and the money it is given by its parent institution.
Generated Revenue
This is the core of a self-sustaining athletic department. It includes:
- Media Rights: Payments from networks like ESPN/ABC, FOX, CBS, and NBC. For Big Ten and SEC schools, these distributions now often exceed $70 million per school annually.
- Ticket Sales: Revenue from gate receipts, dominated by "Blue Blood" football programs that sell out 100,000-seat stadiums.
- Contributions: Charitable donations from boosters. In the 2026 landscape, donor "fatigue" is a concern as boosters are also asked to fund NIL (Name, Image, and Likeness) collectives.
- Sponsorships and Licensing: Apparel deals (e.g., Nike, Adidas, Under Armour) and corporate partnerships.
Allocated Revenue
Allocated revenue consists of direct institutional support, student fees, and government subsidies. A high ranking based on total revenue can be misleading if a significant portion of that money comes from student tuition or university general funds. Most "Power Two" (Big Ten/SEC) schools report 0% allocated revenue, meaning they are entirely self-sufficient. In contrast, many programs in the "Group of Five" or smaller conferences may rely on allocations for 50% or more of their total budget.
Top 15 Athletic Department Revenue Rankings (Estimated 2026 Fiscal Cycle)
The following table represents the projected financial standing of the nation's highest-earning athletic departments. These figures reflect the first full cycle of the expanded Big Ten and SEC configurations and the new College Football Playoff (CFP) revenue distribution model.
| Rank | University | Conference | Total Revenue (Est.) | Primary Revenue Driver |
|---|---|---|---|---|
| 1 | Ohio State University | Big Ten | $285M | Media Rights & Ticket Sales |
| 2 | University of Texas | SEC | $282M | Donor Contributions & Longhorn Brand |
| 3 | Texas A&M University | SEC | $275M | Annual Contributions/Donations |
| 4 | University of Alabama | SEC | $268M | Football Licensing & Media |
| 5 | University of Michigan | Big Ten | $262M | Ticket Sales & Merchandising |
| 6 | University of Georgia | SEC | $258M | SEC Media Distribution |
| 7 | Louisiana State University (LSU) | SEC | $245M | Media Rights & Multimedia |
| 8 | University of Florida | SEC | $238M | Multi-sport Success & Media |
| 9 | Penn State University | Big Ten | $232M | Gate Receipts (Beaver Stadium) |
| 10 | University of Oklahoma | SEC | $228M | SEC Transition Revenue |
| 11 | Auburn University | SEC | $215M | SEC Media & Donor Base |
| 12 | University of Tennessee | SEC | $212M | Ticket Sales & Brand Revival |
| 13 | University of Oregon | Big Ten | $208M | Nike Partnership & Big Ten Media |
| 14 | Florida State University | ACC | $202M | ACC Distribution & Licensing |
| 15 | University of Notre Dame | Independent | $198M | NBC Media Deal & Global Branding |
The Impact of Media Rights on Rankings
The single greatest factor separating the top 15 from the rest of the pack is the media rights valuation. In 2026, the Big Ten’s multi-network deal and the SEC’s exclusive partnership with Disney (ESPN/ABC) have created a financial gulf.
The Big Ten's "tiered" distribution system, which was phased in during the mid-2020s, now provides its members with a baseline of revenue that exceeds the total operating budget of many mid-major programs. These contracts are not just about football; they include the valuation of "inventory" across women’s sports, basketball, and Olympic sports, often broadcast via conference-specific networks like the Big Ten Network (BTN) or SEC Network.
Donor Contributions and the NIL Conflict
Historically, "Contributions" were the second-largest revenue stream for top-tier athletic departments. However, as of 2026, these rankings show a plateau in traditional donor growth. The rise of NIL Collectives—third-party organizations that pay athletes for their marketing rights—has created a "split-wallet" scenario.
Schools like Texas A&M and Texas have mitigated this by integrating their fundraising arms more closely with their NIL strategies. Departments that have successfully navigated this transition maintain higher rankings because they can still fund massive capital projects (new facilities, stadium renovations) while their athletes remain competitively compensated through external sources.
Expense Management in the Revenue-Sharing Era
A high revenue ranking in 2026 does not necessarily equate to "wealth" in the traditional sense. Under the new NCAA revenue-sharing model, schools are permitted (and in many cases, practically required) to share a portion of their media and ticket revenue directly with athletes.
The current cap for revenue sharing is roughly $22 million per year per school. For the top 20 programs, this is a manageable expense that is factored into their $200M+ budgets. However, for schools ranked 50th to 100th, who may only generate $80M to $100M in revenue, this $22 million represents a massive percentage of their operating costs. This is leading to a further stratification of the rankings, where the "rich get richer" because they can afford the cost of talent more easily than their peers.
Methodology: How the Data is Verified
When analyzing revenue rankings, it is vital to use verified data points rather than anecdotal reports. The most reliable sources include:
- USA Today College Athletics Database: This remains the industry standard for comparing public university finances. It strips away certain accounting "tricks" to show a clearer picture of generated revenue.
- The Knight Commission on Intercollegiate Athletics: This body provides detailed breakdowns of spending per athlete vs. revenue generated, offering context to the raw numbers.
- The EADA Database: Operated by the U.S. Department of Education, this is the most comprehensive source for both public and private institutions (though private schools like USC, Miami, and Stanford are not required to provide the same level of detail as public ones).
- University Annual Financial Reports: For the most technical depth, reviewing a university's audited financial statements can reveal how much debt an athletic department is carrying—a factor that raw revenue rankings often ignore.
USA Today Athletics Finance Database Knight Commission on Intercollegiate Athletics NCAA Financial Reporting Requirements
Common Pitfalls in Interpreting Rankings
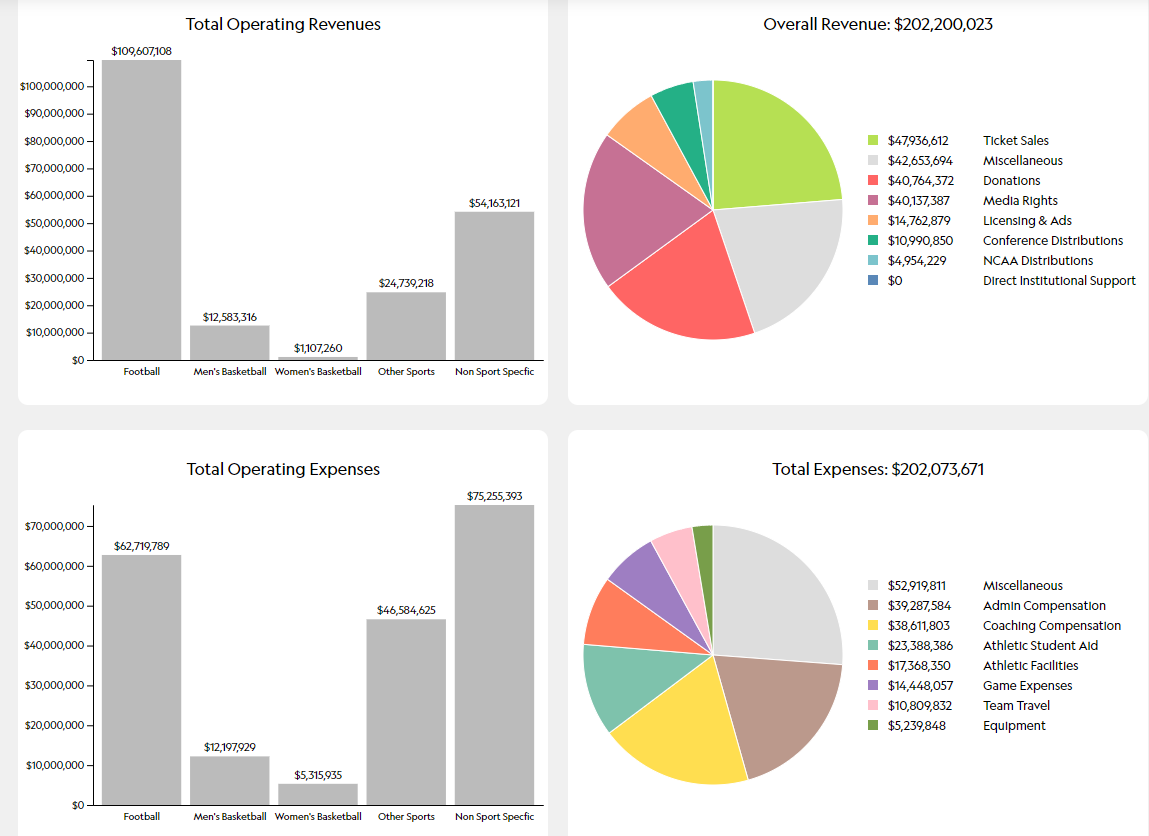
Many observers make the mistake of equating revenue with profit. In collegiate athletics, almost no department "makes money" in the way a corporation does. Instead, they are "zero-sum" entities. If a department generates $200 million, it typically spends $200 million.
The money is reinvested into:
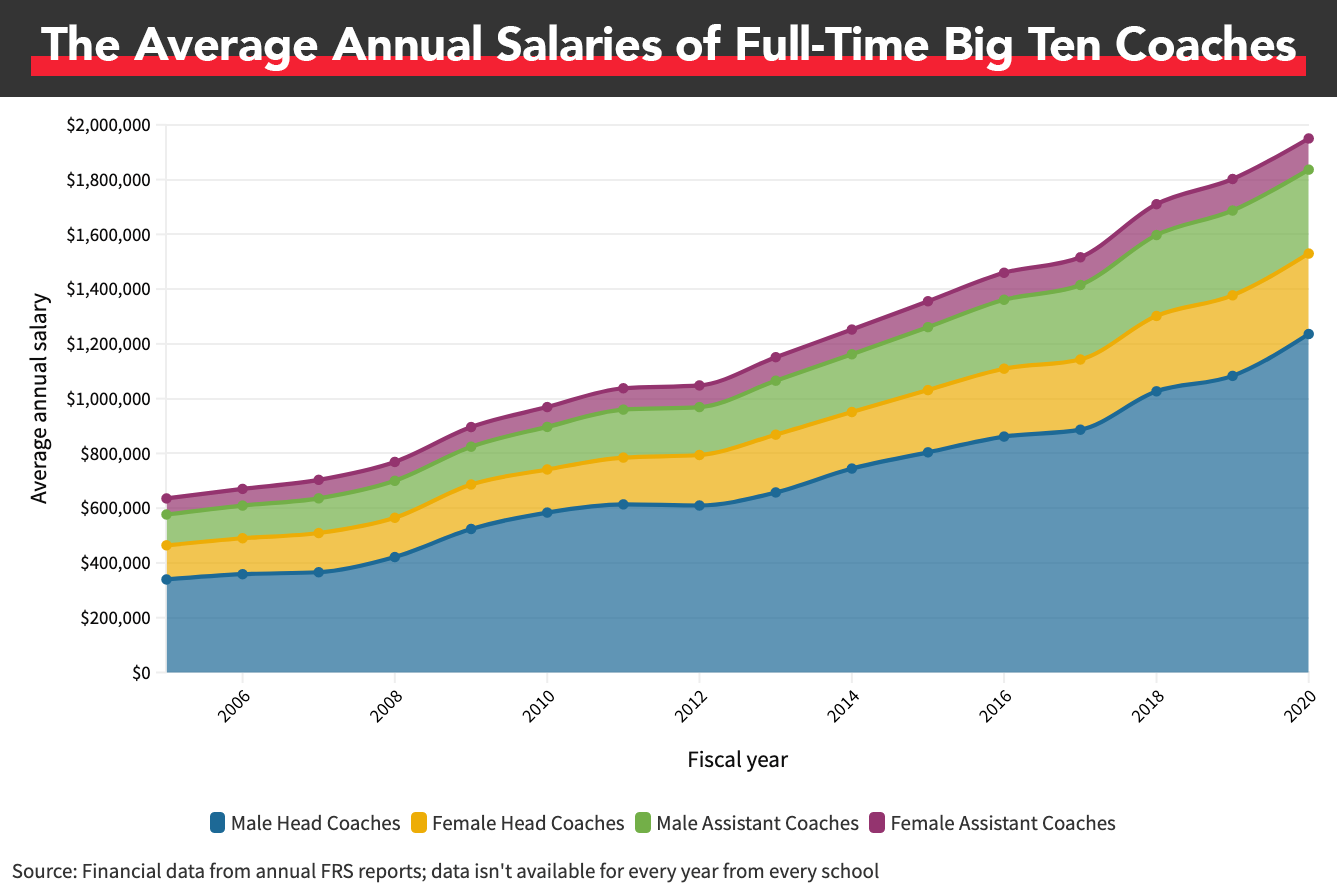
- Coaching Salaries: Top football coaches now command $10M–$15M annually.
- Non-Revenue Sports: Revenue from football and basketball subsidizes sports like track and field, swimming, and tennis, which rarely turn a profit.
- Facilities Debt: The "arms race" for the best weight rooms and locker rooms has led to significant long-term debt service payments.
The Future of Revenue Rankings: Private Equity?
By 2026, there is significant discussion regarding private equity investment in college athletics. Several "Big 12" and "ACC" programs have explored selling a percentage of their future media rights or commercial revenue to private firms in exchange for an immediate cash infusion. If this trend continues, revenue rankings may soon include "capital injections" alongside traditional streams, complicating how we measure the financial power of these institutions.
FAQ: Athletic Department Revenue
1. Which college athletic department makes the most money?
As of the 2026 fiscal cycle, Ohio State University and the University of Texas consistently vie for the top spot. Both programs regularly generate over $275 million in total revenue, driven by massive stadium capacities and elite media rights distributions through the Big Ten and SEC, respectively.
2. Do these rankings include NIL money paid to players?
No. Revenue rankings typically reflect money that flows through the university's books. NIL (Name, Image, and Likeness) payments usually come from third-party collectives or private endorsement deals and are not counted as athletic department revenue, although new revenue-sharing rules in 2026 allow schools to pay some of this directly.
3. Why are private schools like USC or Notre Dame often missing from detailed lists?
Private universities are not subject to public records requests (FOIA). While they must report high-level data to the Department of Education under the EADA, they do not have to disclose the granular financial details (such as specific donor names or itemized coaching bonuses) that public universities do.
4. How does conference realignment affect these rankings?
Realignment is the primary driver of ranking volatility. When schools like Texas and Oklahoma moved to the SEC, or Oregon and Washington moved to the Big Ten, their projected revenue increased by tens of millions of dollars annually due to the higher media payouts associated with those conferences.
5. Is "revenue" the same as "profit" in college sports?
Generally, no. Most athletic departments operate as non-profit entities within their universities. Any "surplus" revenue is typically reinvested into facility upgrades, coaching salaries, or the funding of non-revenue generating sports like golf or volleyball.
Practical Next Steps for Researchers
For those seeking to conduct a deep-dive analysis into a specific school's financial standing:
- Access the EADA Cutting Tool: Search for the specific institution on the Department of Education's website to see the gender-equity breakdown of spending and revenue.
- Compare "Generated" vs "Allocated" Revenue: Look at the percentage of the budget that comes from student fees. A program that generates $100M but takes $40M from students is financially "weaker" than a program that generates $90M with $0 in student fees.
- Review Debt Service: Check the university’s annual financial report to see how much of the "revenue" is immediately going to pay off stadium bonds. This reveals the department’s actual liquidity.