Atlanta crime stats in 2026 reflect a city navigating the transition between legacy policing and data-driven public safety technology. While violent crime categories like homicide have shown stabilization compared to the early 2020s, property crimes—specifically motor vehicle theft and larceny—continue to fluctuate based on localized trends and law enforcement staffing levels across the city's six zones.
Understanding the Framework of Atlanta’s Crime Data
To accurately interpret Atlanta crime stats, one must first understand the methodology used by the Atlanta Police Department (APD). Like most major metropolitan areas in the United States, Atlanta transitioned fully to the National Incident-Based Reporting System (NIBRS) several years ago. This shift is critical for data transparency but often causes confusion when comparing current figures to historical data from the previous decade.
Under the old Uniform Crime Reporting (UCR) Summary Reporting System, the "Hierarchy Rule" applied. If a single incident involved both a robbery and a homicide, only the homicide was recorded. Under NIBRS, every individual offense within a single incident is recorded. Consequently, 2026 statistics may appear "higher" than those from the mid-2010s simply because the reporting is more granular and comprehensive.
The APD releases data through the COBRA (Computer Optimized Burden Reduction Analysis) report. These weekly reports provide a "year-to-date" (YTD) comparison, allowing residents and researchers to see how the current week's crime volume compares to the same timeframe in the previous year. For those analyzing 2026 trends, these reports serve as the primary source of truth.
Violent Crime Trends: Homicide, Assault, and Robbery
Violent crime remains the most scrutinized metric in the Atlanta metropolitan area. As of 2026, the city has focused heavily on reducing "random" acts of violence, though a significant percentage of aggravated assaults and homicides continue to involve parties known to one another.
Homicide and Aggravated Assault
Following a peak in violent incidents between 2020 and 2022, the city implemented several "Anti-Violence" task forces. In 2026, the homicide rate has shown a stabilizing trend, largely attributed to the APD’s Homicide Unit maintaining a clearance rate significantly higher than the national average.
Aggravated assaults, however, remain a challenge. These incidents are often categorized by the use of a firearm or another weapon with the intent to cause serious bodily injury. Data from 2026 suggests that a high concentration of these crimes occurs in high-density entertainment districts, leading the city to implement stricter "nuisance" ordinances for clubs and bars that fail to provide adequate private security.
Robbery Patterns
Robbery, defined as taking property through force or the threat of force, has seen a divergence in 2026. Pedestrian robberies in Midtown and Downtown have decreased due to increased "blue light" camera visibility and the expansion of the Connect Atlanta program. Conversely, commercial robberies occasionally spike in more isolated parts of Zone 1 and Zone 4.
Property Crime and the Impact of Technology
Property crime constitutes the bulk of the incidents recorded in Atlanta crime stats. This category includes burglary, larceny (theft), and motor vehicle theft.
The Evolution of Motor Vehicle Theft
In 2026, motor vehicle theft continues to be influenced by the long-tail effects of security vulnerabilities in certain vehicle makes that gained notoriety in earlier years. While manufacturers have issued patches, "theft for transport" or "joyriding" remains a common offense among juvenile populations. The APD has responded by distributing steering wheel locks and utilizing License Plate Readers (LPRs) at major intersections to track stolen vehicles in real-time.
Larceny from Auto (Theft from Vehicles)
Larceny from auto remains the single most common crime in the City of Atlanta. This often involves "sliding" (stealing from a car while the owner is pumping gas) or "smash-and-grabs" in parking decks. Public safety campaigns in 2026 continue to emphasize the "Clean Car Campaign," urging residents and visitors to remove all valuables—especially firearms—from their vehicles.
Neighborhood-Specific Data: The Six Policing Zones
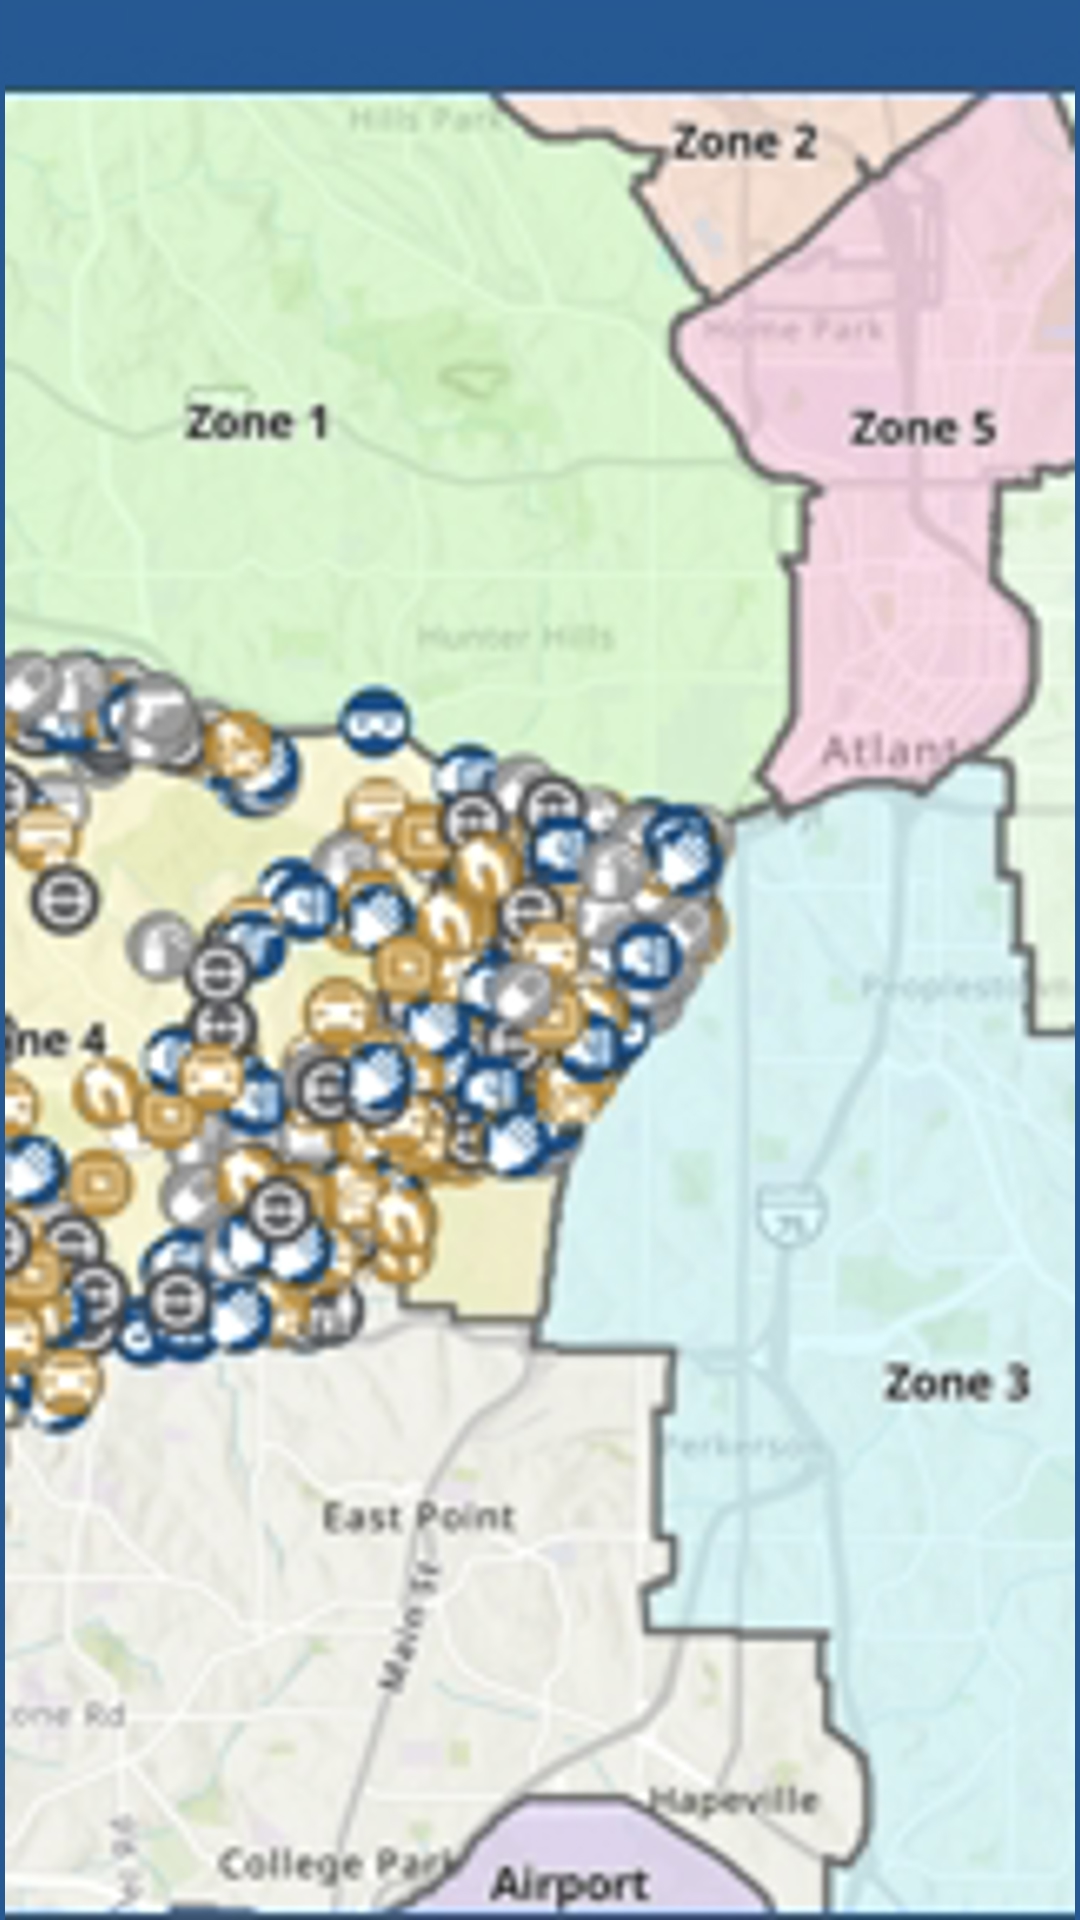
Atlanta is divided into six distinct policing zones, each with its own demographic profile and specific crime challenges. Analyzing Atlanta crime stats by zone provides a much clearer picture of safety than city-wide averages.
| Zone | Primary Neighborhoods | 2026 Crime Profile Focus | Safety Initiatives |
|---|---|---|---|
| Zone 1 | West End, Bankhead, Hunter Hills | Reducing aggravated assault | Community policing, youth outreach |
| Zone 2 | Buckhead, Lenox, Piedmont Heights | Property crime, larceny from auto | Private-public camera integration |
| Zone 3 | South Atlanta, Beltline South Trail | Reducing residential burglary | Increased patrol visibility |
| Zone 4 | Southwest Atlanta, Cascade, Greenbriar | Violent crime prevention | Focus on repeat offenders |
| Zone 5 | Downtown, Midtown, Castleberry Hill | Pedestrian larceny, crowd control | Video Integration Center (VIC) monitoring |
| Zone 6 | East Atlanta, Old Fourth Ward, Virginia Highland | Nightlife-related robbery/assault | Neighborhood watch expansion |
Zone 2 (Buckhead)
Zone 2 typically reports the highest volume of property crimes but the lowest volume of violent crimes. In 2026, the focus in Buckhead is on high-end retail theft and "smash-and-grab" incidents at shopping centers. The proliferation of high-definition cameras and the Buckhead Security Plan have significantly aided in the rapid identification of suspects.
Zone 5 (Downtown and Midtown)
As the commercial and tourism heart of the city, Zone 5 deals with high foot traffic. Crime stats here are often skewed by the sheer volume of non-residents (commuters and tourists). Larceny is the primary concern, particularly during large-scale events at the Mercedes-Benz Stadium or State Farm Arena.
Factors Influencing 2026 Statistics
Several systemic factors influence the numbers seen in Atlanta’s crime reports. Understanding these "why" factors is essential for any technical SEO or data analysis of the region.
- Staffing Levels: The APD has worked aggressively to return to a full force of approximately 2,000 sworn officers. In 2026, recruitment and retention bonuses have helped stabilize the department, leading to faster response times and more proactive patrolling.
- Judicial Backlogs: The Fulton County court system has historically faced backlogs. The speed at which "repeat offenders" are processed and sentenced directly impacts the recidivism rates seen in property crime stats.
- The Video Integration Center (VIC): Atlanta’s "smart city" approach relies heavily on the VIC. By 2026, thousands of private business and residential cameras have been integrated into the APD’s network, allowing real-time monitoring of crime scenes.
- Economic Shifts: Inflation and housing costs in the Atlanta metro area continue to place pressure on vulnerable populations. Data suggests a correlation between areas of high economic displacement and increases in "survival crimes" or petty larceny.
How to Access Live Atlanta Crime Data
For those seeking the most current information, the City of Atlanta provides several official portals:
- APD COBRA Reports: These are released weekly and provide a raw count of Part I crimes (the most serious categories).
- Atlanta Police Foundation (APF): This organization often provides context and analysis on how private funding is impacting crime reduction.
- Neighborly Apps: While not official "stats," platforms like Nextdoor or Citizen are used by residents to report incidents in real-time, though they lack the verification of official APD records.
It is important to distinguish between "perceived crime" and "reported crime." Social media can often amplify a single incident, making it appear as though a neighborhood is experiencing a "crime wave" when the official Atlanta crime stats show a year-over-year decrease.
Professional Limitation and Safety Disclaimer
While crime statistics provide a data-driven snapshot of public safety, they cannot predict individual experiences or guarantee safety in any specific location. Crime data is subject to reporting delays and administrative reclassifications. Residents and visitors should always exercise standard safety precautions, regardless of statistical trends.
Frequently Asked Questions
Is Atlanta safer in 2026 than in 2021?
Statistically, Atlanta has seen a decrease in certain violent crime categories since the 2021 peak. The implementation of the Repeat Offender Tracking Unit and expanded surveillance technology have contributed to a more controlled environment in the city's high-traffic corridors. However, property crime remains a persistent issue that keeps overall crime volume high.
What is the most common crime in Atlanta?
Larceny—specifically theft from motor vehicles—is the most common crime reported in Atlanta. This category consistently accounts for a significant portion of the total Part I crimes in the city. Most of these incidents are crimes of opportunity where valuables are left in plain sight.
How does Atlanta's crime rate compare to other major cities?
Compared to other cities of similar size and density, such as Birmingham or Memphis, Atlanta’s violent crime rate is often lower, while its property crime rate is comparable to other major hubs like Charlotte or Nashville. The city’s status as a regional transportation and entertainment hub contributes to higher larceny rates due to the large influx of daily visitors.
Where can I find neighborhood-level crime maps for Atlanta?
The APD provides an interactive crime mapping tool through their official website, often powered by platforms like CityProtect or Tyler Technologies. These maps allow users to filter by date, crime type, and specific address to see incidents within a specific radius.
Does the "Beltline" affect crime statistics?
The Atlanta Beltline has its own dedicated police patrol. While the trail has seen occasional high-profile incidents, the 2026 stats show that the Beltline is generally safer than the surface streets of the neighborhoods it passes through, thanks to high visibility and the "eyes on the street" provided by constant pedestrian activity.
Practical Recommendations for Residents and Visitors
To minimize the risk of becoming a statistic in the Atlanta crime reports, follow these data-backed recommendations:
- Practice "Clean Car" Habits: Never leave bags, electronics, or firearms in a parked vehicle, even for a few minutes. Most larcenies in Zone 2 and Zone 5 occur in under three minutes.
- Register Private Cameras: If you are a resident, consider registering your external security cameras with the APD’s Connect Atlanta program. This does not give police "live" access to your home but allows them to request footage quickly if a crime occurs nearby.
- Stay Informed via COBRA: Regularly check the weekly COBRA reports for your specific precinct. Understanding whether your neighborhood is seeing a spike in burglaries can help you take proactive measures, such as improving exterior lighting.
- Engage with NPUs: Atlanta’s Neighborhood Planning Units (NPUs) are a vital link between citizens and the police. Attending these meetings allows you to hear directly from Zone Commanders about current trends and localized safety initiatives.