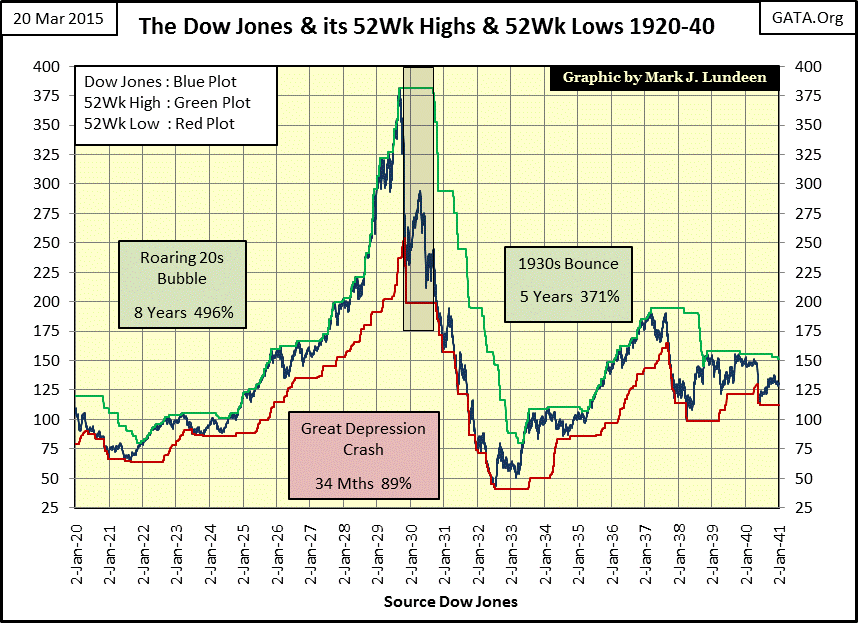
A 52-week high represents the highest price at which a security has traded during the previous year. It serves as a critical technical indicator used by investors and analysts to gauge momentum, identify potential breakouts, and assess the prevailing market sentiment surrounding a specific asset or index.
In the landscape of 2026, where algorithmic trading and high-frequency data dominate the exchanges, the 52-week high remains one of the most widely followed metrics in technical analysis. While some investors view a stock hitting its yearly peak as a sign that it is "too expensive," professional market participants often interpret it as a signal of strength. Understanding the nuances of this indicator is essential for navigating modern equity markets, as it bridges the gap between psychological behavior and technical price action.
The Psychological Foundation of the 52-Week High
The significance of the 52-week high is rooted deeply in behavioral finance, specifically the concept of anchoring. Anchoring occurs when market participants fixate on a specific price point as a benchmark for value. For many, the highest price achieved over the last 12 months represents a psychological "ceiling" or resistance level.
When a stock approaches this level, investors who purchased at lower prices may be tempted to sell and realize gains, creating a supply of shares that can stall the upward trajectory. Conversely, those who missed the previous rally might wait for a "breakout" above this high to confirm that the uptrend is sustainable.
The transition from resistance to support is a pivotal moment in market analysis. Once a security convincingly breaks above its 52-week high, the previous "ceiling" often becomes a new "floor." This shift happens because the market has collectively agreed that the asset is worth more than it has been at any point in the last year, often due to improved fundamentals, a change in sector dynamics, or broader macroeconomic shifts.
Technical Significance: Breakouts and Momentum
From a technical perspective, the 52-week high is a primary component of momentum-based trading strategies. Technical analysts look for "clean" breakouts, where the price moves above the 52-week high on significant trading volume.
The Role of Volume
Volume acts as a verification tool. If a stock reaches a 52-week high on low volume, the move may lack conviction and could result in a "false breakout" or "bull trap." However, if the price surges past the yearly high accompanied by a spike in volume, it suggests that institutional buyers are entering the fray, providing the necessary liquidity to sustain the move.
Resistance and Consolidation
Rarely does a stock move in a straight line. Often, as a security nears its 52-week high, it undergoes a period of consolidation. This is a sideways trading pattern where the bulls and bears reach a temporary equilibrium. Market analysts view a consolidation period just below the 52-week high as a bullish sign, indicating that the stock is "digesting" its recent gains before attempting to push higher.
Practical Strategies for Using 52-Week Highs
Investors utilize the 52-week high in various ways depending on their risk tolerance and time horizon. As of 2026, these strategies have been refined by the integration of real-time volatility tracking and automated execution.
1. The Breakout Strategy
This is the most common approach. Traders wait for the price to close above the 52-week high and then enter a long position. The logic is that the stock has no immediate "overhead resistance," meaning there are no recent sellers who are looking to "get out even." This lack of resistance can lead to rapid price appreciation.
2. The Pullback Entry
Conservative investors often avoid buying exactly at the 52-week high to minimize the risk of a false breakout. Instead, they wait for the price to break the high and then "retest" that level. If the price drops back to the former 52-week high and holds steady—turning old resistance into new support—it provides a more favorable risk-reward entry point.
3. The Relative Strength Filter
Market analysts frequently compare a stock’s proximity to its 52-week high against its peers or a benchmark index like the S&P 500. A stock that hits a 52-week high while the broader market is declining is said to have exceptional relative strength. This often indicates internal corporate strength or a sector-specific tailwind that makes the stock a defensive leader.
Comparative Analysis: 52-Week High vs. 52-Week Low
To fully understand the role of the 52-week high, it must be contrasted with its counterpart, the 52-week low. Both metrics provide context, but they signal very different market conditions.
| Feature | 52-Week High | 52-Week Low |
|---|---|---|
| Market Sentiment | Bullish / Optimistic | Bearish / Pessimistic |
| Technical Status | Resistance (before breakout) | Support (before breakdown) |
| Investor Action | Buying strength / Momentum | Value hunting / Capitulation |
| Risk Profile | Buying at the top (overvaluation risk) | Catching a falling knife (continued decline) |
| Volume Significance | High volume confirms breakout | High volume confirms panic selling |
| Trend Direction | Uptrend / Expansion | Downtrend / Contraction |
The "52-Week High Effect" in Academic Research
Interestingly, the 52-week high is one of the few technical indicators that has received substantial support from academic research. Studies, such as those by George and Hwang, have identified what is known as the 52-Week High Effect.
Their research suggests that stocks near their 52-week highs tend to outperform in the short term. The theory is that investors underreact to positive news when a stock is near its 52-week high because they are hesitant to push the price past that psychological barrier. When the news is finally fully "priced in" and the barrier is broken, the price often moves rapidly to catch up with its true fundamental value. This creates a window of opportunity for momentum traders to capitalize on the delayed reaction of the broader market.
Risks and Limitations of the Indicator
While powerful, the 52-week high is not a foolproof signal. Relying on it in isolation can lead to significant errors in judgment.
- False Breakouts: Not every move above a 12-month peak is sustainable. Market "noise" can briefly push a price to a new high before it reverses sharply.
- Overextension: A stock hitting a 52-week high may be "overbought" in the short term. Indicators like the Relative Strength Index (RSI) can help determine if a stock has moved too far, too fast, and is due for a correction.
- Lagging Nature: Because it is based on a year’s worth of historical data, the 52-week high is a lagging indicator. It tells you what has happened, not necessarily what will happen.
- Macroeconomic Context: In a runaway bull market, many stocks will hit 52-week highs simply because of the rising tide. In these cases, the indicator loses some of its individual predictive power.
Integration with Other Technical Indicators
To increase the probability of success, seasoned analysts never use the 52-week high alone. It is typically combined with other tools to provide a holistic view of the market.
Moving Averages
A stock hitting a 52-week high should ideally be trading above its 50-day and 200-day moving averages. If a stock hits a new high but is still below a long-term moving average (which can happen after a massive crash), the "high" is less significant than one achieved during a sustained structural uptrend.
Fundamental Overlay
In 2026, the convergence of technical and fundamental analysis is more prominent than ever. Analysts look for "High-Growth, High-Price" scenarios where a 52-week high is supported by strong earnings growth, expanding profit margins, or innovative product launches. A breakout backed by a strong earnings report is significantly more reliable than one driven by social media speculation or temporary market sentiment.
Sector-Specific Considerations
The role of the 52-week high can vary depending on the sector:
- Technology and Growth: In these sectors, 52-week highs are common during expansion cycles. Investors are often willing to pay a premium for future growth, leading to frequent breakouts.
- Utilities and Value: These stocks are often "range-bound." A 52-week high here might signal that the stock is becoming overvalued relative to its dividend yield, prompting value investors to sell.
- Commodities: 52-week highs in cyclical sectors like mining or oil often reflect global supply-and-demand shifts rather than company-specific news.
Conclusion and Strategic Recommendation
The 52-week high is a vital instrument in the modern analyst's toolkit. It serves as a clear marker of where the market has been and provides a roadmap for where it might go. By identifying points of psychological resistance and momentum-driven breakouts, investors can better time their entries and exits.
However, the key to utilizing this indicator effectively in 2026 is context. A 52-week high should be viewed as a "starting point" for investigation rather than a definitive "buy" signal. Investors should verify the breakout with volume analysis, check for relative strength against the broader market, and ensure that the company's fundamentals support the higher valuation.
Frequently Asked Questions
Does a 52-week high mean a stock is overvalued?Not necessarily. While a stock at its 52-week high is more expensive than it has been in a year, its "value" is determined by earnings, growth potential, and market conditions. Many of the best-performing stocks in history spent months or even years hitting consecutive 52-week highs as their businesses expanded.
Is it better to buy at a 52-week high or a 52-week low?Statistically, stocks at 52-week highs have more upward momentum, while stocks at 52-week lows are often in established downtrends. Buying at a low is a "value" play but carries the risk that the stock will continue to fall. Buying at a high is a "momentum" play but carries the risk of buying at the temporary peak.
How does the 52-week high impact options trading?When a stock approaches its 52-week high, implied volatility often increases as traders anticipate a breakout or a reversal. This can make options more expensive. Traders often use "Call" options to play a breakout, allowing them to participate in the upside with limited capital at risk.
Why is exactly 52 weeks used as the standard?The 52-week period represents one full calendar year, encompassing four full cycles of quarterly earnings reports. This provides enough data to smooth out short-term seasonal fluctuations while remaining recent enough to be relevant to current market participants.
What happens if a stock hits a 52-week high on low volume?Low-volume highs are generally viewed with suspicion. They suggest a lack of institutional interest and are more prone to "reversals." In such cases, analysts often wait for a "retest" or a subsequent high-volume day to confirm the trend.
Next Steps for Investors:Review your current portfolio to see which assets are within 5% of their 52-week highs. For these assets, analyze the volume trends over the last ten trading days. If the volume is increasing as the price nears the high, consider setting a price alert just above the 52-week mark to capture a potential breakout. Always pair this technical observation with a review of the company's most recent quarterly filing to ensure the momentum is fundamentally justified.
Professional Disclaimer: This analysis is for educational purposes only and does not constitute financial, investment, or legal advice. Market conditions in 2026 can be volatile; always perform individual due diligence or consult with a certified financial advisor before making significant investment decisions.