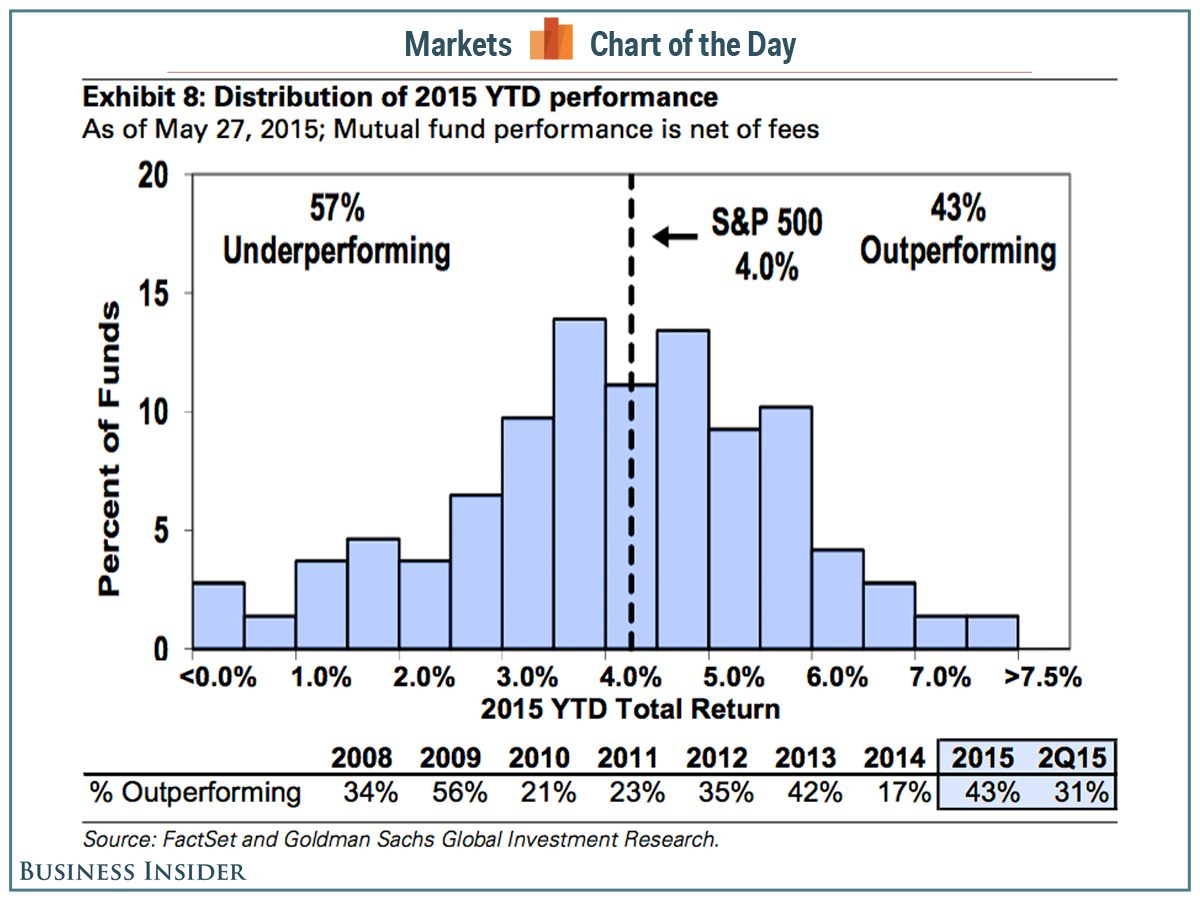
The reality of active fund management is that over a 20-year horizon ending in 2026, only approximately 7% of actively managed large-cap mutual funds have consistently outperformed the S&P 500 index. High expense ratios, significant transaction costs, and the inherent efficiency of large-cap markets make it mathematically difficult for managers to beat the benchmark after fees.
The "7% rule" is not a formal law of physics, but it is a recurring statistical reality documented by various financial researchers, most notably in the S&P Indices Versus Active (SPIVA) scorecards. As of 2026, the data remains consistent: while active managers may find short-term success over one or three years, their ability to sustain that "alpha" (excess return) diminishes sharply over a decade or more. For investors, understanding why this happens is the first step toward building a more resilient, cost-effective portfolio.
The Statistical Reality: Understanding the SPIVA Data
The primary source for the claim that a tiny fraction of funds beat the market is the SPIVA Scorecard, published semiannually by S&P Dow Jones Indices. These reports compare the performance of actively managed mutual funds against their respective benchmarks, such as the S&P 500 for large-cap funds.
Historical data shows a clear trend of "performance decay." In the short term (one year), perhaps 40% to 50% of managers might beat the S&P 500. However, as the timeframe extends to five, ten, and fifteen years, the percentage of winners drops precipitously. By the 20-year mark—looking back from our current 2026 vantage point to 2006—the number of large-cap funds that survived and outperformed the index typically hovers in the single digits, often cited around 5% to 7%.
The Role of Survivorship Bias
One reason the 7% figure is so low is that it accounts for funds that no longer exist. Survivorship bias is a common flaw in casual financial analysis; if you only look at the funds available today, the "average" performance looks better because the failures have been erased. SPIVA and other institutional researchers correct for this by including every fund that was active at the start of the period. Over 20 years, a significant portion of mutual funds are either liquidated or merged into other funds due to poor performance, further highlighting the difficulty of long-term active management.
Why Active Managers Struggle to Beat the S&P 500
It may seem counterintuitive that professional stock pickers with advanced degrees and high-speed data terminals cannot beat a "dumb" index of 500 stocks. However, several structural and economic factors create a massive headwind for active management.
The Impact of Expense Ratios and Fees
The most significant barrier to outperformance is the cost of management. An actively managed fund typically carries an expense ratio ranging from 0.60% to 1.50% or higher. In contrast, an S&P 500 index fund in 2026 might cost as little as 0.03%.
To provide the same net return to an investor, an active manager must outperform the index by at least the difference in fees every single year. Over 20 years, this compounded "fee drag" becomes an enormous hurdle. If the market returns 10% annually and the manager charges 1%, the manager must find enough winning stocks to return 11% annually just to tie with a passive index fund. In the world of finance, finding a consistent 1% edge is incredibly rare.
Transaction Costs and Turnover
Active managers trade frequently to chase gains or adjust to market conditions. Every trade incurs transaction costs, including brokerage commissions and the "bid-ask spread." Furthermore, large mutual funds often face "market impact" costs—their own large buy or sell orders move the price of the stock against them. These hidden costs are not reflected in the expense ratio but directly eat into the fund's total return.
The Efficient Market Hypothesis in Large-Cap Stocks
The S&P 500 tracks the 500 largest publicly traded companies in the U.S. These are the most scrutinized stocks in the world. Thousands of analysts, algorithms, and institutional investors track every move of companies like Apple, Microsoft, and Amazon. Because information travels instantly, stock prices usually reflect all available information. This makes it extremely difficult for any single manager to find "mispriced" stocks that will yield excess returns. The market is simply too efficient at this level for most humans to exploit consistently.
Comparison of Active vs. Passive Outcomes (20-Year Horizon)
The following table illustrates the typical performance distribution and cost impact for large-cap funds versus the S&P 500 benchmark based on long-term historical trends updated to 2026.
| Feature | Active Mutual Funds (Average) | S&P 500 Index Fund |
|---|---|---|
| Typical Annual Expense Ratio | 0.75% – 1.25% | 0.02% – 0.05% |
| 20-Year Outperformance Rate | ~5% – 9% | N/A (Benchmark) |
| Average Portfolio Turnover | 30% – 70% | 2% – 5% |
| Tax Efficiency | Lower (Frequent Capital Gains) | Higher (Low Turnover) |
| Management Style | Human Selection/Analysis | Rule-Based (Market Cap) |
| 20-Year Survival Rate | ~40% – 50% | High (Index Persistence) |
The "Closet Indexing" Problem
A hidden reason for the low outperformance rate is a phenomenon known as "closet indexing." Many active managers are afraid of underperforming the benchmark so significantly that they lose their jobs or see massive outflows of capital. To mitigate this risk, they build portfolios that very closely mimic the S&P 500, holding the same top stocks in similar weights.
When a manager does this, they are effectively providing a passive index product but charging active management fees. Mathematically, a closet indexer is almost guaranteed to underperform the benchmark by exactly the amount of their fees. Investors paying 1% for a portfolio that is 90% identical to the S&P 500 are participating in a game they are statistically destined to lose.
Persistence: Can You Pick the 7%?
A common rebuttal from proponents of active management is that investors simply need to find the "top-tier" managers—those who belong to the 7% club. However, research into performance persistence shows that winning today is not a reliable predictor of winning tomorrow.
Studies that track "top-quartile" managers over subsequent periods find that their likelihood of remaining in the top quartile is no better than random chance. A manager who beats the S&P 500 for five years in a row often experiences "mean reversion," where their luck or specific strategy falls out of favor, leading to a period of significant underperformance. This makes the task of picking the 7% of winners in advance nearly impossible for the average investor.
Tax Implications of Active Management
For investors holding funds in taxable brokerage accounts (not IRAs or 401ks), the 7% outperformance figure is actually an overestimate. Mutual funds are required by law to distribute realized capital gains to shareholders. Because active managers trade more frequently (high turnover), they trigger these distributions more often.
Even if an active manager manages to beat the S&P 500 by 0.5% on a pre-tax basis, the tax bill generated by their trading activity can easily wipe out that advantage. Index funds, with their "buy and hold" approach, are far more tax-efficient, allowing capital to compound without the annual "tax drag" associated with active trading.
How to Apply This Information in 2026
If only 7% of funds beat the market, the logical path for most investors is to prioritize low-cost index funds or Exchange Traded Funds (ETFs) that track the S&P 500. This ensures that you receive the "market return" minus a negligible fee, which statistically places you ahead of 93% of professional managers over the long run.
However, active management may still have a place in "inefficient" corners of the market where information is less readily available, such as:
- Emerging Markets: Small, international stocks that aren't covered by hundreds of analysts.
- Small-Cap Stocks: Companies with smaller market capitalizations where institutional research is thinner.
- Distressed Debt: Specialized fixed-income areas requiring deep legal and structural analysis.
For the core of a portfolio—the large-cap U.S. equity portion—the S&P 500 remains the benchmark to beat, and the odds of finding a manager who can do so consistently over decades remain slim.
Frequently Asked Questions
Does the 7% figure include dividends? Yes. Professional benchmarks like the SPIVA scorecard compare the "total return" of both the mutual funds and the index. Total return includes both the price appreciation of the stocks and the reinvestment of dividends. The S&P 500 Total Return Index is the standard used for these comparisons.
Why do some people still buy active mutual funds? There are several reasons, including the desire to "beat the market," the influence of financial advisors who may receive commissions (though this is decreasing in 2026), and the hope that a specific manager’s unique strategy will protect them during a market crash. While some active managers do perform better during bear markets, they often fail to make up for the ground lost during bull markets.
Are ETFs better than mutual funds? Not necessarily by definition, but most ETFs are passively managed and follow an index, which makes them cheaper and more tax-efficient than traditional active mutual funds. In 2026, the gap between the two has narrowed as "Active ETFs" have become more popular, but the underlying math regarding fees and outperformance remains the same.
Has the percentage of winners increased or decreased over time? Generally, the percentage of active managers beating the S&P 500 has decreased over the last several decades. This is largely attributed to the rise of high-frequency trading, better information technology, and the massive influx of professional talent into the industry, which has made the market more efficient and harder to "game."
Can a fund beat the S&P 500 after 10 years but fail after 20? Yes, and this is very common. Many managers have a "hot hand" for a decade because their specific style (e.g., Growth or Value) is in favor. However, market cycles eventually turn. A manager who refuses to change their style may see a decade of gains wiped out by a few years of significant underperformance relative to the index.
Practical Recommendation: For the majority of investors, the most reliable way to achieve long-term wealth is to avoid the "7% gamble." Instead of searching for the rare active manager who can consistently beat the S&P 500, allocate the core of your U.S. equity portfolio to a low-cost S&P 500 index fund or a Total Stock Market index fund. Focus on factors you can control: minimizing fees, maximizing tax efficiency, and maintaining a consistent contribution schedule.