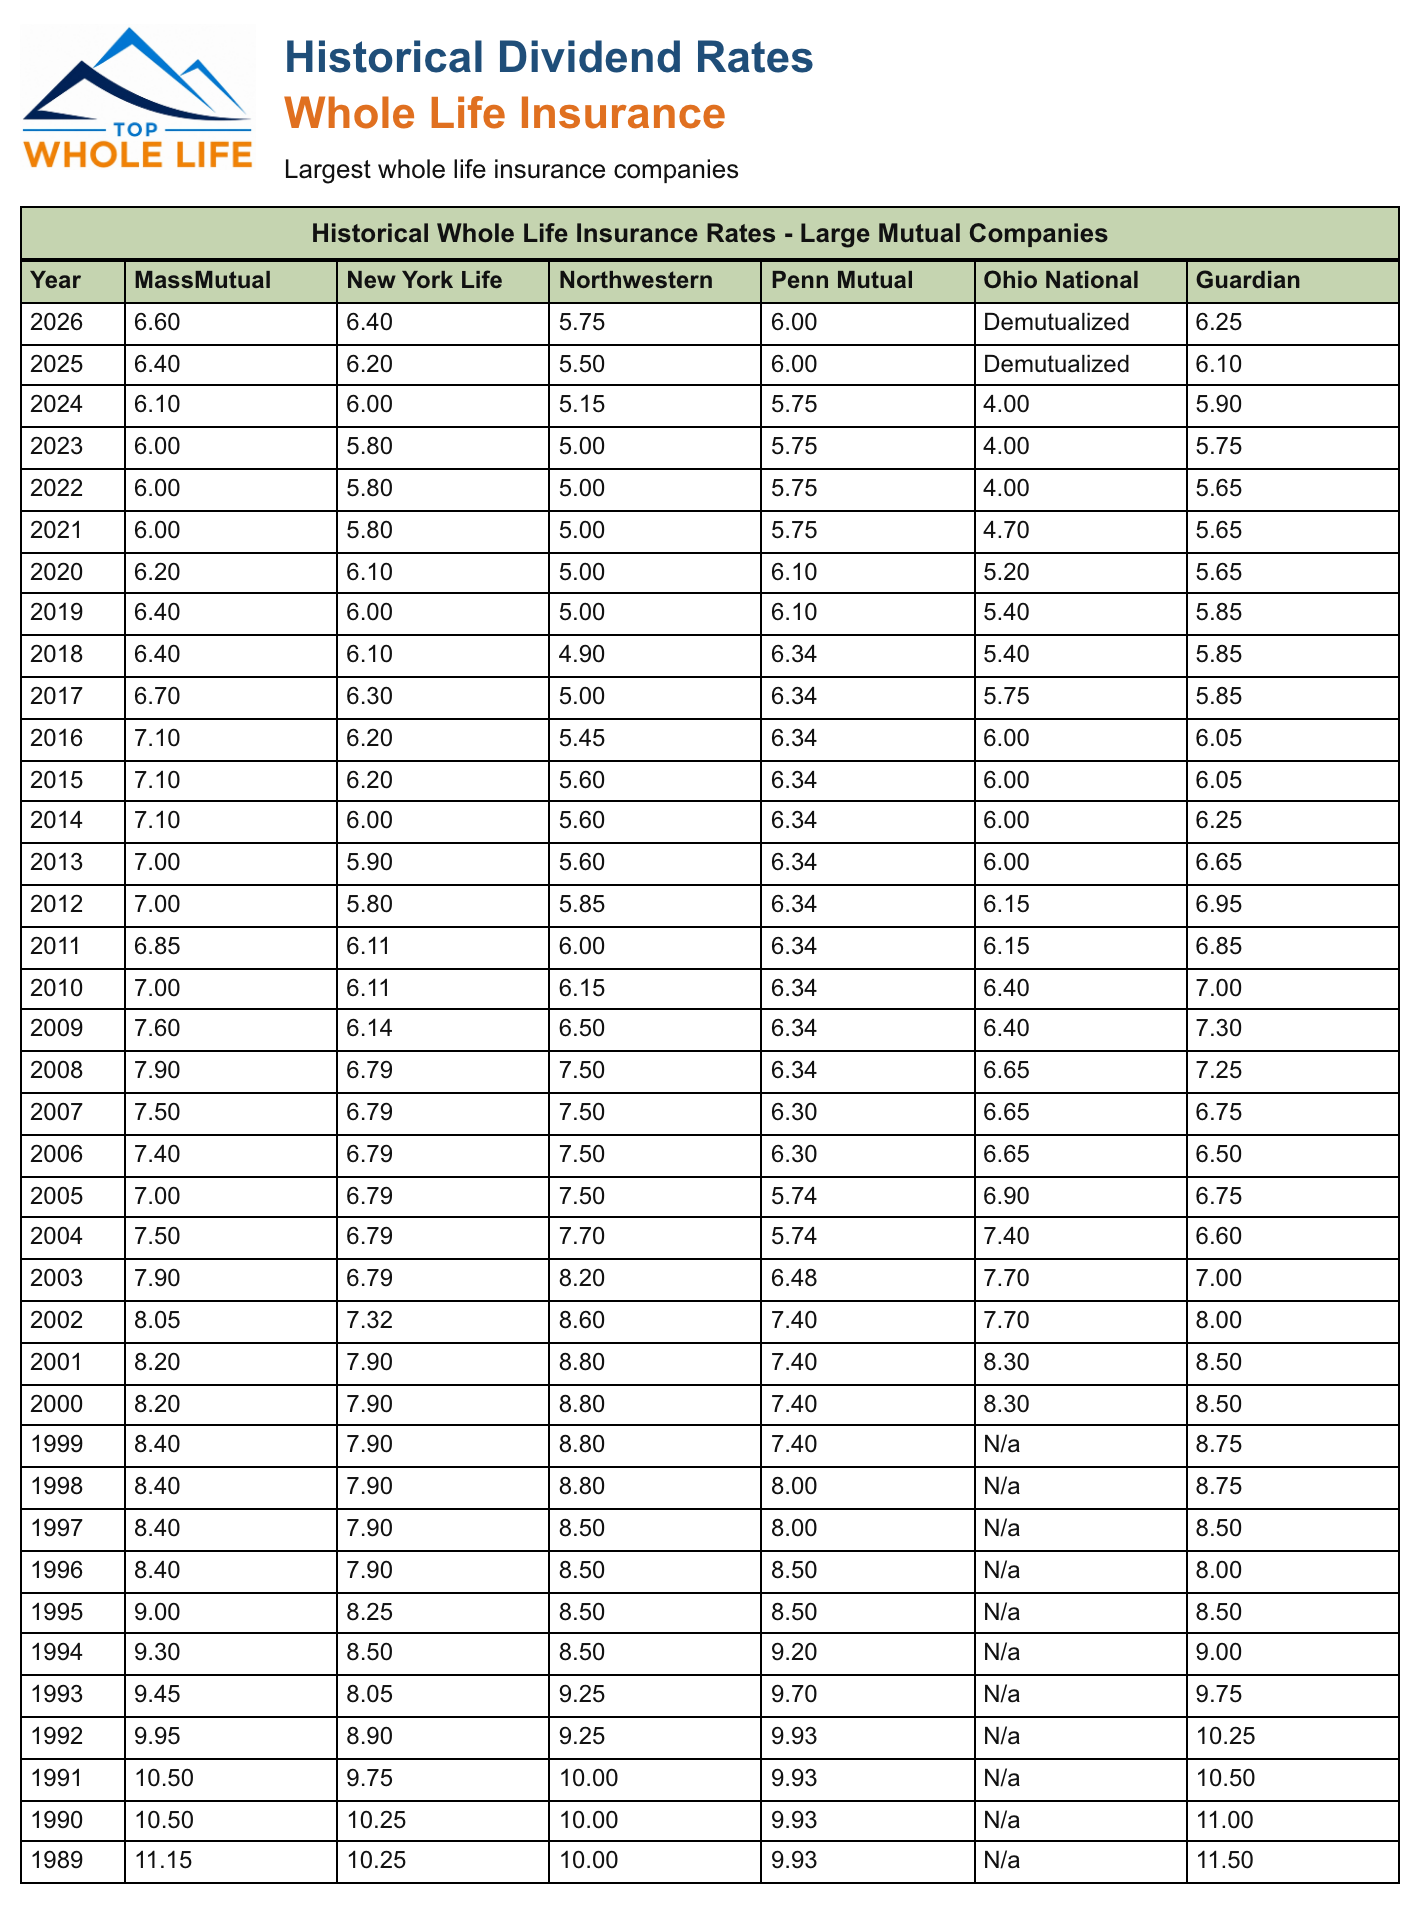
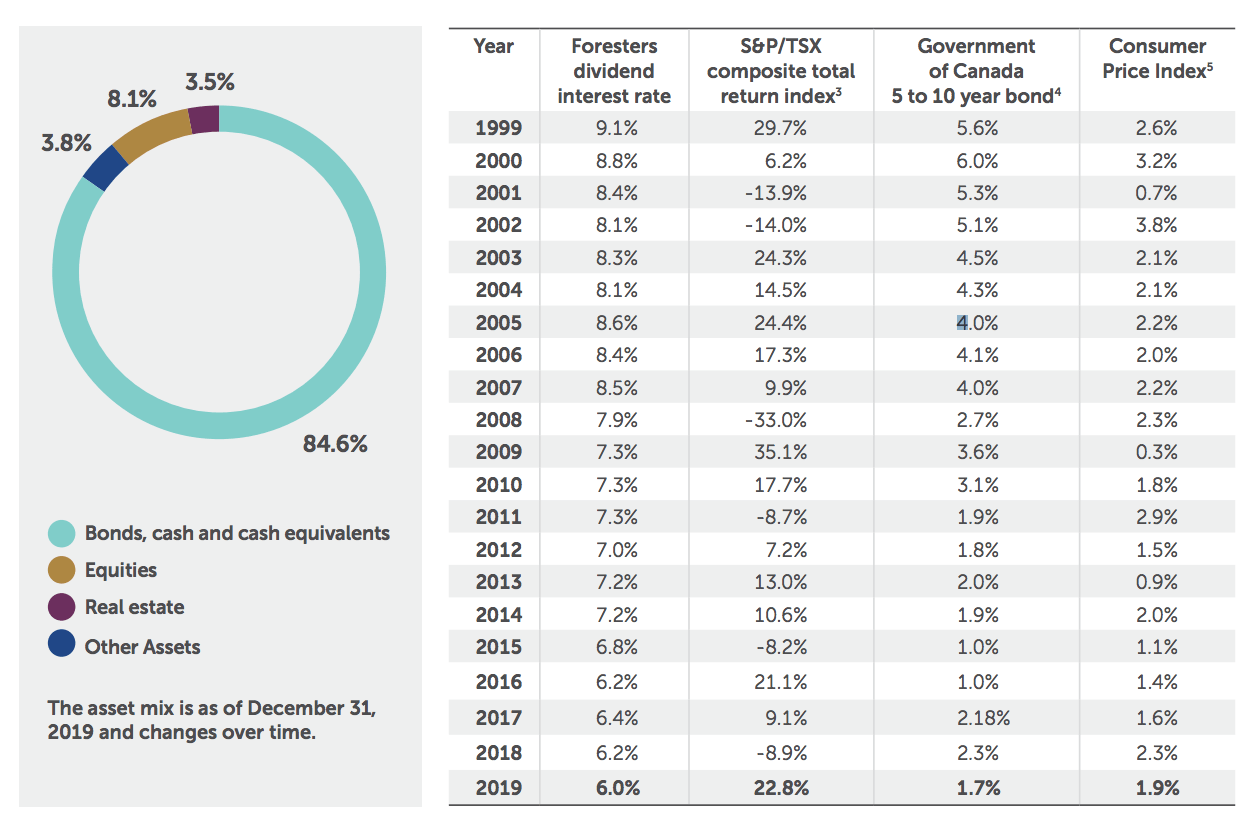
A century of mutual whole life insurance dividend histories demonstrates how well-established mutual life insurers manage economic shifts, interest rate cycles, and mortality fluctuations to return excess surplus to participating policyholders. These historical records provide a transparent window into long-term financial stability, cash value growth, and the practical performance of dividend-paying whole life policies across generational economic cycles.
Understanding the Foundation of Mutual Whole Life Insurance
To evaluate a century of dividend performance, one must first understand the structural mechanics of mutual whole life insurance. Unlike stock-based or proprietary insurance companies that answer to external shareholders seeking quarterly profits, a mutual insurance company is owned by its policyholders. When individuals purchase a participating whole life insurance policy from a mutual insurer, they become members of the cooperative structure.
The bedrock of any whole life policy is its guarantees. The insurer guarantees a fixed death benefit, a level premium schedule for the life of the policy, and a minimum guaranteed rate of cash value accumulation. However, mutual insurers typically price their products using conservative actuarial assumptions regarding mortality rates, administrative expenses, and long-term investment yields. When actual experience turns out to be more favorable than these conservative assumptions—such as when investment portfolios yield higher returns than expected or policyholders live longer than projected—the company generates a financial surplus.
This surplus can be retained as surplus capital to ensure solvency or distributed to eligible participating policyholders in the form of policy dividends. While dividends are never legally guaranteed, top-tier mutual life insurance companies with histories spanning a century or more have maintained unbroken streaks of annual dividend distributions. These streaks have weathered historic financial anomalies, including the Great Depression, hyperinflation of the 1970s and 1980s, the 2008 global financial crisis, and various pandemic-era market disruptions.
Historical Performance Through Economic Epochs
Analyzing one hundred years of dividend distribution requires breaking down the timeline into distinct macroeconomic environments. The performance of mutual life insurance dividends is intrinsically tied to the prevailing interest rate environment, because a significant portion of a mutual insurer's general account is invested in high-grade fixed-income assets, primarily corporate and government bonds, as well as commercial mortgages and real estate.
The Great Depression and World War II (1926–1945)
The decade following 1926 tested the resilience of the entire American financial system. During the Great Depression, widespread bank failures and defaults placed unprecedented stress on financial institutions. While many stock companies and smaller insurers failed or suspended operations, major mutual life insurance companies demonstrated remarkable liquidity.
Although dividend scales were adjusted downward during the 1930s to reflect declining interest rates and economic distress, major mutual insurers continued to pay dividends. This period proved the value of conservative underwriting and robust reserve practices. Following the Depression, the mobilization of the economy during World War II introduced a period of heavily managed interest rates, during which mutual insurers maintained steady, albeit modest, dividend distributions.
The Post-War Boom and Inflationary Shifts (1946–1980)
The post-World War II era ushered in decades of economic expansion, rising interest rates, and shifting demographic patterns. As the economy grew, bond yields began a slow upward climb. Throughout the 1950s and 1960s, mutual whole life dividend scales experienced gradual increases.
By the late 1970s and early 1980s, the United States encountered unprecedented double-digit inflation and soaring interest rates. The yield on the benchmark 10-year U.S. Treasury note peaked near 15% in 1981. For mutual life insurers, this environment created a unique dynamic. While existing bond portfolios held lower-yielding securities purchased in previous decades, new money was invested at exceptionally high prevailing interest rates. Consequently, mutual whole life dividend interest rates reached historic highs during the early 1980s, with some major mutual companies posting dividend interest rates in excess of 10% to 12%.
The Low-Yield Era and Modern Stabilization (1981–2026)
Following the peak of inflation in the early 1980s, the macroeconomic landscape transitioned into a multi-decade secular decline in interest rates. Federal Reserve monetary policies, combined with global economic trends, drove bond yields down toward historic lows, culminating in near-zero interest rate policies following the 2008 financial crisis and the 2020 economic downturn.
During this prolonged low-yield environment, mutual life insurers steadily adjusted their dividend interest scales downward. Because dividend scales lag behind immediate market movements—owing to the buffering effect of massive, diversified general investment portfolios containing long-term bonds purchased at varying yields—whole life dividends did not plummet immediately when market interest rates dropped. Instead, they experienced a smooth, managed descent. By the mid-2020s, as interest rates began to normalize upward, mutual insurers demonstrated their capacity to stabilize and occasionally revise their dividend scales upward to reflect improving fixed-income returns.
Key Factors Influencing Mutual Whole Life Dividends
A century of data highlights three primary operational drivers that determine the size and consistency of mutual whole life dividends. Understanding these components helps policyholders contextualize historical figures and manage future expectations.
THREE PILLARS OF MUTUAL DIVIDENDS
| Component | Description |
|---|---|
| Investment Earnings | Net returns from bonds, mortgages, real estate, and private placements. |
| Mortality Experience | Savings realized when actual death claims are lower than actuarial tables. |
| Expense Management | Operational efficiencies and cost controls in administration and scaling. |
1. Investment Earnings (Net Investment Income)
Investment earnings represent the largest component of a mutual insurer's divisible surplus. The general account of a mutual company is heavily weighted toward high-quality fixed-income securities. The ability of an insurer to source high-grade private placements, maintain disciplined commercial real estate portfolios, and manage duration matching directly dictates the net investment income available for distribution.
2. Mortality Experience
Actuaries rely on standardized mortality tables to price life insurance policies. When medical advancements, public health improvements, and rigorous underwriting result in insured populations living longer than projected, the insurer collects premiums longer and delays the payout of death benefits. These favorable mortality gains contribute directly to the dividend pool.
3. Expense Control
Operating expenses include administrative overhead, technological infrastructure, agent commissions, and regulatory compliance costs. Efficient mutual companies with large blocks of business can spread fixed overhead across a broader base, reducing per-policy costs and freeing up additional capital for policyholder dividends.
Comparing Historical Dividend Interest Rates Across Eras
Evaluating dividend performance requires looking at how dividend interest rates have compared to broader economic benchmarks over time. The table below illustrates the directional movement of average mutual whole life dividend interest rates across key historical epochs, contrasted with prevailing economic indicators.
| Historical Epoch | Prevailing Economic Context | Average Mutual Dividend Interest Rate Range | Impact on Cash Value Growth |
|---|---|---|---|
| 1930–1945 | Great Depression & WWII; low yields, economic contraction. | 2.5% – 4.0% | Steady, conservative accumulation; capital preservation prioritized. |
| 1946–1970 | Post-war economic expansion; gradual rise in bond yields. | 3.5% – 5.5% | Moderate, predictable growth supporting long-term financial planning. |
| 1971–1985 | High inflation, oil shocks, peak interest rates in early 1980s. | 6.0% – 12.0%+ | Rapid cash value compounding driven by high new-money yields. |
| 1986–2007 | Secular decline in interest rates; globalization and economic stability. | 7.5% down to 5.0% | Gradual downward adjustment of scales; continued unbroken payment streaks. |
| 2008–2026 | Post-crisis era, historic low rates, quantitative easing, and normalization. | 5.0% down to 5.0% (stable) | Resilient performance despite ultra-low Treasury yields; buffering mechanisms active. |
Practical Applications and Policyholder Options
When policyholders receive dividends from a mutual whole life insurance policy, they are not restricted to taking a single form of payment. The historical flexibility of mutual policies allows owners to allocate dividends in several strategic ways, tailoring the policy to their evolving financial needs.
- Paid-Up Additions (PUA): This is the most common utilization for long-term wealth accumulation. Dividends are used to purchase small, single-premium increments of paid-up whole life insurance. Each PUA adds to both the total death benefit and the guaranteed cash value, creating a compounding engine that accelerates future dividend potential.
- Reduce Premium Payments: Policyholders can apply dividends directly toward offsetting their annual premium obligations. In mature policies with significant accumulated value, dividends may eventually cover the entire premium, resulting in a "vanishing premium" scenario where no out-of-pocket cash flow is required.
- Accumulate at Interest: Dividends can be left on deposit with the insurance company to earn a specified interest rate, functioning similarly to a high-yield savings account attached to the policy. These accumulated funds can be withdrawn tax-free up to the policy's cost basis.
- Cash Payments: Policyholders may elect to receive dividends as direct cash disbursements via check or electronic funds transfer. While taxable if distributions exceed the policy's cumulative cost basis (adjusted basis), this provides immediate liquidity.
Common Misconceptions Regarding Mutual Dividends
Analyzing a century of mutual whole life dividend histories often leads to several persistent misconceptions among prospective buyers and financial analysts.
Misconception 1: Dividends Are Guaranteed
A common error is confusing the guaranteed cash value growth of a whole life policy with the dividend scale. While the contractual guarantees are legally binding obligations backed by the reserves of the insurance company, dividends are declared annually by the board of trustees based on actual business performance. Top mutual companies have historical continuity spanning over a century of uninterrupted payouts, but past performance does not guarantee future distributions.
Misconception 2: Mutual Dividends Move Lockstep with the Federal Funds Rate
Some observers assume that when the Federal Reserve cuts or raises interest rates by a quarter point, mutual dividend interest rates immediately mirror that adjustment. In practice, because mutual insurers hold massive, diversified portfolios of long-term bonds purchased over decades, a single year of volatile interest rates causes only a fractional shift in the overall portfolio yield. This smoothing mechanism protects policyholders from wild annual fluctuations in cash value growth.
Misconception 3: All Life Insurance Dividends Are Identical
Consumers often treat whole life policies from stock-owned companies and mutual companies interchangeably. Stock companies that issue participating policies may distribute dividends, but their primary fiduciary duty is to maximize profits for external shareholders. Mutual companies, by contrast, distribute 100% of divisible surplus to participating policyholders after retaining necessary capital reserves for solvency.
Evaluating Long-Term Suitability and Next Actions
Reviewing one hundred years of mutual whole life dividend histories reveals a clear narrative: top-tier mutual insurers offer exceptional structural durability, capable of navigating profound economic transformations while preserving capital and delivering consistent returns. However, mutual whole life insurance is designed primarily as a long-term financial instrument, not a short-term yield play.
Individuals considering a participating whole life policy should evaluate the following steps to ensure alignment with their financial goals:
- Examine Financial Strength Ratings: Review current ratings from independent agencies such as AM Best, Moody's, Standard & Poor's, and Fitch to confirm the insurer's long-term financial stability.
- Review Historical Dividend Consistency: Request historical dividend performance illustrations and check the insurer's actual historical dividend interest rate record over the past 30 to 50 years.
- Analyze Policy Design: Work with a specialized fiduciary or insurance professional to structure the policy properly—often utilizing paid-up addition riders—to maximize long-term cash value efficiency rather than immediate death benefit exposure.