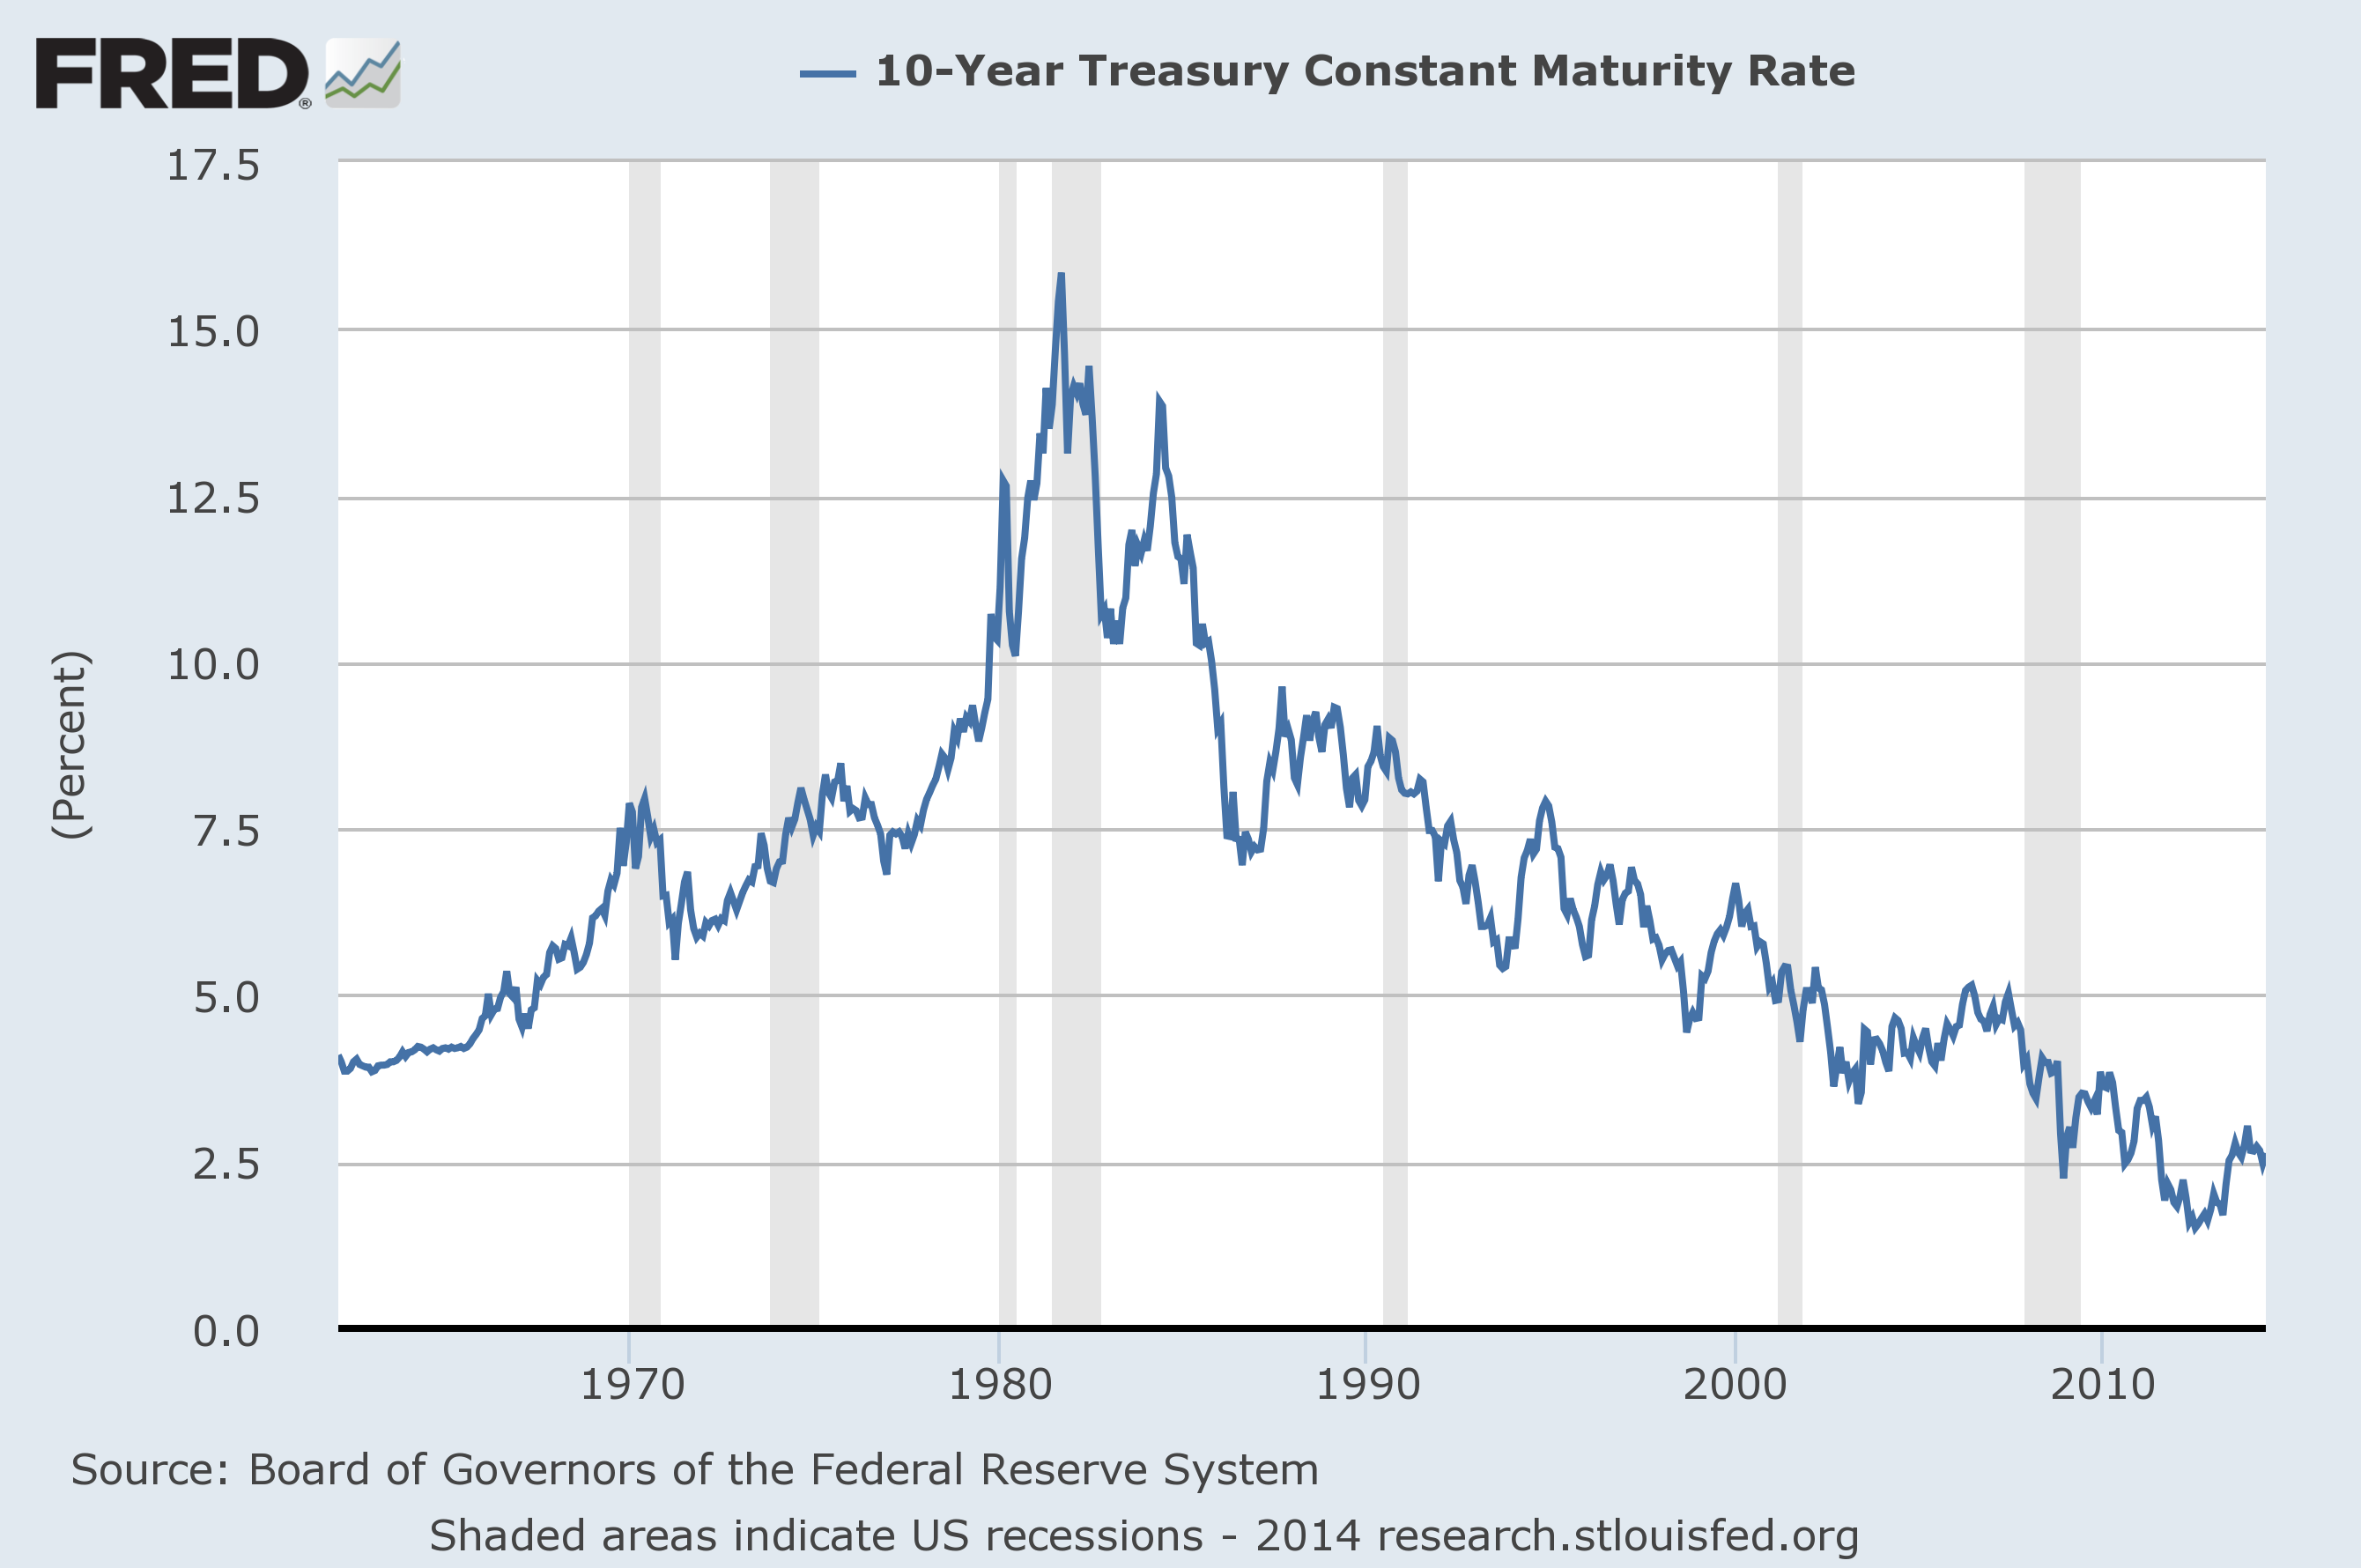
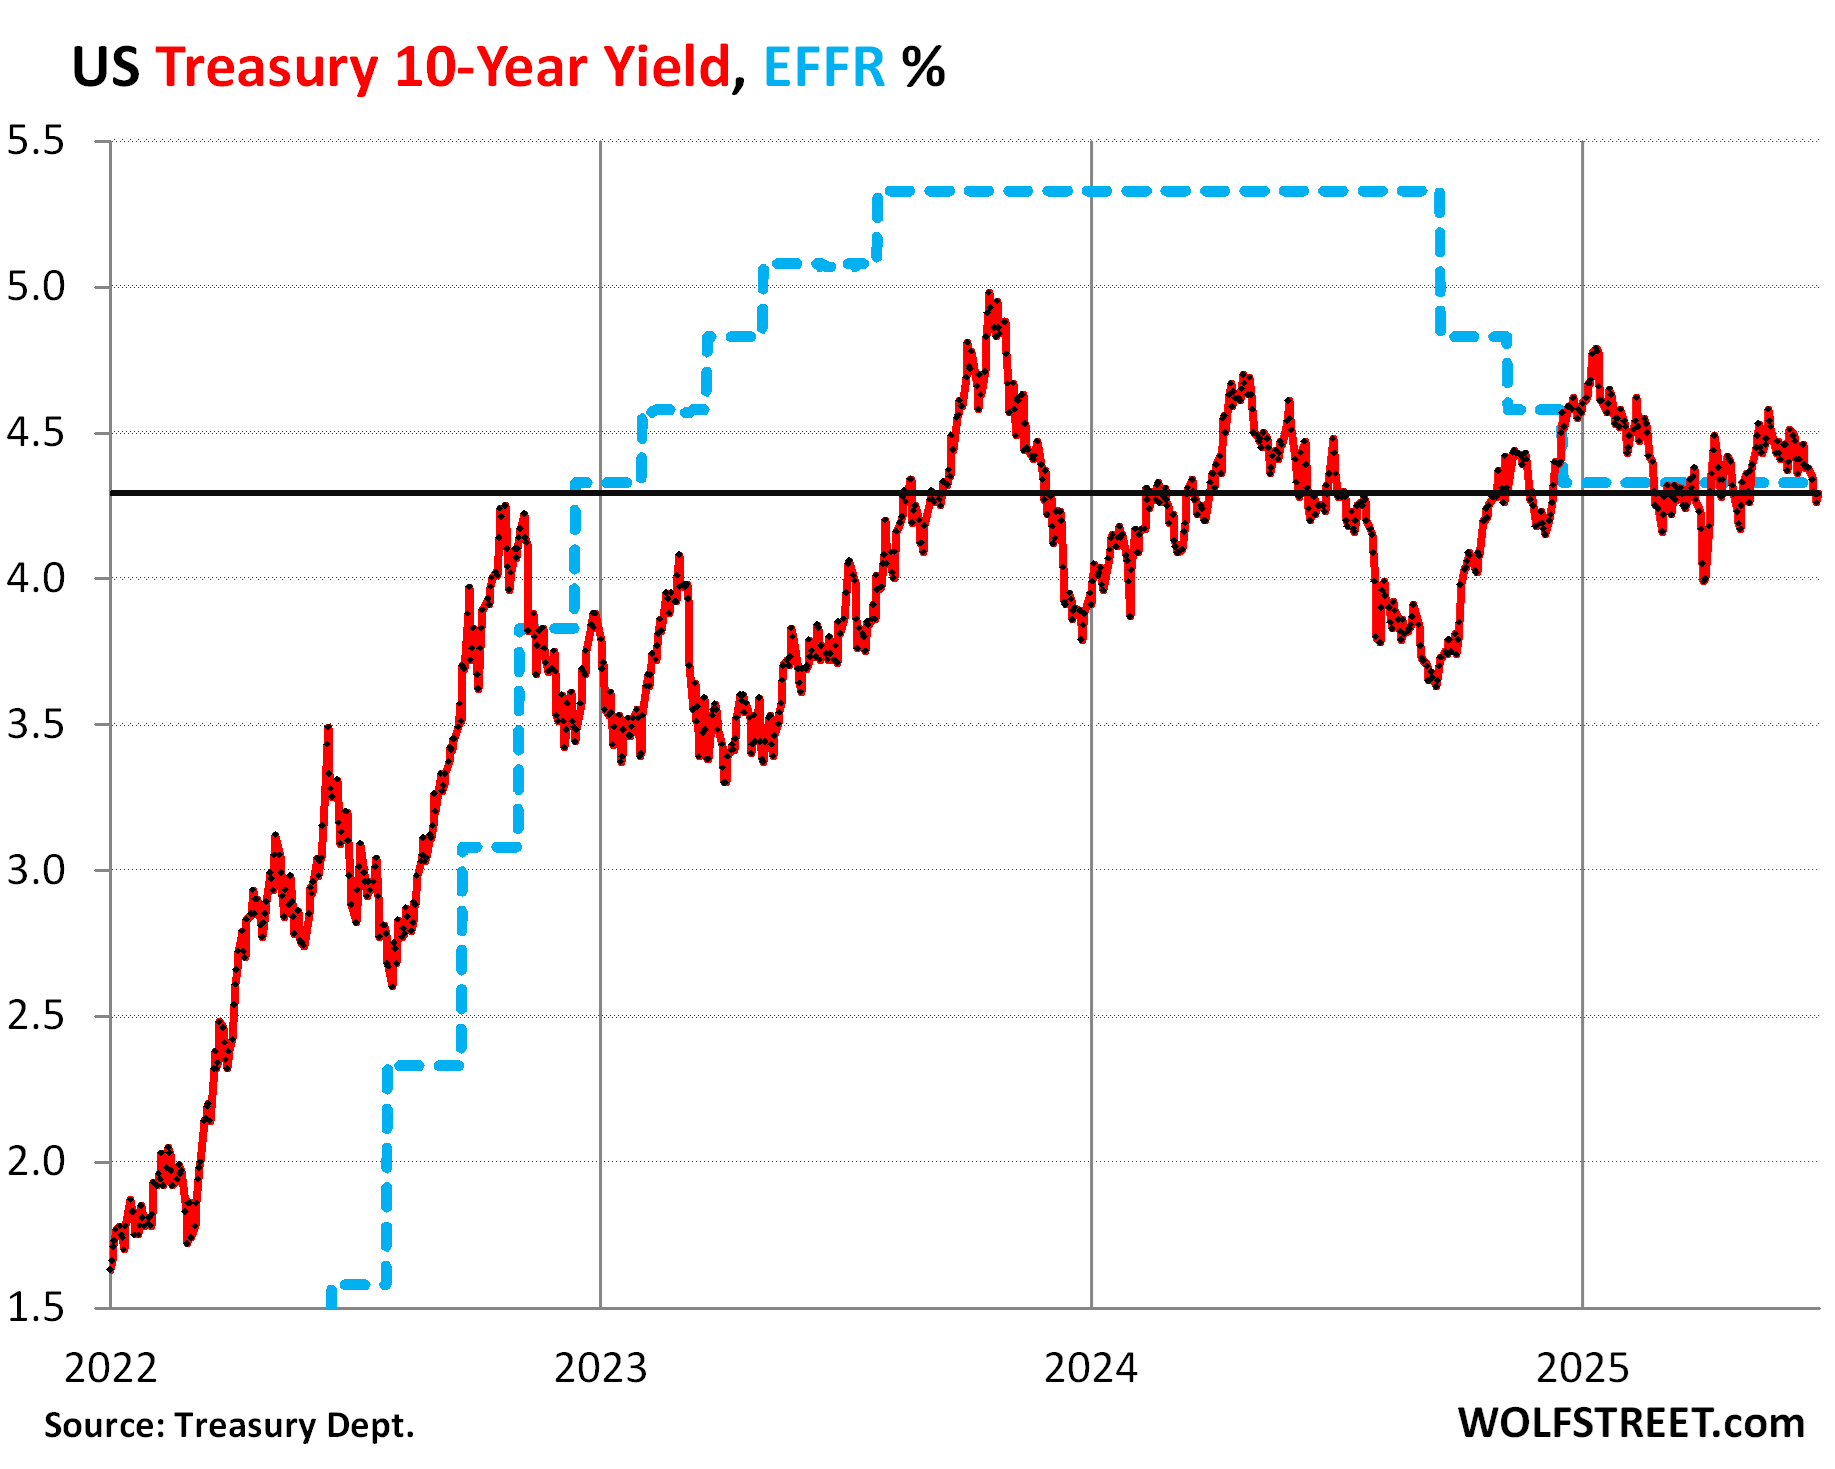
The 10-year Treasury bond rate is the annualized yield investors receive for purchasing a 10-year debt obligation issued by the United States government. It serves as a foundational benchmark for global financial markets, directly influencing consumer borrowing costs like mortgages, corporate debt pricing, and broader macroeconomic expectations.
What is the 10-Year U.S. Treasury Bond?
To understand the rate, one must first understand the instrument itself. A 10-year Treasury note—frequently referred to interchangeably as a bond in casual financial discourse, though technically a note due to its original maturity falling between 1 and 10 years—is a fixed-income security backed by the full faith and credit of the U.S. government. When the Department of the Treasury issues these securities to finance public debt, investors purchase them at auction.
The security has two primary financial components:
- The Face Value (Par Value): The amount the government agrees to pay the holder when the security matures (typically $1,000).
- The Coupon Rate: The fixed annual interest rate the government pays the holder, expressed as a percentage of the face value, paid out semi-annually.
However, once issued, these securities trade on the secondary market. Because market demand fluctuates, the price of an existing 10-year Treasury constantly rises and falls. This introduces the crucial financial mechanism that governs all fixed-income assets: bond prices and yields move in opposite directions.
How the 10-Year Treasury Yield is Calculated
The "rate" that financial media reports daily is not the fixed coupon rate stamped onto the note at issuance. It is the yield to maturity (YTM). The YTM is the total annualized return an investor can expect if they buy the bond at the current market price and hold it until it matures in 10 years, accounting for both the remaining coupon payments and any capital gain or loss realized upon maturity.
The Inverse Relationship Between Price and Yield
Consider a simplified example to illustrate this inverse relationship:
- The U.S. Treasury issues a 10-year note with a face value of $1,000 and a fixed coupon rate of 4%, meaning it pays $40 per year.
- If economic conditions change and investors demand a higher return, they will sell off existing bonds, driving market prices down.
- If the market price drops to $900, a new buyer still receives the same $40 annual payment, but they paid less to acquire it.
- Consequently, their effective yield rises above 4% (specifically, $40 / $900 = 4.44%).
Conversely, if high demand pushes the market price up to $1,100, the $40 annual payment represents a smaller percentage of the purchase price, driving the yield down ($40 / $1100 = 3.63%). This fundamental mechanic explains why treasury rates shift daily, reacting in real time to economic sentiment.
Why the 10-Year Yield Matters So Much
Financial analysts often call the 10-year Treasury rate the "anchor of the global financial system." Its influence extends far beyond government financing, directly touching consumer wallets and commercial balance sheets.
1. Benchmark for Consumer Loans
The 10-year Treasury yield is the primary pricing benchmark for long-term consumer debt, most notably 30-year fixed-rate mortgages. Lenders do not tie mortgages directly to the Federal Reserve's short-term federal funds rate. Instead, mortgage originators look to the 10-year Treasury yield to gauge long-term inflation and interest rate expectations. When the 10-year yield rises, mortgage rates almost invariably climb alongside it, altering housing affordability across the nation.
2. Corporate Financing and Valuations
Corporations rely on the 10-year yield as a risk-free baseline when issuing corporate bonds or securing bank loans. Furthermore, in equity markets, analysts use the 10-year yield as the "risk-free rate" within discount cash flow (DCF) models. When the 10-year yield rises, the discount rate applied to future corporate earnings increases, which mathematically reduces the present value of stocks—frequently triggering downward pressure on growth and tech equities.
3. Economic Indicator and Recession Signaler
Because the 10-year yield reflects long-term economic outlooks over a decade, it is often compared against short-term rates (like the 2-year Treasury yield or 3-month Treasury bill) to measure the health of the economy. A normal yield curve slopes upward, meaning long-term rates are higher than short-term rates, reflecting healthy economic expansion and expected inflation.
When short-term rates exceed long-term rates—known as an inverted yield curve—it historically signals that investors anticipate an economic slowdown or recession.
Key Drivers Behind Fluctuations in the 10-Year Rate
Market participants constantly evaluate a complex mix of macroeconomic data, monetary policy decisions, and geopolitical events to price 10-year Treasury notes. The primary drivers include:
- Inflation Expectations: Inflation erodes the purchasing power of fixed future cash flows. If investors expect higher inflation over the next decade, they demand a higher yield to compensate for that loss, driving rates up.
- Federal Reserve Monetary Policy: While the Fed directly controls short-term interest rates via the federal funds rate, its policy pronouncements, quantitative tightening (QT), or quantitative easing (QE) programs heavily influence the supply and demand dynamics of long-term bonds.
- Economic Growth and Employment Data: Strong jobs reports, robust retail sales, and high GDP growth suggest an expanding economy, which typically pushes bond prices down and yields up. Weaker data prompts "safe-haven" buying, pushing bond prices up and yields down.
- Global Capital Flows and Geopolitical Risk: During international crises or financial market turbulence, global investors frequently flock to U.S. government debt as a secure haven of liquidity. This massive surge in demand drives bond prices up and yields down, sometimes counteracting domestic economic indicators.
Comparing Short-Term and Long-Term Treasuries
To better grasp where the 10-year note sits within the broader sovereign debt market, consider how it compares against other maturities issued by the U.S. Department of the Treasury.
| Maturity Type | Common Instrument Name | Primary Market Function | Sensitivity to Fed Rate Changes |
|---|---|---|---|
| Short-Term (4 weeks to 1 year) | Treasury Bills (T-Bills) | Liquidity management, cash storage, short-term cash flow. | Very High (Moves lockstep with the federal funds rate). |
| Medium-Term (2 to 10 years) | Treasury Notes (T-Notes) | Intermediate government financing; benchmark for consumer credit. | Moderate (Balances current Fed policy with medium-term outlooks). |
| Long-Term (20 to 30 years) | Treasury Bonds (T-Bonds) | Long-term institutional planning, pension fund matching, long-horizon inflation gauge. | Low to Moderate (Driven primarily by long-term inflation and structural economic shifts). |
Frequently Asked Questions
Does the Federal Reserve directly set the 10-year Treasury rate?
No. The Federal Reserve directly controls only the federal funds rate, which is an overnight lending rate for commercial banks. The 10-year Treasury rate is determined entirely by market supply and demand on the secondary market. However, Fed policy actions and forward guidance heavily influence investor expectations, which indirectly move the 10-year yield.
What happens to my existing 10-year Treasury note if market rates go up?
If you hold your Treasury note until its 10-year maturity, market rate fluctuations do not affect your regular semi-annual coupon payments, and you will receive your full principal back. However, if you sell the note on the secondary market before maturity while rates are higher than when you bought it, you will likely realize a capital loss.
Why do mortgage rates track the 10-year Treasury instead of the Fed rate?
Mortgage investors purchase mortgage-backed securities (MBS) that typically span 15 to 30 years. Because these investments have a long duration, investors demand a yield benchmark that matches a similar long-term horizon—the 10-year Treasury yield—rather than an overnight rate that could change drastically next month.
Is a 10-year Treasury investment completely risk-free?
It is considered free of default risk because the U.S. government has the authority to print currency to pay its debts. However, it carries significant interest rate risk (the risk that market values drop if rates rise) and inflation risk (the risk that fixed payouts lose purchasing power over time).
Conclusion and Next Actions
The 10-year Treasury bond rate is far more than a technical figure for institutional traders; it is the vital barometer measuring the health, inflation outlook, and borrowing costs of the broader economy. Whether you are shopping for a mortgage, analyzing corporate stock valuations, or structuring a personal fixed-income portfolio, keeping an eye on how this benchmark shifts provides critical insight into the direction of financial markets. To apply this knowledge, monitor daily macroeconomic releases—such as the Consumer Price Index (CPI) and non-farm payroll reports—to anticipate how bond yields and subsequent consumer borrowing costs are likely to react.