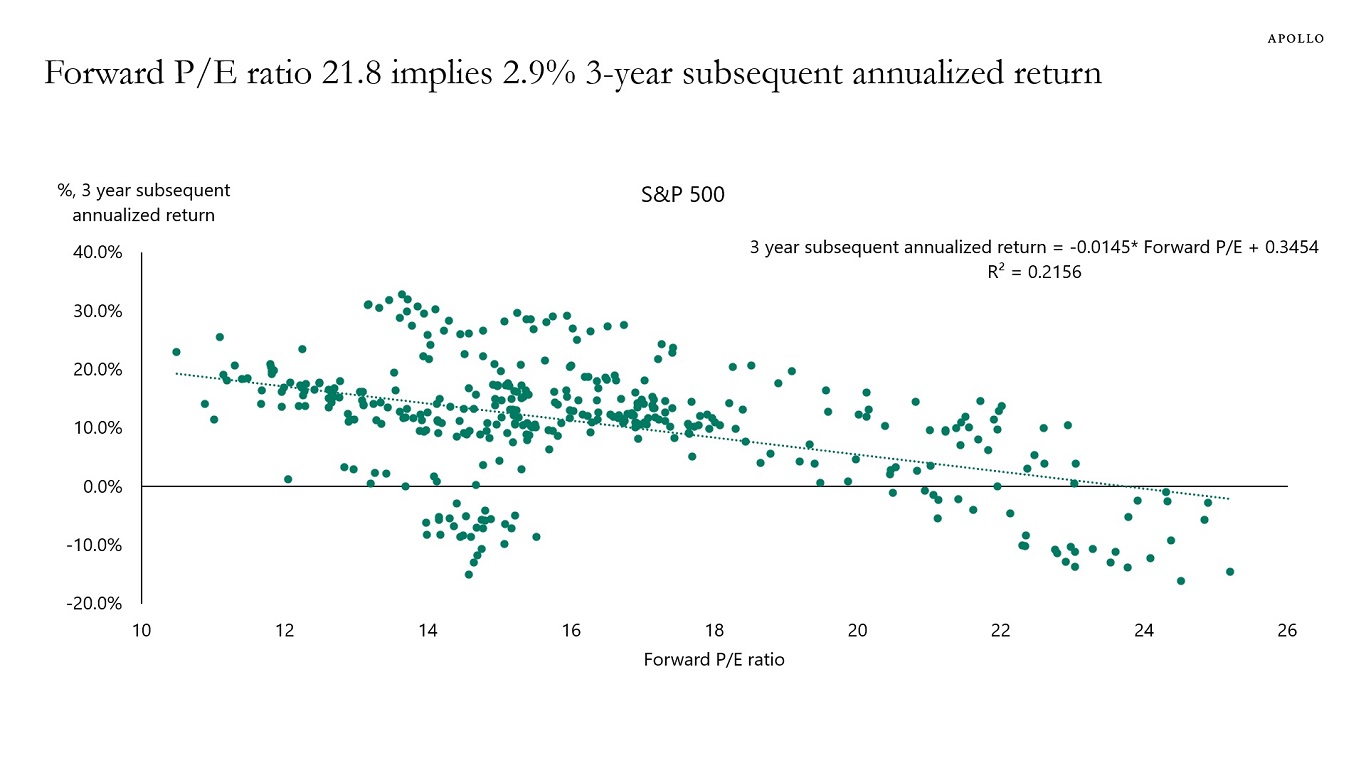
The S&P 500 concluded 2024 with a robust performance, underscoring its role as a primary benchmark for the broader U.S. equity market. Investors reviewing the calendar year 2024 often analyze it through the lens of historical volatility and long-term compounding, noting how the index navigated macroeconomic shifts, interest rate adjustments, and corporate earnings cycles to deliver significant year-end gains.
Understanding the S&P 500 as a Market Benchmark
The Standard & Poor’s 500, commonly known as the S&P 500, is a stock market index tracking the stock performance of 500 of the largest companies listed on exchanges in the United States. It is widely regarded as the best single gauge of large-cap U.S. equities. Because it is market-capitalization-weighted, larger companies have a more significant impact on the index’s daily fluctuations than smaller companies.
When analysts and investors discuss the "returns by year," they are looking at the total return, which includes both the change in the index’s price and the reinvestment of dividends paid by the constituent companies. This distinction is vital; price return accounts only for the movement of the stock prices, while total return provides a more accurate picture of the actual wealth generated for a shareholder over a specific timeframe.
The 2024 Market Environment: A Retrospective
To interpret the returns of 2024, one must recall the specific economic conditions that defined the year. By mid-2024, the U.S. economy faced a complex environment characterized by high but cooling inflation, the anticipation of interest rate shifts by the Federal Reserve, and a significant boom in artificial intelligence-related infrastructure and software development.
The market’s 2024 trajectory was largely driven by a handful of mega-cap technology companies. This concentration of returns is a recurring theme in recent market history. When a small number of stocks disproportionately drive the index's performance, it creates a unique risk-reward profile for diversified investors. In 2024, these factors culminated in a strong double-digit positive return, providing a sharp contrast to more volatile years in the recent past, such as the downturn observed in 2022.
Historical Performance Context
Comparing 2024 to previous years helps contextualize what "normal" market behavior looks like. The S&P 500 does not move in a straight line. History shows that for every year of double-digit gains, there have been years of stagnation or negative returns. Investors use these historical figures to calibrate their expectations for volatility and to understand the importance of time in the market.
| Period | Market Context | Result Summary |
|---|---|---|
| 2022 | High Inflation / Rate Hikes | Significant Correction |
| 2023 | Tech Recovery / AI Enthusiasm | Strong Rebound |
| 2024 | Sustained Growth / Cooling Inflation | Continued Bull Market |
The table above illustrates the cyclical nature of equities. The recovery that began in 2023 carried substantial momentum into 2024, proving that market sentiment can shift rapidly based on macroeconomic data points like the Consumer Price Index (CPI) and employment reports.
Key Drivers of 2024 Returns
The 2024 performance was not uniform across all sectors. While technology and communication services led the charge, other sectors, such as utilities and financials, showed varying degrees of sensitivity to the interest rate environment. Understanding these drivers is essential for any investor attempting to build a portfolio that can withstand shifting market cycles.
- Monetary Policy Influence: The market spent much of 2024 analyzing the "pivot" in Federal Reserve policy. As expectations for rate cuts solidified, the cost of capital for growth-oriented companies decreased, bolstering valuations.
- Corporate Earnings Resilience: Despite concerns over an economic slowdown, the 500 companies in the index generally maintained profit margins better than many analysts initially projected at the start of the year.
- The AI Catalyst: The capital expenditure cycle initiated by major technology firms regarding artificial intelligence infrastructure provided a tangible revenue tailwind that sustained investor confidence throughout the four quarters of 2024.
The Role of Dividends in Total Return
A significant component of the S&P 500's long-term performance is the contribution of dividends. While price appreciation captures the public's attention, dividends often account for a substantial percentage of the index's total return over multi-decade periods. In 2024, while dividend yields were modest in comparison to historical peaks, the sheer volume of dividend payouts from established blue-chip constituents contributed meaningfully to the total returns realized by index funds and ETFs.
Investors should remember that the S&P 500 is a rebalanced index. Companies that fail to meet size or liquidity requirements are removed, and new, growing companies are added. This "self-cleansing" mechanism is one reason the index has historically trended upward, as it inherently favors the survivors and leaders of the economic landscape.
Common Pitfalls for Investors Analyzing Yearly Returns
One of the most frequent errors investors make when reviewing a year like 2024 is the assumption that recent performance predicts the future. Known as "recency bias," this psychological phenomenon leads individuals to overweight the importance of the most recent 12 to 24 months.
- Ignoring Drawdowns: Even in a year with strong annual returns, there are usually intra-year pullbacks. Looking only at the year-end closing price hides the temporary losses that investors had to endure to reach that point.
- Over-concentration: Focusing solely on the top performers of 2024 can lead to a false sense of security or a desire to "chase" performance in asset classes that may already be fully valued.
- Ignoring Taxes: For taxable accounts, the turnover or distribution of dividends within an index fund or ETF in 2024 has real-world consequences that are not captured in simple price-return charts.
Strategies for Long-Term Index Exposure
Given the volatility seen in years preceding and following 2024, most financial advisors emphasize a strategy of consistent, long-term exposure rather than active trading. By maintaining an investment in low-cost index funds that track the S&P 500, investors capture the market return without the need to time the entry or exit points of the index.
In 2026, as we reflect on the performance of 2024, the primary lesson remains the same: the market rewards patience. Those who remained invested during the uncertainty of previous years were rewarded by the recovery and subsequent growth of 2024. Building a "core" portfolio that relies on index-based exposure provides a foundation that can be supplemented by other asset classes based on individual risk tolerance and financial goals.
Frequently Asked Questions
Does the S&P 500 return include dividends? Yes, when referencing "total return," the calculation includes both the price appreciation of the constituent stocks and the dividends paid out by those companies, assuming those dividends are reinvested into the index.
How does 2024 compare to the average annual return of the S&P 500? The S&P 500 has historically returned approximately 10% annually over long periods. 2024 outperformed this long-term average, which is a common occurrence in bull market years, following the pattern of the index spending much of its time in either significantly higher or lower territory than the mean.
Is it safe to assume 2024 performance will repeat in the future? Market history indicates that future performance is never guaranteed. Annual returns are highly volatile and influenced by unpredictable variables, including geopolitical events, regulatory changes, and corporate performance shifts. Investors should use historical data as a guide for potential range, not as a prediction of future results.
How can I verify the specific returns of the S&P 500 for a single year? You can verify annual performance figures through official investor relations portals or the data provided by S&P Dow Jones Indices. These sources provide the most accurate, audited historical data for both price and total return metrics.
What is the difference between price return and total return? Price return only measures the change in the index’s market value. Total return adds the impact of reinvested dividends. For an accurate assessment of growth in wealth, total return is the standard metric used by finance professionals.
Next Steps for Your Portfolio
To apply the lessons of 2024, begin by auditing your current asset allocation. If your portfolio became heavily concentrated in one sector during the market run-up of 2024, consider whether rebalancing is necessary to maintain your target risk profile. Ensure that you are prioritizing long-term goals over short-term market reactions. Consult with a qualified financial advisor to discuss how your specific investment timeline aligns with the historical volatility and expected returns of broad-market indices. Always conduct your own research or seek professional guidance before making significant changes to your investment strategy, as individual tax and financial circumstances vary widely.