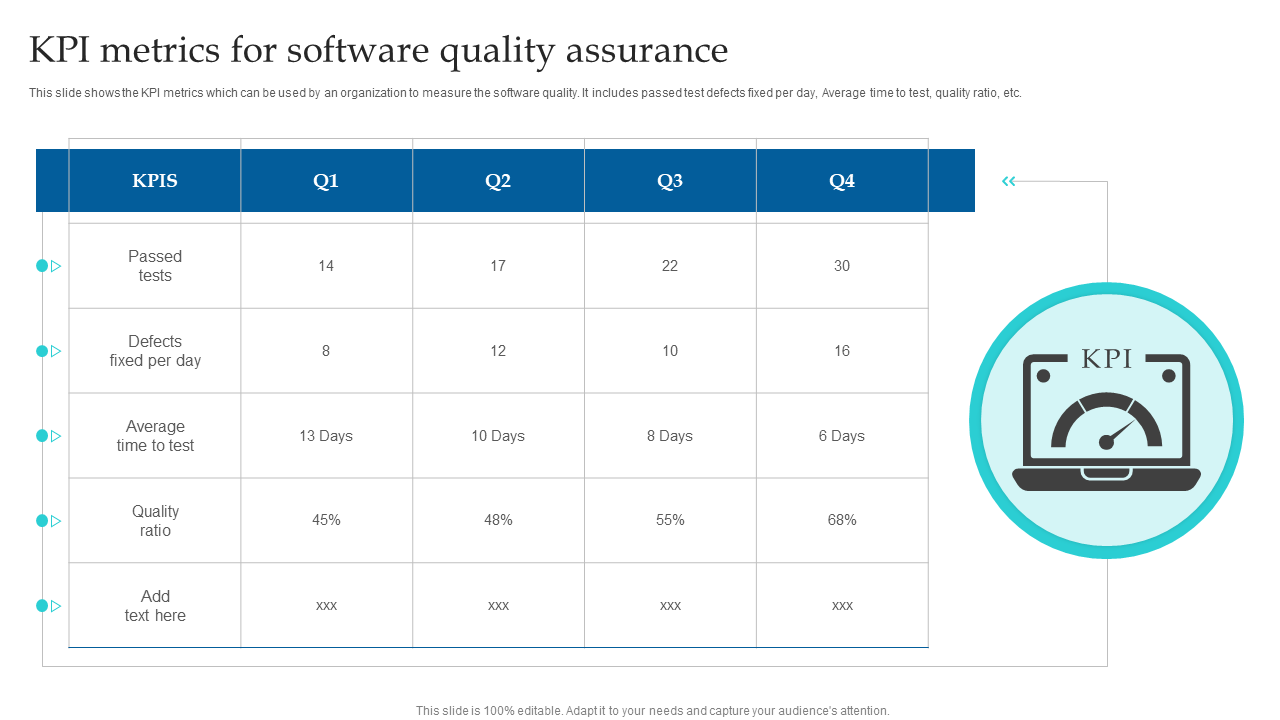
Measuring business performance effectively requires tracking specific Key Performance Indicators (KPIs) and operational metrics that align with financial health, customer satisfaction, and internal efficiency. Without structured measurement, organizations risk operating blindly, making strategic decisions based on intuition rather than empirical data. This guide explores five critical KPI and metric examples that businesses across various industries use to monitor growth, evaluate operational execution, and drive long-term profitability.
The Strategic Importance of Key Performance Indicators and Metrics
Before exploring specific examples, it is essential to distinguish between a metric and a Key Performance Indicator. While all KPIs are metrics, not all metrics are KPIs. A metric is simply a quantifiable measurement used to track and assess the status of a specific business process. A KPI, on the other hand, is a targeted, high-level metric that directly reflects the critical success factors of an organization.
When establishing a performance measurement framework, businesses must avoid the trap of "vanity metrics"—data points that look impressive on paper, such as total website page views or social media follower counts, but fail to correlate with actual revenue growth, customer retention, or operational efficiency. Effective performance indicators provide actionable insights, allowing management teams to diagnose problems, allocate resources efficiently, and pivot strategies before minor issues compound into systemic failures.
Furthermore, integrating performance measurement into daily operations fosters a culture of accountability. Employees and department heads who understand how their daily tasks influence high-level company goals are better equipped to optimize workflows. Establishing a balanced scorecard—evaluating financial, customer, internal process, and learning perspectives—ensures that organizations do not hyper-focus on short-term profits at the expense of long-term sustainability.
1. Net Profit Margin: Assessing Bottom-Line Financial Health
Financial metrics form the bedrock of corporate evaluation, and Net Profit Margin stands out as one of the most comprehensive indicators of a company's financial viability. This metric calculates the percentage of revenue that remains as net income after all operating expenses, interest, taxes, and preferred stock dividends have been deducted from total revenue.
Formula and Calculation
Net Profit Margin is calculated using the following formula:
$$\text{Net Profit Margin} = \left( \frac{\text{Net Income}}{\text{Total Revenue}} \right) \times 100$$
For example, if a business generates $1,000,000 in total revenue over a fiscal year and incurs $800,000 in total expenses, its net income is $200,000. The net profit margin would be 20 percent.
Operational Implications and Benchmarks
A high net profit margin indicates that a business is efficient at converting sales into actual profit, possessing strong pricing power, effective cost containment, or both. Conversely, a declining margin signals rising overhead costs, pricing pressures from competitors, or inefficiencies in production and delivery.
Because profit margins vary wildly across industries—software companies often enjoy high margins, whereas grocery retailers operate on razor-thin margins—business leaders must benchmark their figures against direct industry competitors rather than arbitrary macroeconomic standards. Tracking net profit margin over monthly, quarterly, and annual periods allows executive leadership to spot margin erosion early and implement necessary cost-cutting or revenue-enhancement measures.
2. Customer Acquisition Cost (CAC): Measuring Marketing and Sales Efficiency
Acquiring new customers requires capital expenditure across marketing campaigns, sales salaries, software subscriptions, and promotional materials. Customer Acquisition Cost (CAC) quantifies the total economic cost required to acquire a single paying customer over a specified period.
Formula and Calculation
To calculate CAC, businesses divide the total costs associated with acquisition by the total number of new customers acquired within the same timeframe:
$$\text{CAC} = \frac{\text{Total Sales and Marketing Expenses}}{\text{Number of New Customers Acquired}}$$
For instance, if a company spends $50,000 on marketing and sales in a month and successfully acquires 500 new customers, the CAC is $100 per customer.
Strategic Nuances and Optimization
Understanding CAC is crucial for unit economics. If a company spends more to acquire a customer than that customer generates in lifetime value, the business model is fundamentally unsustainable. CAC must be analyzed alongside Customer Lifetime Value (LTV). A healthy business generally targets an LTV-to-CAC ratio of 3:1 or higher, meaning the value derived from a customer is triple the cost of acquiring them.
Common pitfalls in calculating CAC include omitting hidden overhead costs, such as a pro-rata share of employee benefits, software tools utilized exclusively by the sales team, or agency retainer fees. By accurately capturing all acquisition expenditures, marketing leaders can optimize channel performance, shifting budget away from underperforming ad networks toward high-converting acquisition funnels.
3. Customer Lifetime Value (LTV): Evaluating Long-Term Customer Worth
While CAC measures the upfront investment required for growth, Customer Lifetime Value (LTV) predicts the total net profit a business can expect to generate from a single customer throughout their entire relationship with the brand. This metric shifts focus from transactional, one-off sales to long-term relationship building and retention.
Formula and Calculation
A standard formulation for LTV incorporates average purchase value, purchase frequency, and customer lifespan:
$$\text{LTV} = (\text{Average Purchase Value} \times \text{Purchase Frequency}) \times \text{Average Customer Lifespan}$$
For subscription-based businesses, LTV is often calculated by dividing the Average Revenue Per Account (ARPA) by the Customer Churn Rate.
Balancing LTV and CAC
High LTV allows businesses to absorb higher acquisition costs while remaining profitable. If a company knows its customers will stay subscribed for an average of three years and generate $1,500 in gross margin, spending $300 to acquire each customer represents a highly lucrative investment.
To improve LTV, organizations must invest in customer success programs, loyalty incentives, cross-selling strategies, and product enhancements that reduce churn. Tracking cohort-based LTV helps product and marketing teams identify which customer segments yield the highest long-term returns, allowing for more targeted targeting and resource allocation.
4. Employee Turnover Rate: Monitoring Internal Stability and Culture
Operational metrics extend beyond financial statements and sales pipelines to encompass human capital. Employee Turnover Rate measures the percentage of employees who leave an organization over a specific period, requiring replacement. Human resources and executive leadership monitor this metric closely because high turnover directly impacts productivity, institutional knowledge, and recruitment expenditures.
Formula and Calculation
The formula for calculating employee turnover rate is:
$$\text{Turnover Rate} = \left( \frac{\text{Number of Separations during Period}}{\text{Average Number of Employees}} \right) \times 100$$
For example, if an organization averages 200 employees over a year and experiences 30 departures, the annual turnover rate is 15 percent.
Financial Impact and Root Cause Analysis
Replacing an employee involves multiple hidden costs, including recruitment advertising fees, interviewing time, lost productivity during the vacancy period, and onboarding expenses for new hires. Studies across various sectors suggest that replacing a salaried employee can cost anywhere from a fraction of their annual salary to over 150 percent for specialized technical or executive roles.
A spiking turnover rate serves as an early warning indicator of cultural friction, inadequate compensation packages, poor management practices, or limited career progression opportunities. Conducting structured exit interviews and regular employee engagement surveys helps human resources teams isolate the root causes of attrition and implement corrective retention strategies before valuable talent departs.
5. Inventory Turnover Ratio: Optimizing Supply Chain and Working Capital
For businesses that manufacture, distribute, or retail physical goods, inventory represents tied-up capital. The Inventory Turnover Ratio measures how many times a company sells and replaces its stock of goods over a given period. It serves as a primary indicator of supply chain efficiency, demand forecasting accuracy, and liquidity.
Formula and Calculation
The inventory turnover ratio is calculated by dividing the cost of goods sold (COGS) by the average inventory for the period:
$$\text{Inventory Turnover Ratio} = \frac{\text{Cost of Goods Sold (COGS)}}{\text{Average Inventory}}$$
$$\text{Average Inventory} = \frac{\text{Beginning Inventory} + \text{Ending Inventory}}{2}$$
For instance, if a company has an annual COGS of $500,000 and an average inventory value of $100,000, its inventory turnover ratio is 5. This means the company sold and replaced its entire stock five times during the year.
Evaluating Efficiency and Liquidity
A high inventory turnover ratio indicates strong sales velocity and efficient inventory management, meaning capital is not trapped in stagnant warehouses. However, an excessively high ratio can also signal understocking, leading to stockouts, lost sales revenue, and disappointed customers.
Conversely, a low inventory turnover ratio points to overstocking, obsolete merchandise, or weak demand. Stagnant inventory incurs warehousing costs, ties up cash flow that could otherwise be deployed toward growth initiatives, and risks inventory degradation or spoilage. Supply chain managers use this metric alongside Days Sales of Inventory (DSI) to fine-tune purchasing schedules and optimize warehouse operations.
Comparative Overview of Business KPIs and Metrics
| KPI / Metric Name | Primary Category | Core Purpose | Typical Target / Benchmark | Common Pitfall |
|---|---|---|---|---|
| Net Profit Margin | Financial | Measures overall profitability per dollar of revenue. | Varies by industry (e.g., 10%–20% general baseline). | Ignoring non-operating expenses or seasonal fluctuations. |
| Customer Acquisition Cost (CAC) | Sales & Marketing | Calculates total expense required to acquire a paying customer. | Maintain a healthy 3:1 LTV-to-CAC ratio. | Omitting overhead, software, or personnel costs. |
| Customer Lifetime Value (LTV) | Customer Success | Predicts total net revenue generated per customer relationship. | Significantly higher than CAC over customer lifespan. | Assuming historical churn rates remain static indefinitely. |
| Employee Turnover Rate | Human Resources | Tracks the rate at which employees leave the organization. | Varies by sector (lower is generally more stable). | Failing to account for the true cost of lost productivity. |
| Inventory Turnover Ratio | Operations / Supply Chain | Evaluates how quickly stock is sold and replaced. | Higher turnover without triggering stockouts. | Overcorrecting low turnover and causing frequent stockouts. |
Frequently Asked Questions About Business KPIs
How many KPIs should a business track at one time?
Most management experts recommend tracking between 4 and 10 core KPIs at the executive level. Tracking too many indicators leads to "dashboard fatigue," where critical trends become obscured by noise. Operational departments may track additional sub-metrics, but executive dashboards should focus exclusively on high-impact drivers of business strategy.
What is the difference between leading and lagging indicators?
Lagging indicators, such as net profit margin or annual revenue, measure the results of past actions and historical performance. Leading indicators, such as customer acquisition cost or employee engagement scores, predict future performance and trends. A balanced measurement framework incorporates both types to enable reactive problem-solving and proactive strategic planning.
How often should business metrics be reviewed?
Review frequency depends on the specific metric and operational velocity. Financial metrics like net profit margin are typically reviewed monthly and quarterly. High-velocity metrics, such as website conversion rates or daily sales call volumes, may be reviewed daily or weekly to catch operational anomalies early.
Can small businesses use enterprise-grade KPI frameworks?
Yes. Scaled-down versions of standard KPI frameworks are vital for small businesses and startups. Tracking basic financial margins, cash flow runway, and customer acquisition efficiency helps early-stage enterprises conserve capital and achieve product-market fit faster without requiring complex enterprise resource planning (ERP) software.
How do we handle KPIs when business models shift?
When a business pivots its strategy—such as transitioning from a one-time product sale model to a recurring subscription model—its KPI framework must evolve simultaneously. Outdated metrics like total unit sales must be replaced or supplemented by recurring revenue metrics like Monthly Recurring Revenue (MRR) and net revenue retention to accurately reflect the new business model.
Next Steps for Implementing Performance Measurement
Implementing an effective KPI framework requires moving beyond data collection to actionable decision-making. Begin by auditing your existing reporting tools to ensure data integrity and automated tracking where possible. Next, align department heads around a unified set of company-wide goals, ensuring every team understands which metrics they directly influence. Establish regular review cadences—such as monthly operational meetings and quarterly strategic reviews—to analyze trends, adjust targets, and continuously optimize performance across all levels of the organization.