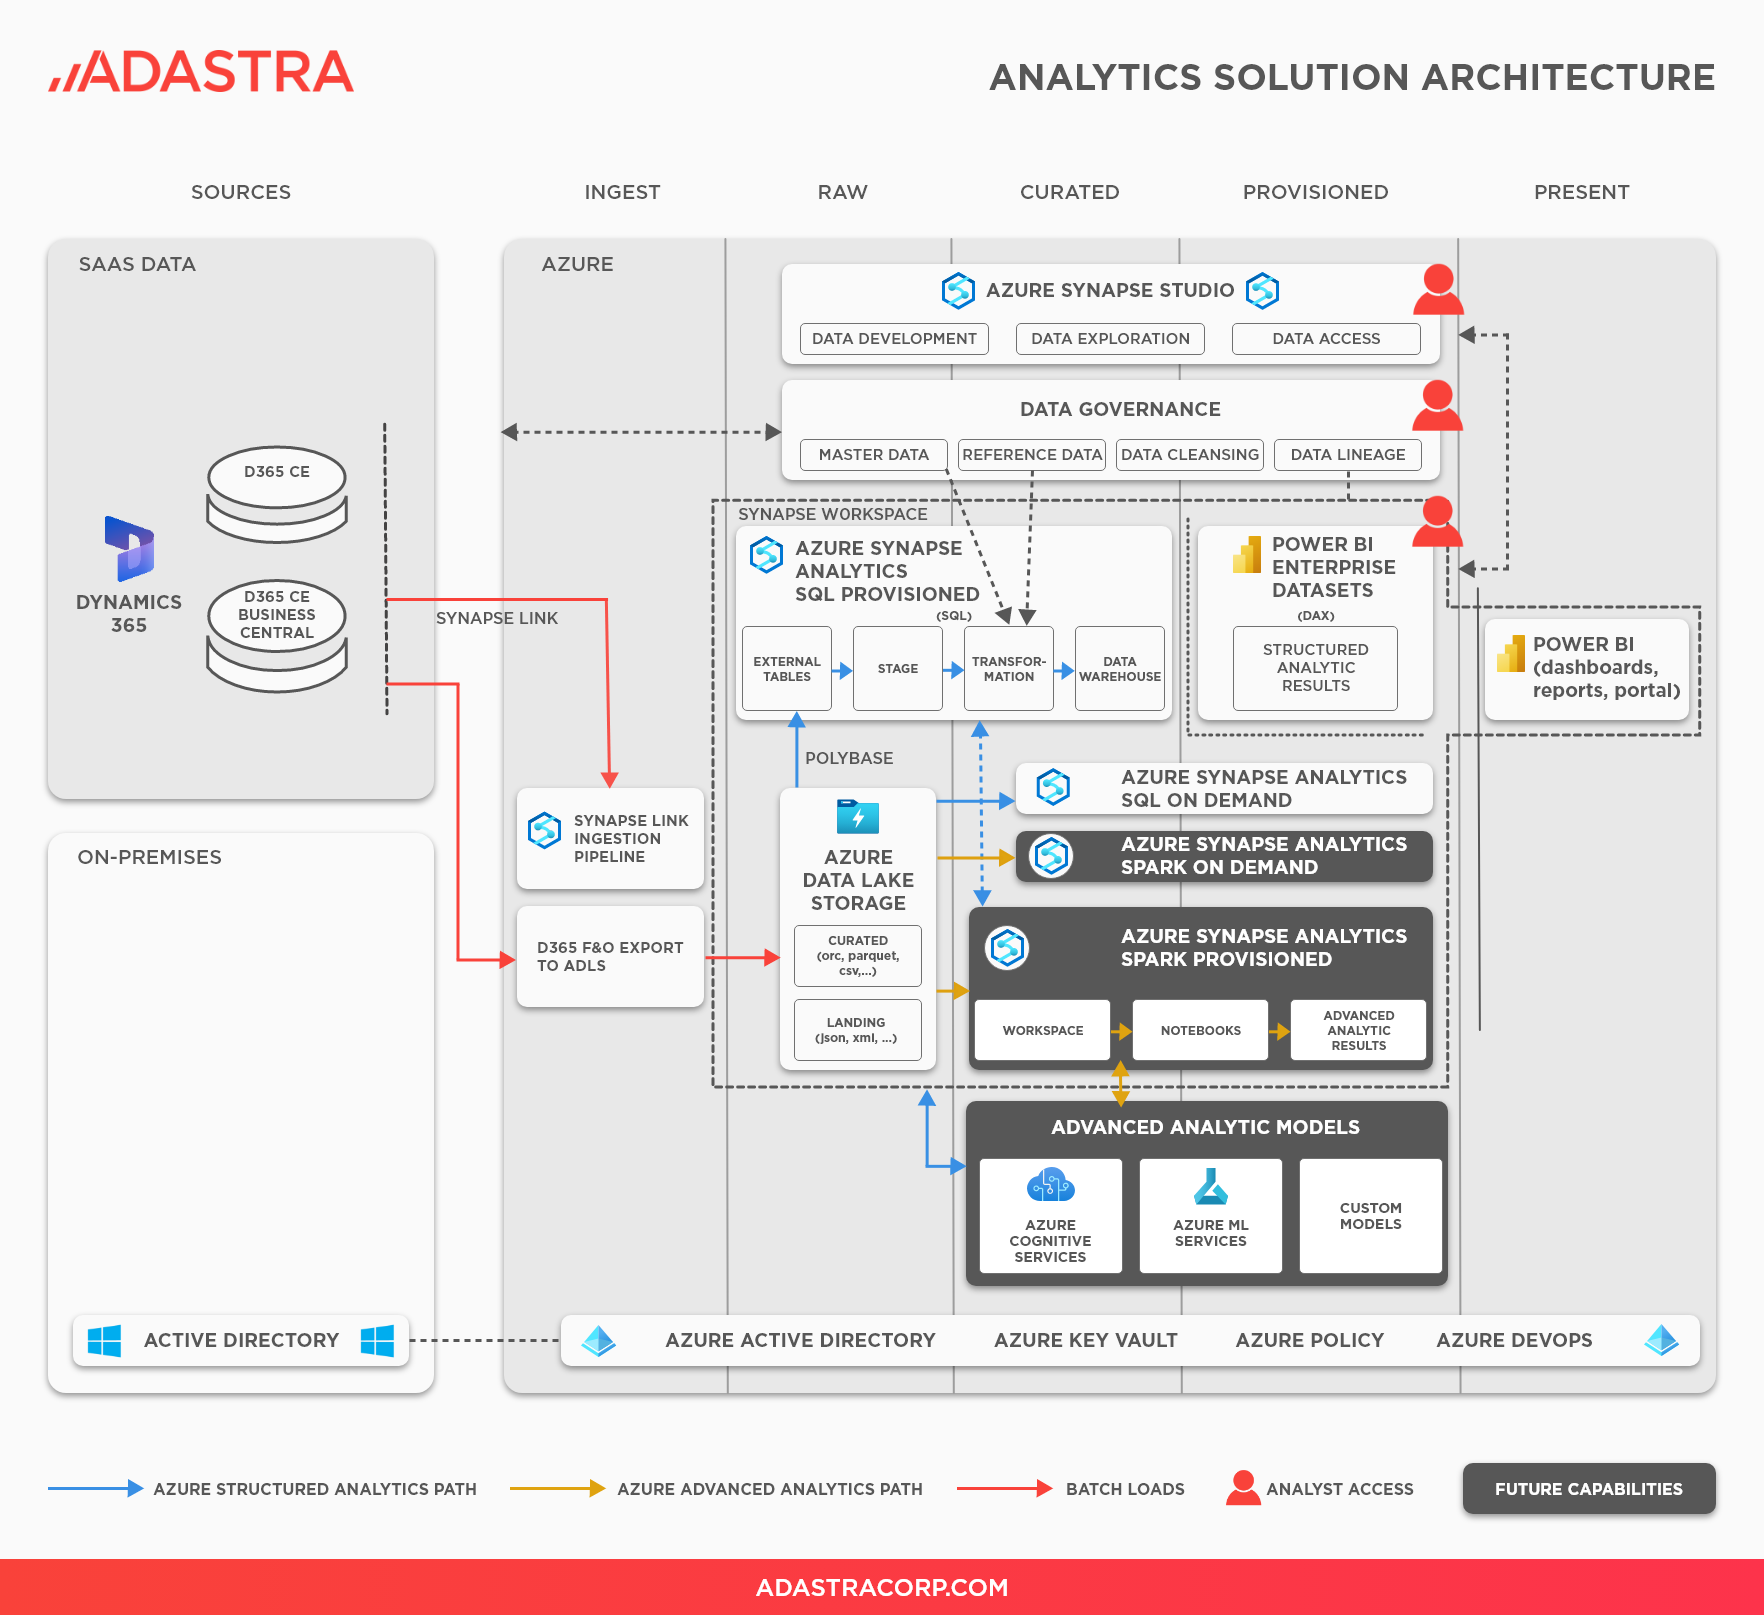
Modern business analytics platforms serve as the foundational infrastructure for transforming raw operational data into actionable intelligence. These systems unify disparate data streams—ranging from customer relationship management (CRM) software and enterprise resource planning (ERP) systems to real-time IoT sensors—into centralized environments where organizations can perform descriptive, diagnostic, predictive, and prescriptive analysis to drive growth and operational efficiency.
The primary challenge for organizations today is not the lack of data, but the difficulty of orchestrating a coherent analytics strategy. As of 2026, the landscape is defined by the convergence of cloud-native data warehousing, self-service business intelligence (BI) tools, and generative artificial intelligence (AI) integration. Selecting the correct platform requires a rigorous assessment of existing data architecture, user skill sets, and the specific decision-making workflows that the platform is intended to optimize.
The Architecture of Modern Analytics Platforms
At the core of any high-performing analytics stack is a tiered architecture that distinguishes between raw data storage and the end-user interface. Understanding these tiers is essential for ensuring scalability and data integrity.
Data Ingestion and Storage
Before analytics can occur, data must be moved and processed. Modern platforms rely on Extract, Load, Transform (ELT) processes. Unlike legacy ETL (Extract, Transform, Load) processes, ELT shifts the transformation phase to the cloud data warehouse itself, such as Snowflake, Google BigQuery, or Amazon Redshift. This allows for near-real-time data availability. Businesses must ensure that their chosen platform supports robust connectors to their specific operational databases to avoid creating "data silos," where information is locked in proprietary formats.
The Semantic Layer
The semantic layer is a critical component that often goes overlooked during the procurement process. This layer acts as a translator between raw database schemas and the business metrics stakeholders actually care about, such as "Gross Margin" or "Customer Lifetime Value." By defining these metrics in a centralized location, organizations ensure that every department—from finance to marketing—calculates key performance indicators (KPIs) consistently. Without a standardized semantic layer, two teams may produce different values for the same metric, leading to organizational friction and loss of trust in the data.
Analytics and Visualization Engines
The final tier is the user interface, where analysts, data scientists, and business executives interact with data. This includes dashboards, automated reporting, and ad-hoc query tools. By 2026, the most effective platforms are those that reduce the reliance on dedicated data engineers for daily reporting. Tools like Tableau, Microsoft Power BI, and Looker allow business users to drag and drop metrics to answer their own questions, provided the platform has been correctly governed.
Key Considerations for Platform Selection
Choosing an analytics platform is a long-term capital expenditure that impacts every department. Organizations should evaluate vendors based on the following functional and non-functional requirements.
Integration Capability
A platform is only as valuable as the data it can ingest. Before signing a contract, perform a comprehensive inventory of your existing software stack. Does the analytics platform offer native, pre-built connectors for your CRM, accounting software, and marketing automation tools? If custom APIs are required, assess the technical debt and maintenance overhead involved in building and maintaining those pipelines.
Governance and Security
In an era of stringent global data regulations, such as the General Data Protection Regulation (GDPR) and various regional privacy acts, governance is a non-negotiable requirement. A modern platform must provide:
- Role-Based Access Control (RBAC): Defining granular permissions based on a user’s job function.
- Data Lineage: The ability to trace the origin of a data point back to its source, which is vital for auditing.
- Encryption at Rest and in Transit: Ensuring that sensitive financial or customer data remains secure even when accessed remotely by authorized users.
Scalability and Cost Structure
The pricing models for analytics platforms vary significantly. Some vendors charge based on the number of users, while others charge based on compute usage or data volume. Organizations with high-velocity data environments—such as e-commerce companies with millions of transactions—often find consumption-based pricing to be more efficient but potentially volatile. Perform a three-year total cost of ownership (TCO) analysis, factoring in storage growth and the hiring costs of the specialized talent required to maintain the platform.
Comparison of Leading Analytics Approaches
| Feature | Self-Service BI Tools | Enterprise Data Platforms | Custom AI-Driven Stacks |
|---|---|---|---|
| Primary User | Business Analysts | Data Engineers/Scientists | Specialized Developers |
| Setup Time | Days to Weeks | Months | Quarters |
| Governance | Moderate | Very High | Variable |
| Cost | Low to Moderate | High | Very High |
| Best For | Ad-hoc Reporting | Complex Data Warehousing | Predictive Modeling |
Implementation Lifecycle: From Procurement to Adoption
Successfully implementing an analytics platform is less of a technical project and more of a cultural transformation. The following steps constitute the industry-standard lifecycle for 2026 deployments.
1. Requirements Scoping
Identify the specific business questions that remain unanswered. Avoid "boiling the ocean" by trying to integrate all data at once. Start with a single high-impact use case, such as "optimizing supply chain replenishment" or "reducing customer churn."
2. Proof of Value (PoV)
Rather than a traditional Proof of Concept (PoC) which only tests technical feasibility, conduct a Proof of Value. Take a subset of your actual data and work with the vendor to build a functional dashboard that answers a high-priority business question. This tests both the technical capabilities and the ease of use for the target stakeholders.
3. Data Cleansing and Modeling
A platform is only as good as the data fed into it. Before the launch, spend significant time cleaning dirty or duplicate data. If the underlying data is faulty, the analytics platform will simply provide "faster, more efficient wrong answers."
4. User Training and Cultural Adoption
Resistance to new software is the primary cause of failed analytics initiatives. Assign "Data Champions" in each department—users who are early adopters and can assist their peers. Create internal documentation and host workshops that focus on how the platform helps them solve their specific, day-to-day problems, rather than focusing on abstract features.
Managing Common Pitfalls
Even well-funded analytics projects often struggle with specific, recurrent issues. Proactive management of these risks is essential.
The "Dashboard Fatigue" Problem
When dashboards are created without clear objectives, stakeholders often stop looking at them. To avoid this, limit the number of metrics on any single view to those that trigger a specific action. If a stakeholder cannot identify a decision they would make based on a specific chart, that chart should be removed.
Technical Debt and "Shadow IT"
If the official analytics platform is too slow or difficult to use, departments will inevitably revert to spreadsheets or unapproved software tools. This leads to data fragmentation and security vulnerabilities. To mitigate this, ensure the platform provides a "Data Sandbox"—a controlled environment where users can perform their own experimental analysis without compromising the central "Source of Truth."
Reliance on "Vanity Metrics"
Ensure the platform is configured to measure business outcomes rather than activity levels. For example, tracking "Number of Website Visitors" (a vanity metric) is less valuable than tracking "Conversion Rate by User Segment" (an outcome-based metric). The platform should be used to interrogate the why behind business results, not just to document that they occurred.
Frequently Asked Questions
What is the role of Generative AI in modern analytics platforms? Generative AI acts as a natural language interface for data. Instead of writing SQL queries, users can ask, "Show me last month’s revenue by region compared to our quarterly target," and the AI generates the visualization and the underlying query. This lowers the barrier to entry for non-technical managers.
How often should an organization audit its analytics platform strategy? An annual review is recommended. As business needs evolve—such as expanding into new markets or launching new product lines—your data model may become outdated. An annual audit ensures that your data governance, storage costs, and reporting metrics remain aligned with current business goals.
Is it better to build an in-house analytics stack or buy a pre-packaged platform? Most organizations benefit from a "buy-and-integrate" approach. While building from scratch using open-source libraries offers maximum flexibility, the ongoing maintenance costs are prohibitively high for most businesses. Using established platforms (e.g., Snowflake, Tableau, Databricks) allows your team to focus on business logic rather than infrastructure maintenance.
How do I ensure data quality within my analytics environment? Implement "data observability" tools that automatically flag anomalies. If your daily revenue reporting suddenly drops to zero, the platform should notify the engineering team immediately, allowing them to fix the pipeline before a manager makes a decision based on the erroneous data.
What is the most important skill for a data-driven team? Data literacy is more important than technical programming skills. The ability to look at a chart, understand the context of the data, and distinguish between correlation and causation is what differentiates organizations that truly leverage their analytics platforms from those that merely collect data.
Next Steps for Organizations
To move forward, start by performing a data maturity assessment. Identify where your organization currently resides on the spectrum: are you using data primarily for retrospective reporting, or are you utilizing it for forward-looking predictive modeling?
Establish a cross-functional data committee comprising members from both IT and line-of-business departments. Their first task should be to document the top five business decisions that are currently hampered by a lack of data. By focusing on these specific pain points, you will secure the necessary internal buy-in to move from an ad-hoc data culture to a sophisticated, analytics-driven organization.