The North American Blizzard of 1996 was a catastrophic nor'easter that paralyzed the Eastern United States from January 6 to January 8, 1996. This severe winter storm produced record-breaking snowfall, claiming more than 150 lives and causing approximately $3 billion in property damage and economic disruption across the Mid-Atlantic and New England regions.
Meteorological Foundations of the 1996 Blizzard
The severity of the 1996 blizzard was the result of a "perfect storm" of atmospheric conditions. To understand why this event was so much more impactful than a standard winter storm, one must examine the specific pressure systems and temperature gradients that converged over the North American continent in early January.
The Role of the Omega Block
In the days leading up to the storm, a massive high-pressure system, often referred to as an Omega Block due to its resemblance to the Greek letter $\Omega$, became established over Greenland and eastern Canada. This blocking pattern acted as an atmospheric wall, preventing the cold, Arctic air over the Northeastern United States from moving out to sea. This phenomenon, known as Cold Air Damming, ensured that when the moisture-rich storm system arrived, the surface temperatures would remain well below freezing, guaranteeing snow rather than a wintry mix or rain.
Cyclogenesis and Moisture Sources
The storm itself originated as a low-pressure disturbance in the Gulf of Mexico. As it moved toward the Atlantic coast, it underwent explosive cyclogenesis, rapidly deepening as it fed off the temperature contrast between the frigid continental air and the relatively warm waters of the Gulf Stream. By the time the center of the low pressure reached the coast of the Carolinas, it had evolved into a classic nor'easter, with a central pressure that continued to drop as it moved northward.
The moisture intake was exceptional. The storm tapped into a "subtropical jet" that pumped a steady stream of moisture from the Caribbean directly into the cold air mass. This created a high "snow-to-liquid ratio," meaning that for every inch of liquid precipitation, ten to fifteen inches of light, fluffy snow were produced.
Chronology of the Event: January 6–8, 1996
The blizzard did not hit the entire East Coast simultaneously; rather, it was a multi-day progression that overwhelmed local infrastructure as it moved from the South toward the North.
- Friday, January 5: The National Weather Service (NWS) issued widespread Blizzard Warnings, a rare move that signaled the high confidence in the upcoming forecast.
- Saturday, January 6: Snow began falling in Virginia, West Virginia, and Maryland by the afternoon. Travel conditions deteriorated rapidly as snowfall rates reached two to three inches per hour.
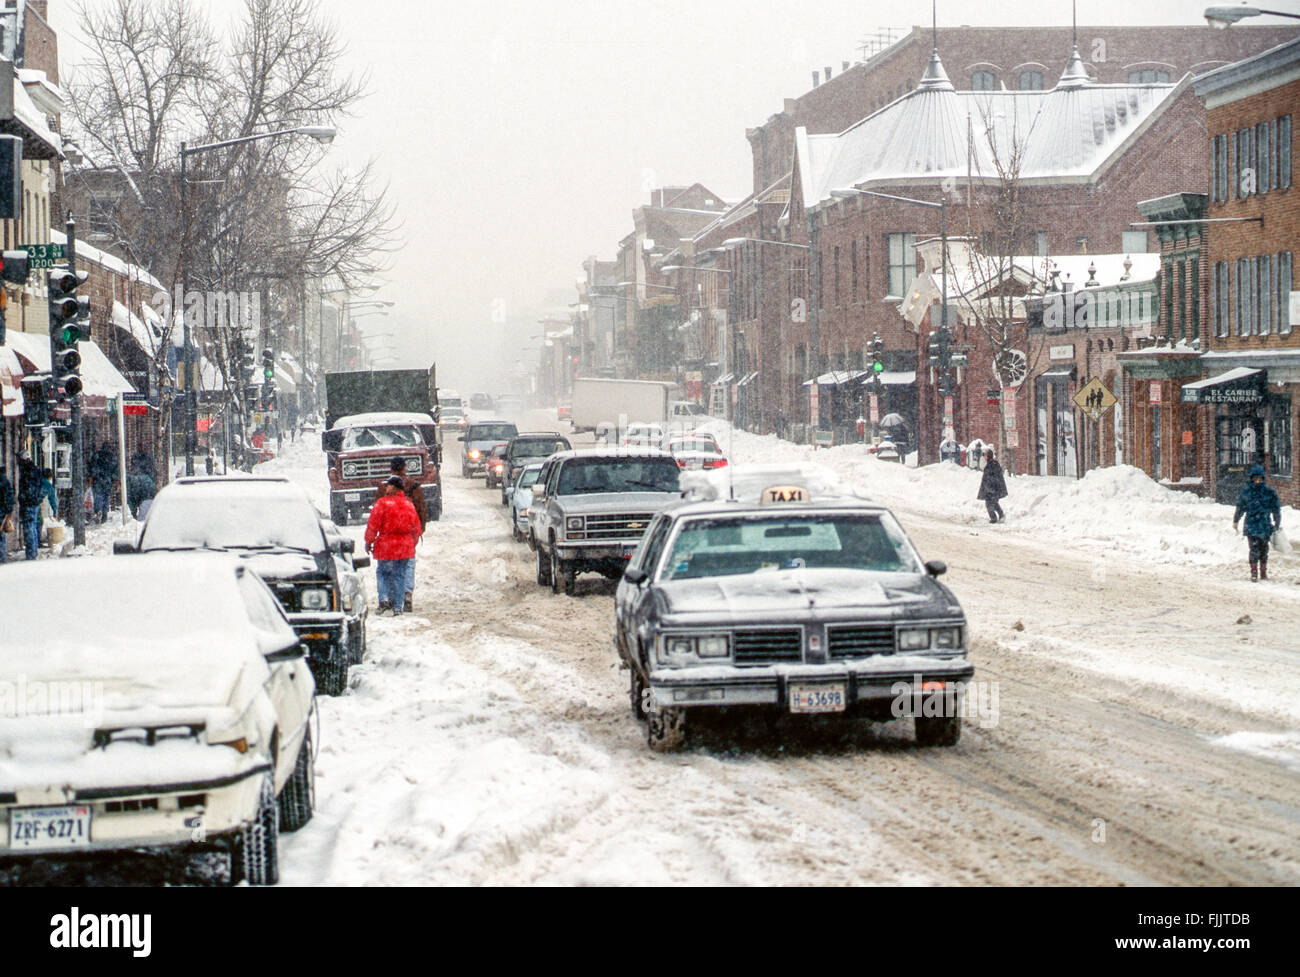
- Sunday, January 7: This was the peak of the storm for the major metropolitan centers. Philadelphia, Baltimore, New York City, and Boston were entirely immobilized. Sustained winds of 30 to 40 mph, with gusts exceeding 60 mph, created near-zero visibility and massive snowdrifts.
- Monday, January 8: The storm center moved out into the Atlantic, but the effects lingered. While the snow stopped, the extreme cold and wind made the initial recovery efforts dangerous and slow.
Geographic Impact and Record Snowfall Totals
The 1996 blizzard is frequently compared to the "Great Blizzard of 1888" and the "1993 Superstorm" because of its geographic breadth and the sheer volume of snow deposited on major urban centers.
Philadelphia and the Mid-Atlantic
Philadelphia, Pennsylvania, was the epicenter of the storm’s intensity. The city recorded an all-time single-storm record of 30.7 inches at Philadelphia International Airport. The city was so overwhelmed that it took nearly a week to clear secondary roads, and the event remains the benchmark for winter weather severity in the region as of 2026.
The New York Metropolitan Area
In New York City, Central Park officially recorded 20.2 inches, which at the time was one of the highest totals since the 1940s. However, nearby locations in New Jersey, such as Newark, saw much higher totals, with Newark Liberty International Airport recording 27.8 inches. This disparity was caused by "snow banding," where localized strips of intense precipitation created significantly higher totals just miles away from lighter areas.
The Potomac Region
Washington, D.C., and Baltimore were hit equally hard. While Dulles International Airport recorded 24.6 inches, the city centers saw slightly less due to the urban heat island effect, yet still enough to shut down the federal government for nearly a week. This led to the famous "Snow Days" for federal employees, which cost the government hundreds of millions in lost productivity.
| Location | Snowfall (Inches) | Historic Significance |
|---|---|---|
| Philadelphia, PA | 30.7 | All-time city record |
| Newark, NJ | 27.8 | All-time city record |
| Baltimore, MD | 22.5 | Near-record total |
| New York City (Central Park) | 20.2 | Record for month of January |
| Washington D.C. (Dulles) | 24.6 | Paralyzed federal operations |
| Providence, RI | 24.0 | Significant regional impact |
Socio-Economic Consequences and Human Toll
The human and economic impact of the blizzard was profound. Unlike smaller storms that cause temporary inconveniences, the 1996 blizzard fundamentally altered the operations of the Eastern Seaboard for nearly ten days.
Fatalities and Health Risks
Approximately 154 deaths were attributed to the storm and its immediate aftermath. The causes of death were varied but highlighted the hidden dangers of extreme winter weather:
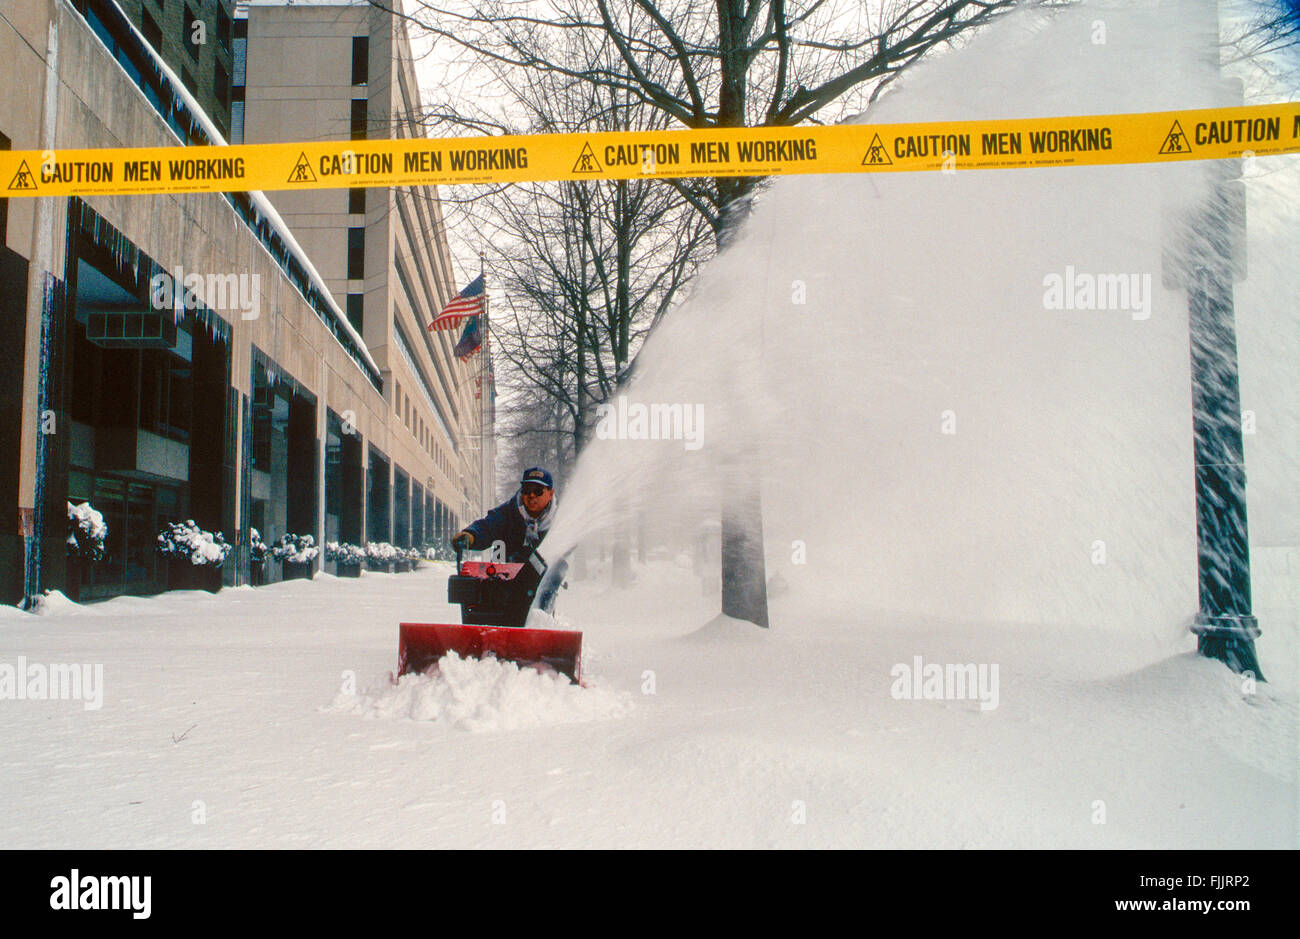
- Physical Overexertion: A significant number of deaths were caused by heart attacks suffered by individuals attempting to shovel the heavy, wet snow.
- Carbon Monoxide Poisoning: As residents were trapped in their homes, some used unsafe heating methods, or their furnace exhaust vents became blocked by snowdrifts, leading to lethal gas buildup.
- Traffic Accidents: Despite widespread travel bans, those who did venture out faced treacherous conditions, resulting in numerous fatal collisions.
Infrastructure and Transportation
The transportation "Spine" of the United States—the I-95 corridor—was effectively severed. Amtrak suspended Northeast Corridor service, and major airports including JFK, LaGuardia, Newark, Philadelphia, and BWI were closed for several days. This created a ripple effect across the global aviation network, as thousands of flights were canceled, and freight logistics were delayed for weeks.
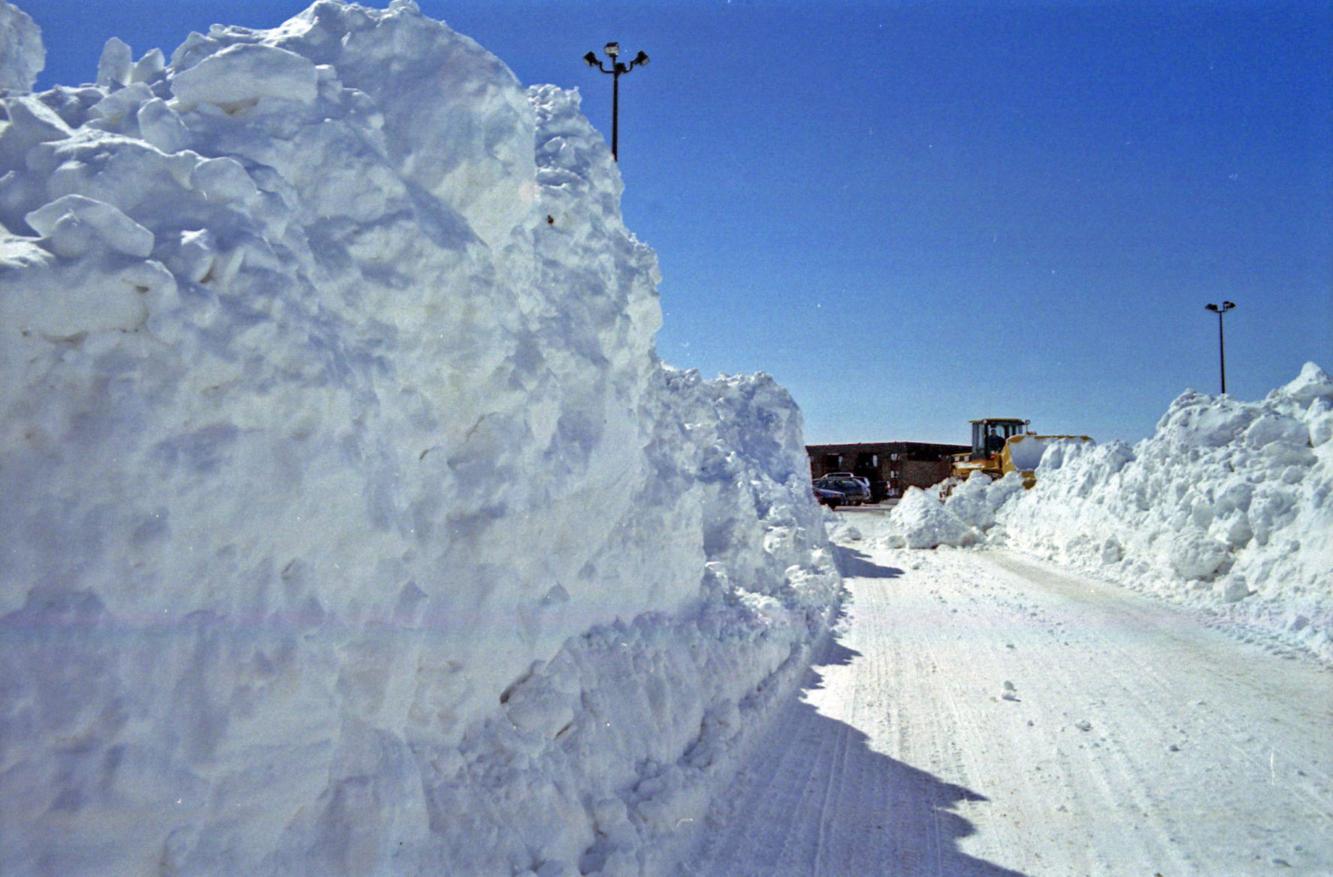
In many cities, the sheer volume of snow presented a disposal problem. Municipalities had to haul snow by the truckload to vacant lots, parking lots, or even dump it into rivers (where permitted) because there was simply nowhere left to plow it on the streets.
The Double Whammy: The Mid-Atlantic Flood of 1996
While the blizzard itself was a singular event, its legacy is inextricably linked to the catastrophic flooding that occurred less than two weeks later. This sequence of events is often studied in emergency management as a "compound disaster."
On January 19, 1996, a sudden and dramatic shift in weather patterns occurred. A "January Thaw" brought temperatures into the 50s and 60s (Fahrenheit), accompanied by heavy, warm rain. The massive snowpack from the blizzard—which contained the equivalent of three to five inches of liquid water—melted almost instantly.
Because the ground was still frozen, the meltwater had nowhere to go but into the river systems. The Susquehanna, Delaware, and Potomac Rivers all rose to record or near-record flood stages. This caused a second wave of evacuations and damage, as homes that had survived the snow were destroyed by rising waters and ice jams. The combined damage from the snow and the subsequent flood solidified 1996 as one of the most expensive weather years in U.S. history.
Evolution of Emergency Management Since 1996
The 1996 blizzard served as a wake-up call for municipal and federal emergency planners. In the thirty years between the event and 2026, several key improvements in response strategies have been implemented based on the lessons of that January.
Advanced Forecasting and Communication
In 1996, the internet was in its infancy for the general public. Most people relied on televised evening news or radio for updates. Today, the integration of high-resolution ensemble modeling and real-time smartphone alerts allows for much more surgical precision in evacuations and travel bans. The NWS now uses "Probabilistic Snowfall Experiments" to give residents a range of possibilities rather than a single number, which helps in better preparation.
Snow Removal Logistics
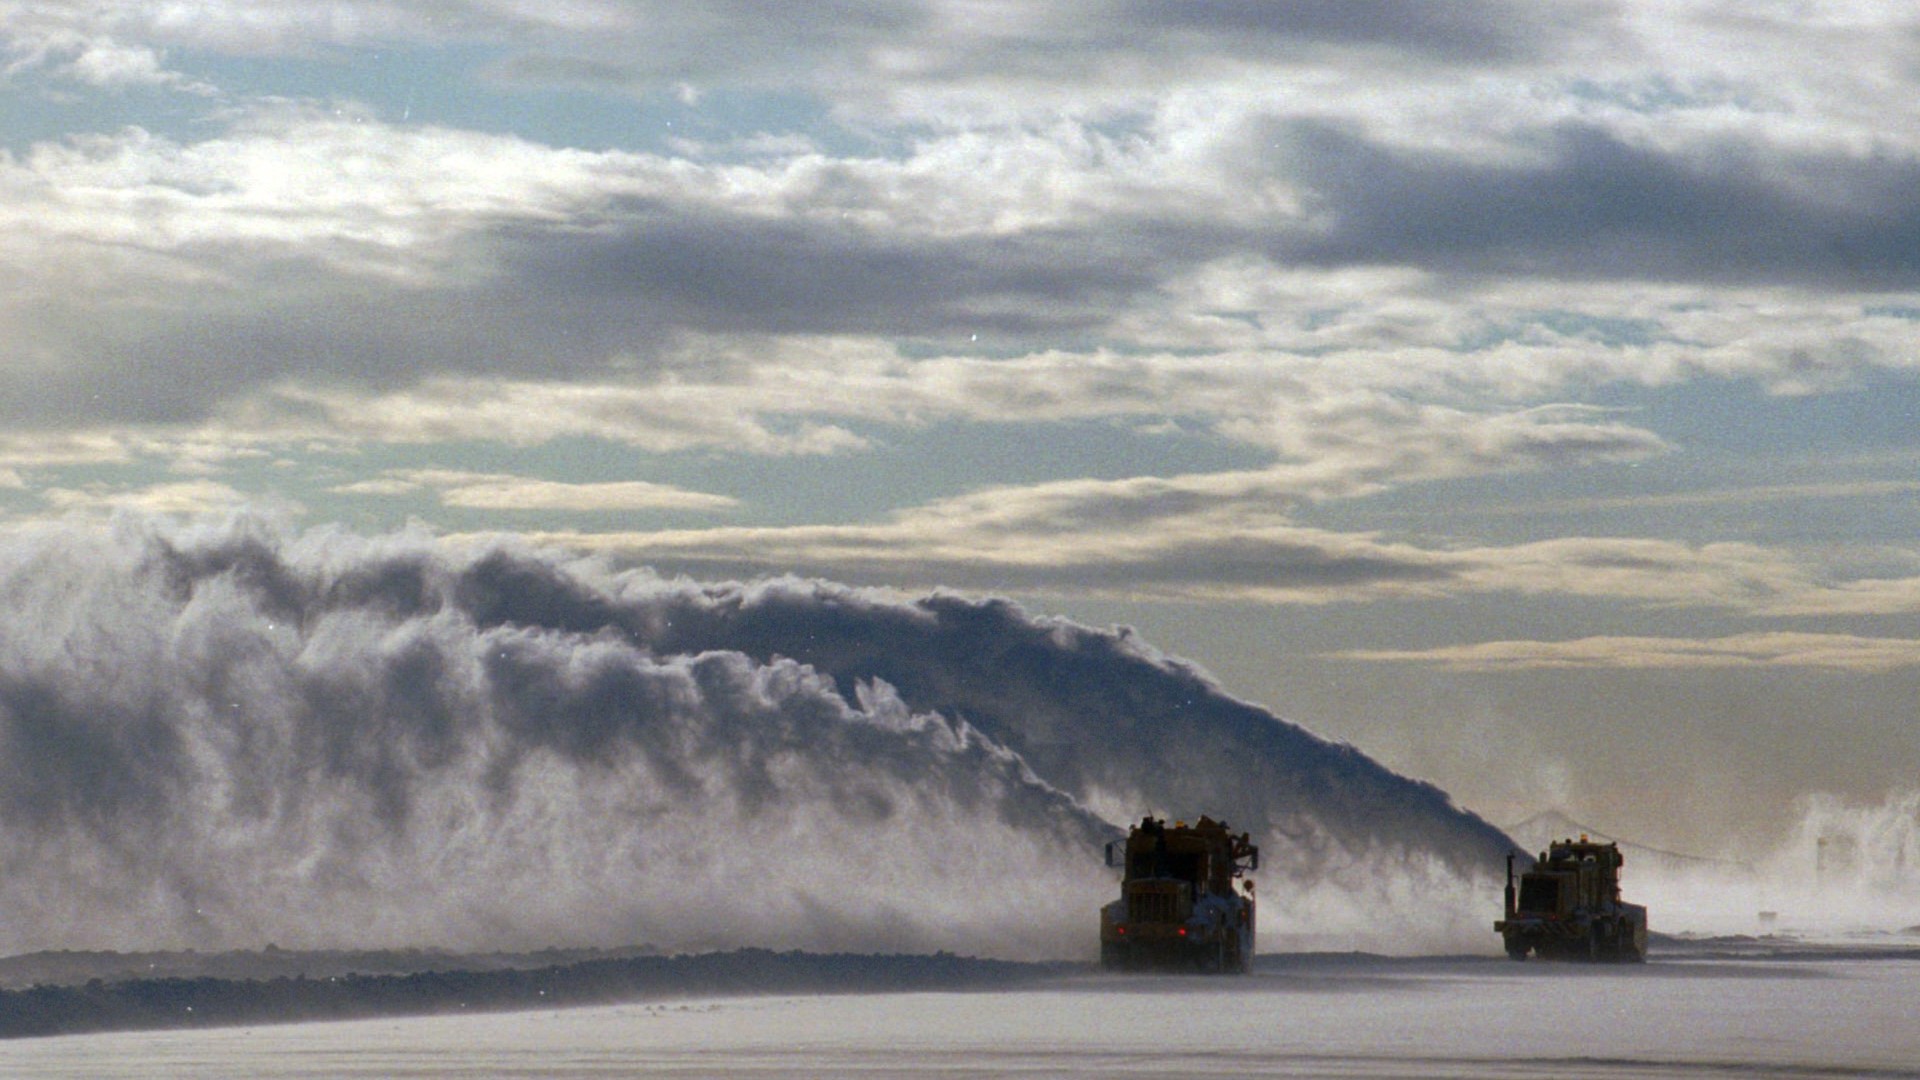
Cities like Philadelphia and New York restructured their snow-removal contracts following the 1996 event. The concept of "snow emergencies" was codified into law, allowing for the immediate towing of vehicles on primary routes. Furthermore, many cities invested in industrial snow melters—massive machines that can process 60 to 120 tons of snow per hour—to avoid the logistical nightmare of hauling snow to distant locations.
Utility Resilience
The blizzard caused widespread power outages as heavy snow and wind downed lines. Since then, there has been a multi-decade push to move critical infrastructure underground or to use "hardened" poles and wires that can withstand the weight of ice and the force of 60-mph gusts.
Frequently Asked Questions
How does the 1996 blizzard compare to the 1993 "Storm of the Century"?
The 1993 storm was larger in geographic scale, affecting the entire East Coast from Florida to Canada. However, the 1996 blizzard was more concentrated in its impact on the Mid-Atlantic urban corridor, dropping higher snowfall totals in cities like Philadelphia and Newark than the 1993 event did.
Why did so many people die after the snow stopped falling?
Most fatalities in major blizzards occur during the recovery phase. Heart attacks from shoveling and carbon monoxide poisoning from blocked vents or improper use of space heaters are the leading causes. The 1996 event was particularly lethal because the snow was followed by a period of extreme cold, which hampered rescue efforts.
Was the 1996 blizzard caused by El Niño?
The 1995-1996 winter was actually characterized by a weak La Niña to neutral phase, but it featured a strongly negative North Atlantic Oscillation (NAO). A negative NAO is a primary driver for major East Coast snowstorms as it creates the high-pressure "blocking" that keeps cold air in place while steering storms along the coast.
How much did the 1996 blizzard cost in total?
When accounting for both the snow event and the subsequent flooding, total damages were estimated at approximately $3 billion in 1996 dollars. Adjusted for inflation to 2026 values, this figure would be significantly higher, likely exceeding $6 billion, making it one of the costliest winter weather events in U.S. history.
Could a storm of this magnitude happen again?
Yes. Atmospheric conditions such as the Omega Block and moisture-rich coastal lows remain part of the North American climate system. While overall warming trends may lead to more rain in some scenarios, a warmer atmosphere also holds more moisture, which can lead to even more intense snowfall when temperatures are sufficiently low.
Final Recommendation for Residents and Historians
For those researching the 1996 blizzard or preparing for future extreme weather, the primary lesson is the importance of the pre-event window. The 24 to 48 hours before the first snowflake fell in 1996 were the most critical for life-saving preparations.
If you live in a region prone to nor'easters, ensure you have a "72-hour kit" that includes not just food and water, but also a carbon monoxide detector with battery backup and a clear understanding of your local "Snow Emergency" routes. For a deep dive into the specific meteorological charts and satellite imagery of this event, the National Centers for Environmental Information (NCEI) provides archived data that remains the gold standard for atmospheric research.