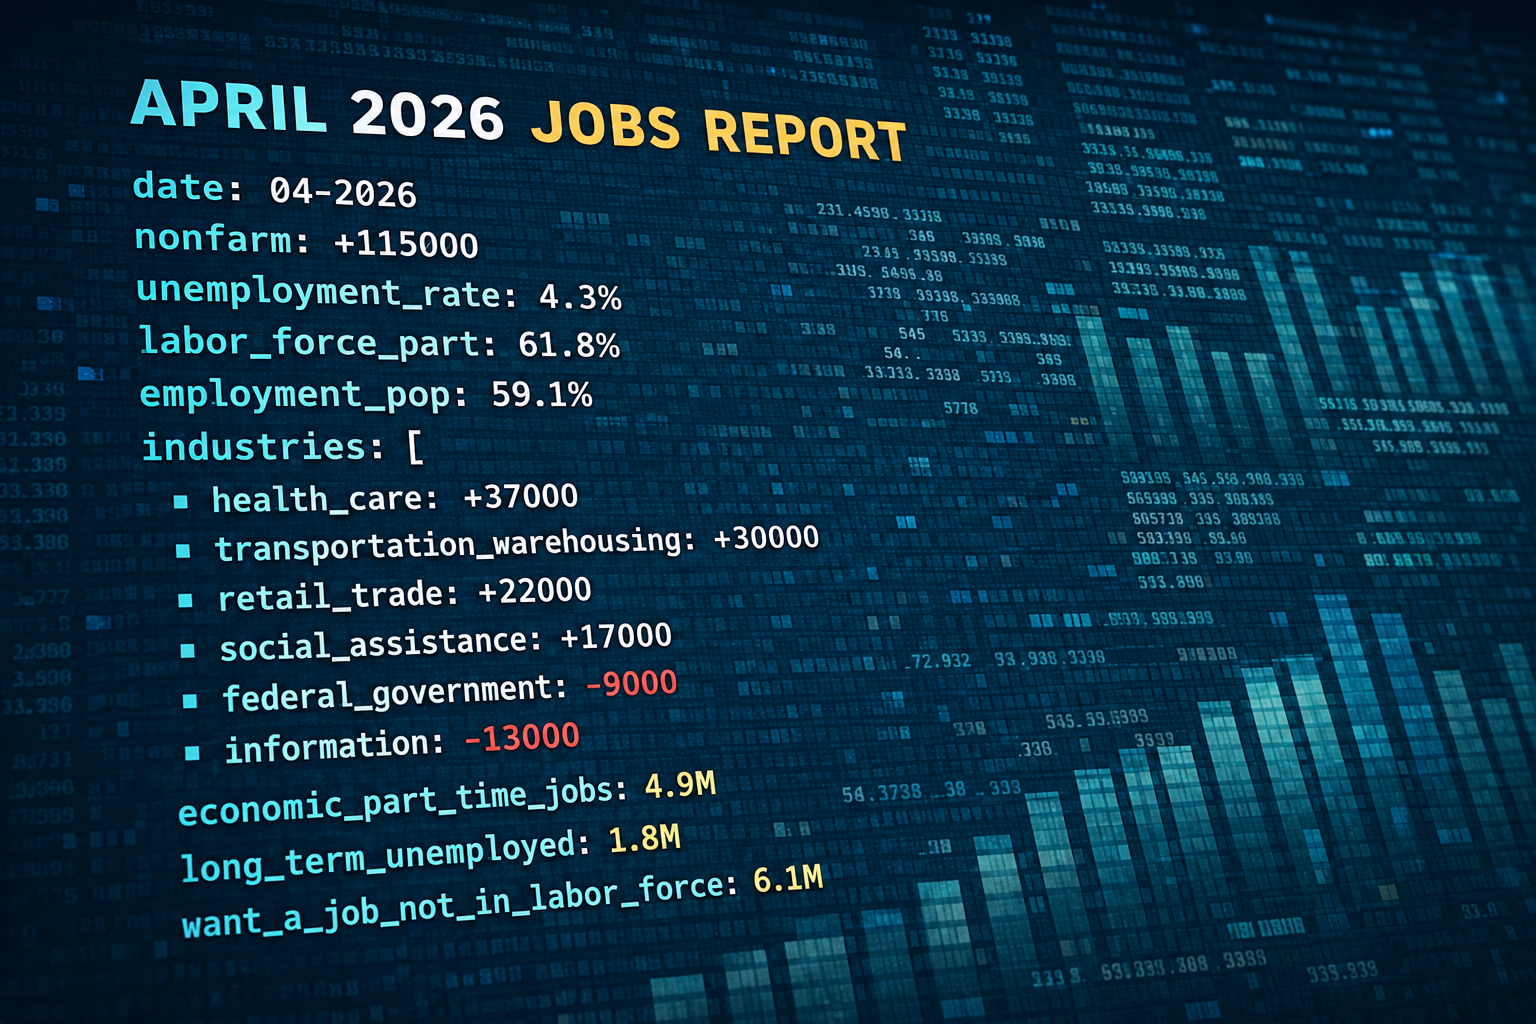
A job report explains employment data by synthesizing surveys from households and businesses to provide a snapshot of labor market health. It primarily tracks the unemployment rate, nonfarm payroll additions, and wage growth, offering critical insights that influence central bank interest rate decisions, government fiscal policy, and global financial market fluctuations.
Employment reports are the pulse of an economy. For policymakers, investors, and job seekers, these documents are more than just lists of numbers; they are diagnostic tools used to measure the strength of the collective workforce. While the term "job report" is often used generically, it most frequently refers to the Employment Situation Summary released monthly by the Bureau of Labor Statistics (BLS). In 2026, as in previous decades, this report remains the gold standard for assessing how many people are working, how much they are earning, and which industries are expanding or contracting.
The Dual Nature of the Job Report: Two Surveys in One
To understand how a job report explains employment data, one must first recognize that the most comprehensive reports are actually comprised of two distinct surveys that often tell slightly different stories. Understanding the tension and synergy between these two data sets is fundamental for any senior analyst or technical observer.
The Establishment Survey (The Payroll Survey)
The Establishment Survey, technically known as the Current Employment Statistics (CES), gathers data from approximately 119,000 businesses and government agencies. This survey is responsible for the "Nonfarm Payrolls" number, which is arguably the most watched statistic in the financial world. It measures the number of jobs created or lost during the reference month. Because it surveys businesses, it provides granular detail on which sectors—such as healthcare, technology, or manufacturing—are driving growth. However, it does not count self-employed individuals or agricultural workers.
The Household Survey
The Household Survey, or the Current Population Survey (CPS), involves interviews with about 60,000 unique households. This survey is used to calculate the official unemployment rate. Unlike the Establishment Survey, the Household Survey counts people rather than jobs. If a person holds two part-time jobs, the Establishment Survey counts them twice, while the Household Survey counts them as one employed person. This survey also captures demographic data, such as employment status by race, age, and educational attainment, as well as the number of people who have dropped out of the labor force entirely.
Core Metrics Explained: The Indicators of Labor Vitality
A job report explains employment data through several key metrics. Each metric serves as a specific lens through which the broader economy can be viewed.
1. Nonfarm Payrolls (NFP)
Nonfarm payrolls represent the total number of paid workers in the U.S. excluding farm employees, private household employees, and non-profit organization employees. As of 2026, the NFP remains the primary indicator of economic momentum. A high NFP number suggests a robust economy where businesses are confident enough to expand their headcount. Conversely, a negative or stagnant NFP often signals the onset of a recession or an "economic cooling" phase.
2. The Unemployment Rate (U-3 vs. U-6)
The "headline" unemployment rate, known as U-3, measures the percentage of the labor force that is jobless and has actively looked for work in the past four weeks. However, a comprehensive job report also includes the U-6 rate. The U-6 rate is a broader measure that includes:
- Discouraged workers (those who want a job but have stopped looking).
- Part-time workers who want full-time work (the underemployed).
- Marginally attached workers.
By comparing U-3 and U-6, analysts can determine if the labor market is truly healthy or if there is significant hidden "slack"—where people are working but not at their full potential or desired capacity.
3. Average Hourly Earnings
This metric tracks the change in the amount businesses pay their employees. In 2026, wage growth is a critical component of the job report because of its direct link to inflation. If wages rise too quickly, it can lead to a "wage-price spiral," where businesses raise prices to cover higher labor costs, leading to further inflation. Central banks, like the Federal Reserve, monitor average hourly earnings to decide whether to raise interest rates to cool the economy or lower them to stimulate growth.
4. The Labor Force Participation Rate
This figure represents the percentage of the civilian non-institutional population that is either working or actively looking for work. A declining participation rate can be a sign of an aging population or a "skills gap" where workers feel their abilities no longer match the available jobs. It is a vital metric for understanding the long-term productive capacity of the nation.
Comparing Different Types of Employment Reports
While the BLS report is the most prominent, several other organizations release employment data that serve different analytical purposes.
| Report Title | Source | Frequency | Primary Focus |
|---|---|---|---|
| Employment Situation Summary | BLS | Monthly | Comprehensive national data (NFP & Unemployment). |
| ADP National Employment Report | ADP Research Institute | Monthly | Private sector payrolls based on actual payroll data. |
| JOLTS (Job Openings) | BLS | Monthly | Labor demand (openings) and turnover (quits/hires). |
| Weekly Unemployment Claims | Dept. of Labor | Weekly | Real-time "high-frequency" look at layoffs and new jobless. |
| Employment Cost Index (ECI) | BLS | Quarterly | Total compensation costs (wages plus benefits). |
How the Job Report Influences Monetary and Fiscal Policy
A job report explains employment data not just for the sake of history, but to guide future action. In the United States, the Federal Reserve operates under a "dual mandate": to promote maximum employment and stable prices.
When a job report shows "overheating"—extremely low unemployment coupled with soaring wage growth—the Federal Reserve may interpret this as a precursor to high inflation. In response, they might raise the federal funds rate. Higher rates make borrowing more expensive for businesses and consumers, which eventually slows down hiring and spending to keep inflation in check.
On the other hand, if a job report shows widespread job losses or a rising unemployment rate, the government may consider fiscal stimulus packages, such as extended unemployment benefits or tax incentives for hiring, while the central bank may lower interest rates to encourage investment.
The Role of Data Revisions and Seasonal Adjustment
One of the most technical aspects of how a job report explains employment data is the process of revision and seasonal adjustment.
Seasonal Adjustments
Employment data is highly seasonal. Retailers hire thousands of workers in November and December for the holiday season and let them go in January. Construction activity often slows in the winter. To provide a clear view of the underlying economic trend, the BLS uses complex mathematical models to "smooth out" these predictable seasonal fluctuations. Analysts always focus on the "seasonally adjusted" numbers to see the real growth or contraction.
The Revision Process
The initial jobs report released on the first Friday of the month is based on incomplete data. As more businesses respond to the surveys over the following weeks, the BLS revises the numbers. It is common for a report to show a gain of 200,000 jobs in one month, only for that number to be revised down to 150,000 a month later. These revisions can sometimes be more significant than the new month's "headline" number, as they reveal that the economic momentum was actually weaker or stronger than previously thought.
Common Pitfalls in Interpreting Employment Data
Readers often misinterpret job reports by focusing on a single number without context. Here are three common mistakes to avoid:
- Ignoring the "Quits Rate": Included in the JOLTS report, the quits rate measures how many people voluntarily left their jobs. A high quits rate is actually a sign of a strong labor market, as it indicates workers are confident enough to leave their current role for a better opportunity.
- Focusing Only on the Unemployment Rate: If the unemployment rate drops because 500,000 people gave up looking for work and left the labor force, that is a sign of economic weakness, not strength. Always look at the Participation Rate alongside the Unemployment Rate.
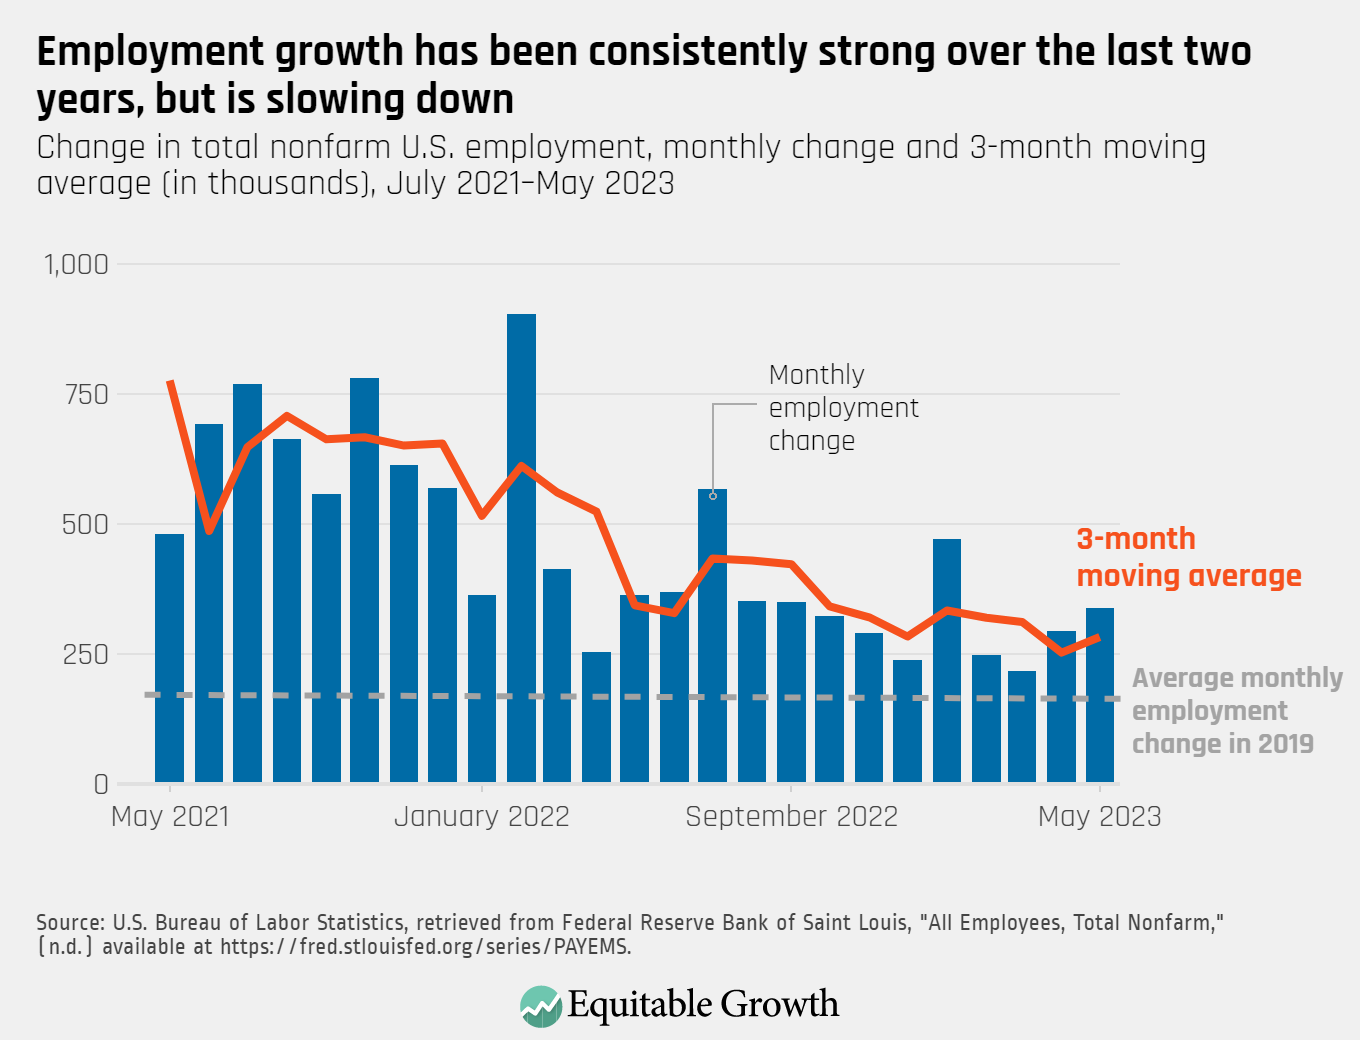
- Overreacting to One Month: Monthly data can be "noisy" due to weather events (like major hurricanes) or large-scale strikes. It is generally better to look at three-month or six-month moving averages to identify a genuine trend in employment data.
The Significance of Industry-Specific Data
A job report explains employment data by breaking down the economy into sectors. In 2026, certain sectors act as "leading indicators." For instance:
- Temporary Help Services: Often the first sector to decline before a recession (as companies cut temp staff first) and the first to grow during a recovery.
- Manufacturing: Highly sensitive to global trade and interest rates.
- Healthcare and Education: Generally "recession-proof" sectors that provide a floor for employment levels even during downturns.
By analyzing these sub-sectors, business leaders can tailor their strategies. A tech firm might see a report showing massive growth in professional services and decide to increase its B2B marketing budget, whereas a retail chain might see slowing wage growth and decide to focus on budget-friendly product lines.
Frequently Asked Questions
What is the "Reference Week" in a job report?
The reference week is typically the week that includes the 12th day of the month. The employment data explained in the report reflects the status of workers during this specific seven-day period. If a person was employed for even one hour during that week, they are counted as employed for the purposes of the report.
Why does the stock market often drop when a job report is "too good"?
This is known as the "good news is bad news" phenomenon. If a job report shows exceptionally high job growth and rising wages, investors fear that the economy is overheating. This leads to expectations that the central bank will raise interest rates to fight potential inflation, which generally makes stocks less attractive compared to bonds and increases borrowing costs for corporations.
How does the BLS account for new businesses that aren't in their database yet?
The BLS uses the "Birth-Death Model." This is a statistical estimation used to account for the net number of jobs created by new business start-ups (births) and lost by business closings (deaths) that cannot be captured by the survey in real-time. This model is often a point of debate among economists during turning points in the economic cycle.
Does the job report include "gig economy" workers?
Gig workers, such as freelancers or rideshare drivers, are generally captured in the Household Survey (where they report themselves as self-employed). However, they are often missing from the Establishment Survey (Nonfarm Payrolls) because they are not on a traditional corporate payroll. This discrepancy is one reason why the two surveys can diverge.
What is the difference between a "job" and an "employed person"?
A job is a specific position on a payroll. An employed person is an individual. If one person holds three different part-time jobs, the Establishment Survey sees three jobs, but the Household Survey sees only one employed person. This distinction is vital for understanding the true level of employment versus the total number of roles available in the economy.
Practical Recommendation for Data Users
To effectively use a job report to explain employment data for your own professional or personal planning, do not rely on news headlines alone. Instead, visit the Bureau of Labor Statistics or the Federal Reserve Economic Data (FRED) tools directly. Focus on the three-month moving average of nonfarm payrolls to filter out monthly volatility. If you are an investor, pay closest attention to Average Hourly Earnings as a precursor to interest rate shifts. If you are a policymaker or researcher, the U-6 unemployment rate provides a much more honest assessment of labor market distress than the standard headline rate.