The Alertmanager API serves as the programmatic gateway for managing alerts, silences, and notification routing within the Prometheus ecosystem. By leveraging the RESTful v2 API, organizations can automate incident response, synchronize maintenance windows with external CMDBs, and build custom dashboards that provide a unified view of system health across complex multi-cloud environments.
In the observability landscape of 2026, the Alertmanager API has matured into a robust, OpenAPI-compliant interface that facilitates seamless communication between monitoring backends and downstream notification providers. While Prometheus natively handles the generation of alerts based on PromQL expressions, Alertmanager’s API is the specific component responsible for deduplicating, grouping, and routing those alerts to the correct receiver. Beyond mere routing, the API provides a powerful mechanism for operational automation, allowing teams to silence noisy alerts during deployments or programmatically query the status of active firing alerts for post-mortem analysis. This overview explores the architectural nuances, integration patterns, and best practices required to master the Alertmanager API in a modern production environment.
The Architecture of the Alertmanager API
Understanding the Alertmanager API requires a grasp of its two primary versions: v1 and v2. While the v1 API laid the groundwork for Prometheus-based alerting, it lacked a formal specification, making client generation difficult. The v2 API, which is the standard in 2026, is built on the OpenAPI (Swagger) specification. This transition significantly improved the developer experience by allowing for the automatic generation of client libraries in various languages, such as Go, Python, and Java.
The API operates over HTTP(S) and primarily consumes and produces JSON. It is structured around several core entities: Alerts, Silences, Status, and Receivers. Unlike many other monitoring tools that use a "push" model for configuration, Alertmanager uses its API primarily for state management and alert ingestion. The configuration itself—defining who gets notified and how—is still largely managed via a YAML configuration file, though the API can be used to reload this configuration without restarting the service.
Integration with the API typically happens at three distinct stages of the observability lifecycle. First, at the ingestion stage, where external systems (not just Prometheus) can push alerts. Second, at the management stage, where automation scripts create silences. Third, at the consumption stage, where external visualization tools or ticketing systems query Alertmanager to display or process active alerts. This multi-faceted approach makes the API a critical hub for any SRE (Site Reliability Engineering) team looking to reduce mean time to acknowledge (MTTA) and mean time to resolve (MTTR).
Core API Endpoints and Functional Groups
To effectively integrate with Alertmanager, one must understand the functional grouping of its endpoints. The v2 API is typically accessed via the /api/v2 prefix. Each group of endpoints serves a specific operational purpose, from health checks to complex alert filtering.
Alert Ingestion and Retrieval
The /api/v2/alerts endpoint is perhaps the most utilized. It supports both GET and POST methods. The POST method allows any external system to send alerts to Alertmanager. This is particularly useful for legacy systems or third-party applications that cannot natively integrate with Prometheus but can send a JSON-formatted HTTP request.
When sending an alert, the data structure—often referred to as a PostableAlert—must include a set of labels and can optionally include annotations. Labels are the identity of the alert; they are used for deduplication and grouping. If two alerts have the identical label set, Alertmanager treats them as the same event. Annotations, conversely, are for metadata that does not affect the alert's identity, such as a description, a link to a runbook, or a dashboard URL.
The GET method on this endpoint allows users to retrieve current alerts. Filters can be applied using matchers (labels) to narrow down the results to specific services, severities, or environments. This is the foundation for building custom "Single Pane of Glass" dashboards that show only the most critical firing alerts across a global fleet.
Silence Management
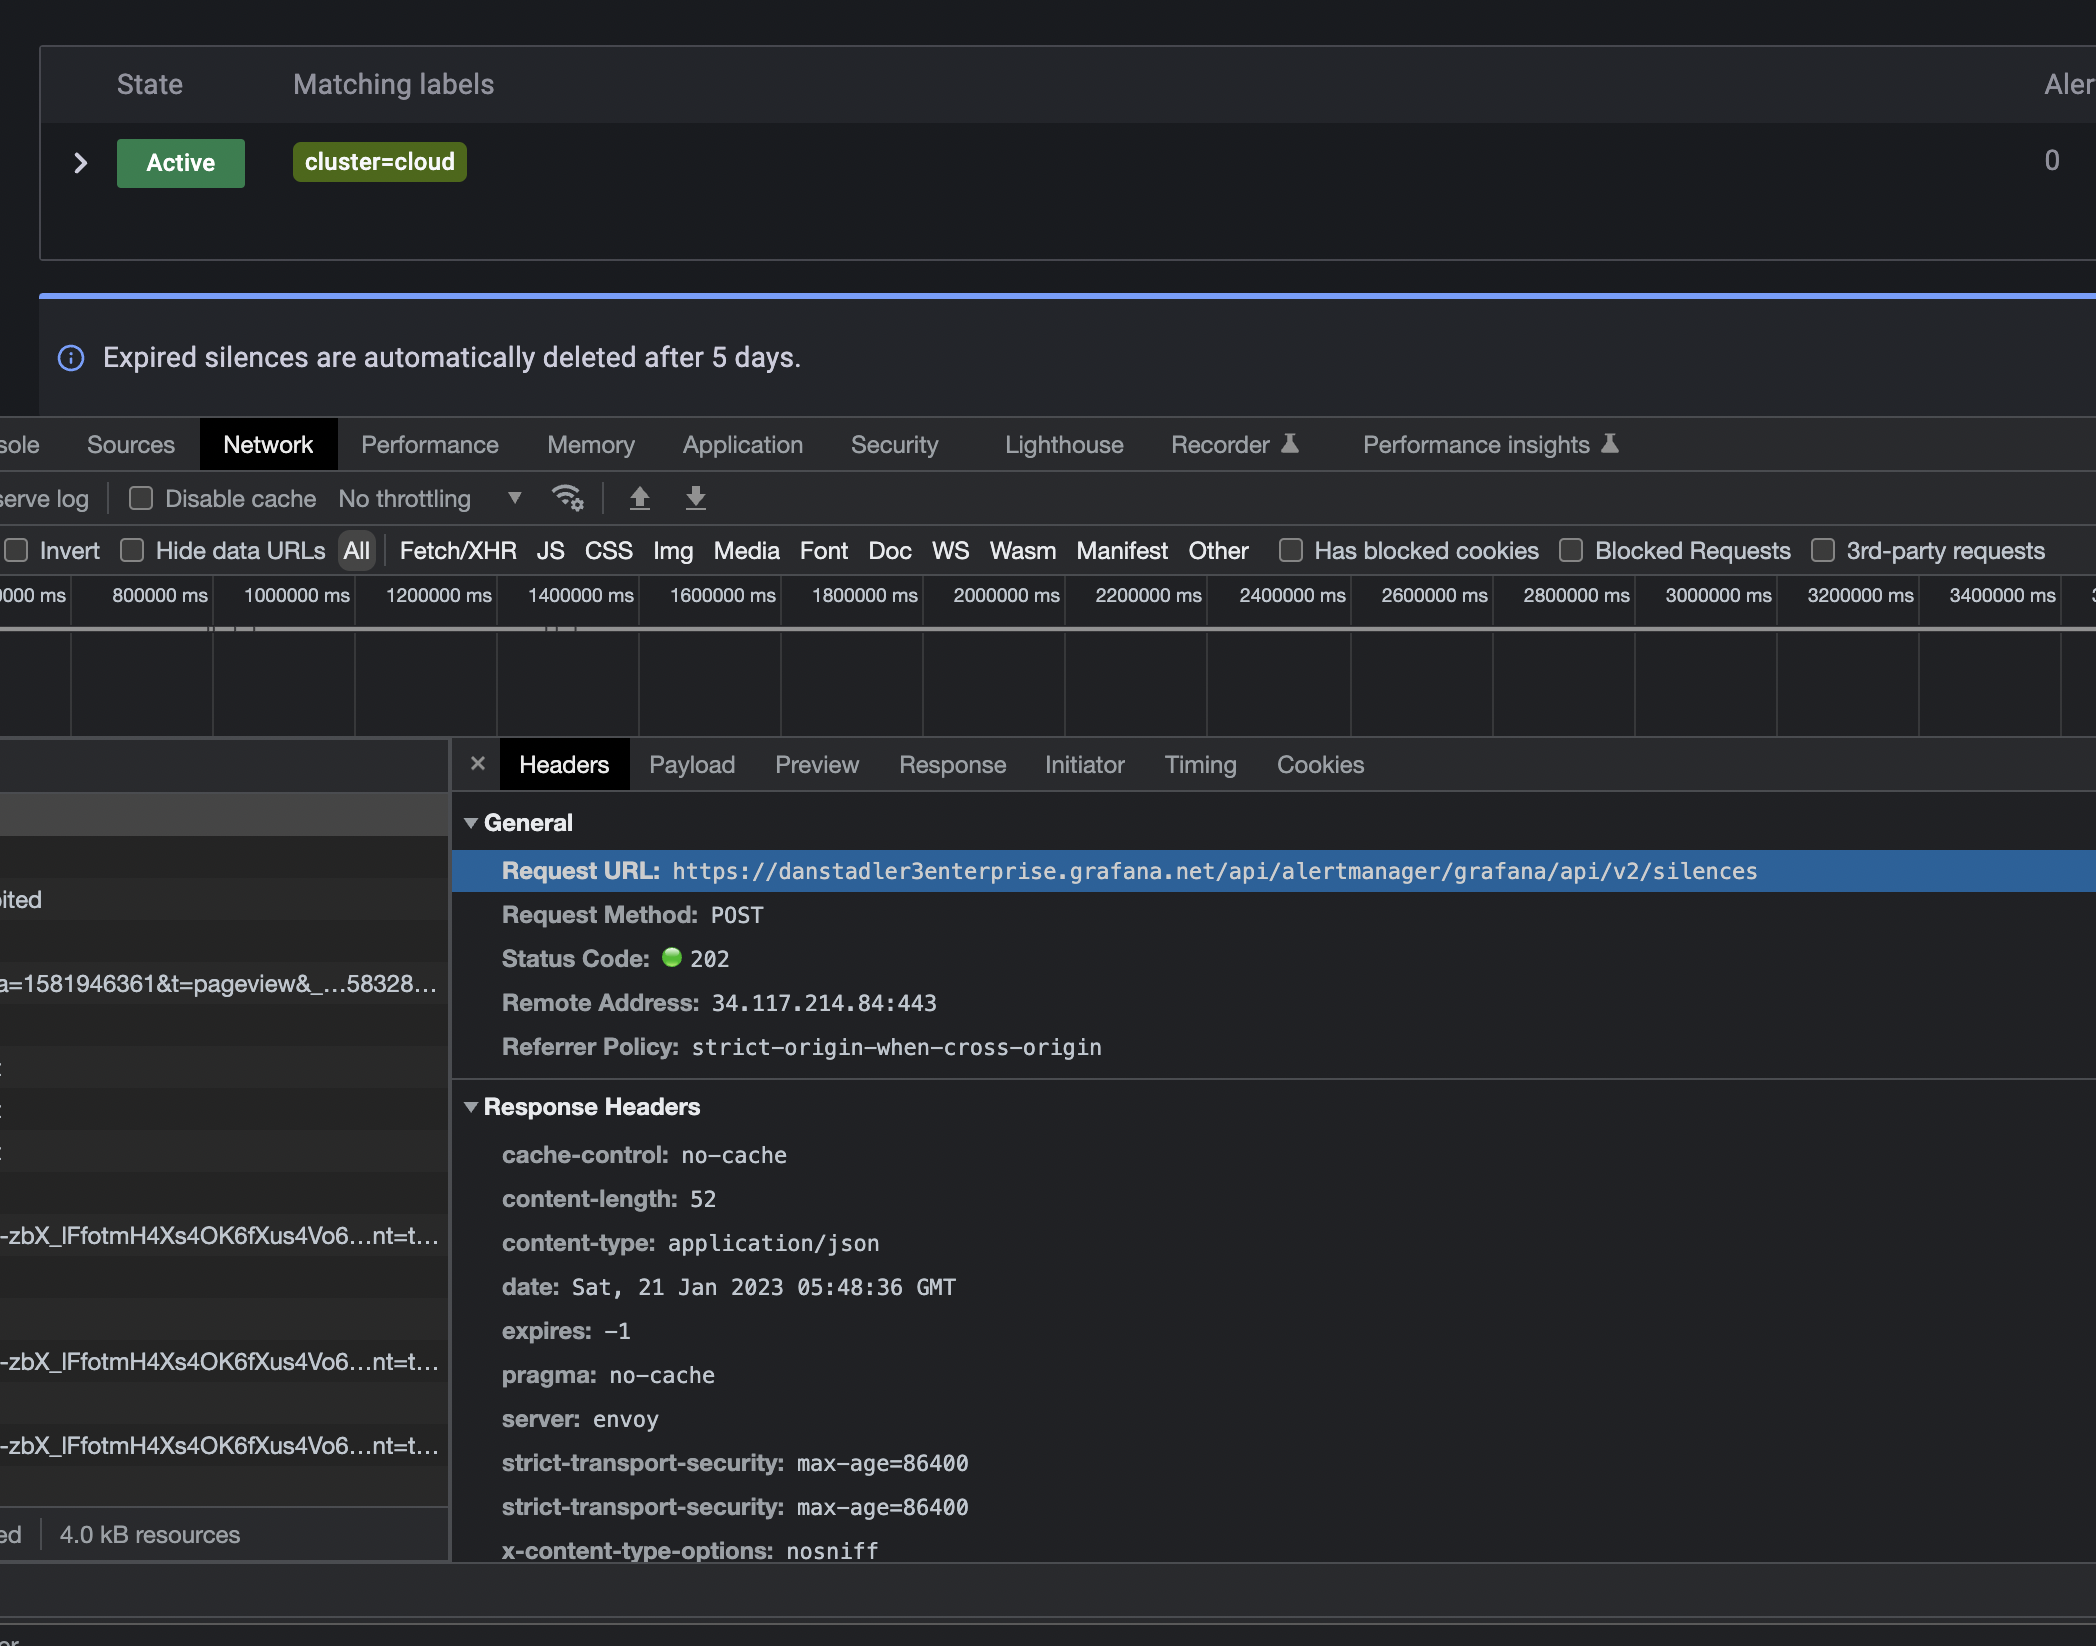
The /api/v2/silences endpoint is vital for reducing "alert fatigue." Silences allow operators to suppress notifications for a specific period based on label matchers. Through the API, silences can be created, updated, and deleted. This is frequently integrated into CI/CD pipelines. For example, when a deployment begins, a script can call the API to create a 15-minute silence for the specific service being updated, preventing false positive alerts caused by temporary service restarts.
A silence object requires a start time, an end time, and a set of matchers. It also requires the name of the creator and a comment. This metadata is essential for auditing purposes, ensuring that teams know who silenced an alert and why. The API ensures that silences are synchronized across all nodes in an Alertmanager high-availability (HA) cluster using the Gossip protocol, meaning a silence created on one node will eventually propagate to all others.
System Status and Configuration
The /api/v2/status endpoint provides critical information about the Alertmanager instance itself. It returns the current configuration (as parsed from the YAML file), uptime, version information, and the status of the cluster (mesh) nodes. Monitoring this endpoint is a best practice for ensuring that the alerting pipeline itself is healthy. If the configuration fails to load due to a syntax error during a reload, the status endpoint will reflect the error, allowing for rapid remediation.
Technical Specifications for Alert Integration
When integrating with the API, developers must adhere to the specific schema defined in the OpenAPI documentation. The precision of the label set is the most common point of failure in API integrations.
| Endpoint | Method | Primary Purpose | Key Parameters |
|---|---|---|---|
| /api/v2/alerts | POST | Ingest new alerts | Labels (Identity), Annotations (Metadata) |
| /api/v2/alerts | GET | Query active alerts | Filter (Matchers), Silenced, Inhibited |
| /api/v2/silences | POST | Create/Update silence | StartTime, EndTime, Matchers, Comment |
| /api/v2/silences | GET | List silences | Filter (Matchers) |
| /api/v2/status | GET | Check system health | Version, Config, Mesh Status |
| /api/v2/receivers | GET | List notification targets | N/A |
Data Structure Requirements
For an alert to be accepted by the POST /api/v2/alerts endpoint, it must be an array of objects. Even a single alert must be wrapped in a JSON array. Each object must contain a labels map. In 2026, it is standard practice to include at least an alertname label. Without a consistent naming convention, routing rules in the Alertmanager configuration will fail to match the incoming alert, often leading to the alert being sent to a "default" receiver or being dropped if no catch-all exists.
The generatorURL field is another important component. It provides a back-link to the system that generated the alert. For Prometheus, this is the link to the specific rule expression. For custom API integrations, this should point to the source system's diagnostic page or log aggregator.
Security and Authentication Strategies
By default, Alertmanager does not provide a built-in authentication layer for its API. In a production environment, exposing the API directly to the internet or even an internal untrusted network is a significant security risk, as any user could theoretically silence all production alerts.
Reverse Proxy Implementation
The most common way to secure the Alertmanager API is through a reverse proxy like Nginx, Apache, or Envoy. These proxies can handle TLS termination and enforce authentication via Basic Auth, OAuth2, or LDAP. By placing Alertmanager behind a proxy, you can also implement IP whitelisting, ensuring that only Prometheus servers and authorized automation runners can POST new alerts.
RBAC and Service Meshes
In Kubernetes-native environments, the use of a Service Mesh (like Istio or Linkerd) or an API Gateway (like Kong or Ambassador) is preferred. These tools allow for fine-grained Role-Based Access Control (RBAC). For instance, a dashboard might only need GET access to the /api/v2/alerts endpoint, while an automated deployment tool needs POST access to /api/v2/silences. In 2026, many organizations use Open Policy Agent (OPA) alongside their ingress controllers to validate the content of API requests to Alertmanager, ensuring that no unauthorized silences are created with excessively long durations.
Advanced Integration Scenarios
Beyond simple alert ingestion, the Alertmanager API enables complex workflows that bridge the gap between monitoring and incident management.
Synchronizing Maintenance Windows
Large enterprises often maintain a central calendar for infrastructure maintenance. By writing a small middleware service that polls this calendar and interacts with the Alertmanager /api/v2/silences endpoint, teams can ensure that monitoring is automatically suppressed during scheduled work. This integration prevents the "crying wolf" effect, where engineers start ignoring alerts because they assume a maintenance task is occurring.
Custom Webhook Receivers
While the API is used to get data into Alertmanager, the "webhook" receiver is the primary way to get data out of Alertmanager to an external system. A webhook integration is technically a reverse API integration: Alertmanager acts as the client and calls a custom API that you provide. This is used to trigger automated remediation scripts—such as restarting a pod or scaling a cluster—in response to a specific alert. When Alertmanager calls a webhook, it sends a JSON payload containing all the alerts in a group, their status (firing or resolved), and their associated labels and annotations.
Building Custom Dashboards
While Grafana is the industry standard for visualizing Prometheus data, some organizations require highly specialized "Event Consoles" that aggregate data from multiple Alertmanager clusters. By querying the GET /api/v2/alerts endpoint across different regions, a central dashboard can present a global view of infrastructure health. This is particularly useful for Managed Service Providers (MSPs) who need to monitor hundreds of disparate client environments through a single interface.
Common Mistakes and Troubleshooting
Integration with any API comes with pitfalls. With Alertmanager, these usually revolve around timing, deduplication, and network topology.
- Clock Skew: Alertmanager is highly sensitive to time. If a system sends an alert via the API with a timestamp in the far past or future, Alertmanager may ignore it or resolve it immediately. Always ensure that the integrating system and the Alertmanager host are synchronized via NTP.
- Deduplication Failures: If an integration script generates slightly different labels for the same logical event (e.g., including a unique timestamp in a label), Alertmanager will treat every request as a new, unique alert. This leads to a notification storm. Labels should be used for identity; timestamps belong in annotations.
- Silence Overlap: When creating silences programmatically, it is easy to create overlapping or redundant silences. While this doesn't break Alertmanager, it makes the UI difficult to navigate and can make it hard to determine why a specific alert is not firing.
- Improper JSON Headers: The API requires the
Content-Type: application/jsonheader. Omitting this often results in a 415 Unsupported Media Type error, which can be confusing for developers used to more forgiving APIs.
To troubleshoot these issues, the first step should always be to check the Alertmanager logs. Alertmanager is quite verbose about why it rejects a payload, whether it's a schema validation error or an authentication failure at the proxy level.
Comparing Alertmanager API with Other Monitoring APIs
In the broader monitoring ecosystem, the Alertmanager API is often compared to the APIs of PagerDuty, Opsgenie, or Datadog.
| Feature | Alertmanager API (v2) | Cloud-Native SaaS APIs |
|---|---|---|
| Primary Focus | Alert routing and suppression | Incident lifecycle management |
| Data Format | OpenAPI / JSON | Proprietary JSON / GraphQL |
| High Availability | Built-in via Gossip protocol | Managed by provider |
| Filtering | Label-based matchers | Multi-faceted query languages |
| Extensibility | High (Custom Webhooks) | High (Integrations Marketplace) |
| Cost | Free (Open Source) | Usage-based / Tiered |
While SaaS providers offer more "out of the box" features like on-call scheduling and automated escalation, the Alertmanager API provides the flexibility needed for organizations that want to maintain full control over their alerting logic and data sovereignty.
Frequently Asked Questions
How do I delete an active alert via the API?
You cannot explicitly "delete" an alert in Alertmanager. Alerts in Alertmanager are either "firing" or "resolved." To stop an alert from firing, the source system (the one that POSTed the alert) must stop sending it, or it must send a version of the alert with an endsAt timestamp in the past. If the alert was generated by Prometheus, you must address the underlying condition or silence it.
Can I update the Alertmanager configuration via an API call?
There is no specific endpoint to "PUT" a new YAML configuration file in the standard Alertmanager API for security reasons. However, you can trigger a configuration reload by sending a POST request to the /-/reload endpoint. This tells Alertmanager to re-read the configuration file from the disk. In Kubernetes, this is often handled by a "config-reloader" sidecar that watches for ConfigMap changes.
What is the difference between labels and annotations in the API?
Labels are used to identify the alert and determine how it is grouped and silenced. If any label changes, Alertmanager considers it a new alert. Annotations are used to provide additional information that doesn't change the identity of the alert, such as instructions for an engineer or a link to a dashboard. Changing an annotation will update the existing alert rather than creating a new one.
Is the v1 API still supported in 2026?
While many legacy systems may still attempt to use the v1 API, it has been effectively superseded by v2. Most modern Alertmanager distributions keep v1 for backward compatibility, but it lacks the formal schema validation and efficiency of v2. It is highly recommended to migrate all integrations to the OpenAPI-based v2 endpoints to ensure long-term support and better tooling.
How does Alertmanager handle duplicate alerts sent via the API?
Alertmanager uses the entire set of labels to create a unique hash for each alert. If it receives a second alert with the exact same labels, it updates the existing alert's metadata and extends its timeout. It does not send a new notification unless the alert had previously been marked as resolved. This deduplication happens before any grouping or routing logic is applied.
Recommendation for Successful Integration
For teams beginning their Alertmanager API integration journey, the most effective first step is to adopt a client-side library generated from the official OpenAPI specification. Rather than writing raw HTTP requests, using a generated client ensures that your data structures always match the expected schema.
Furthermore, every API integration should be accompanied by a robust set of "dead man's switch" alerts. Since the API is a critical component of the notification chain, you must have a way to know if your integration script or the Alertmanager API itself fails. Using a service like Prometheus's Watchdog alert, which is designed to fire 100% of the time and be silenced only by a successful end-to-end flow, ensures that if the API integration breaks, you will be notified through an independent channel.