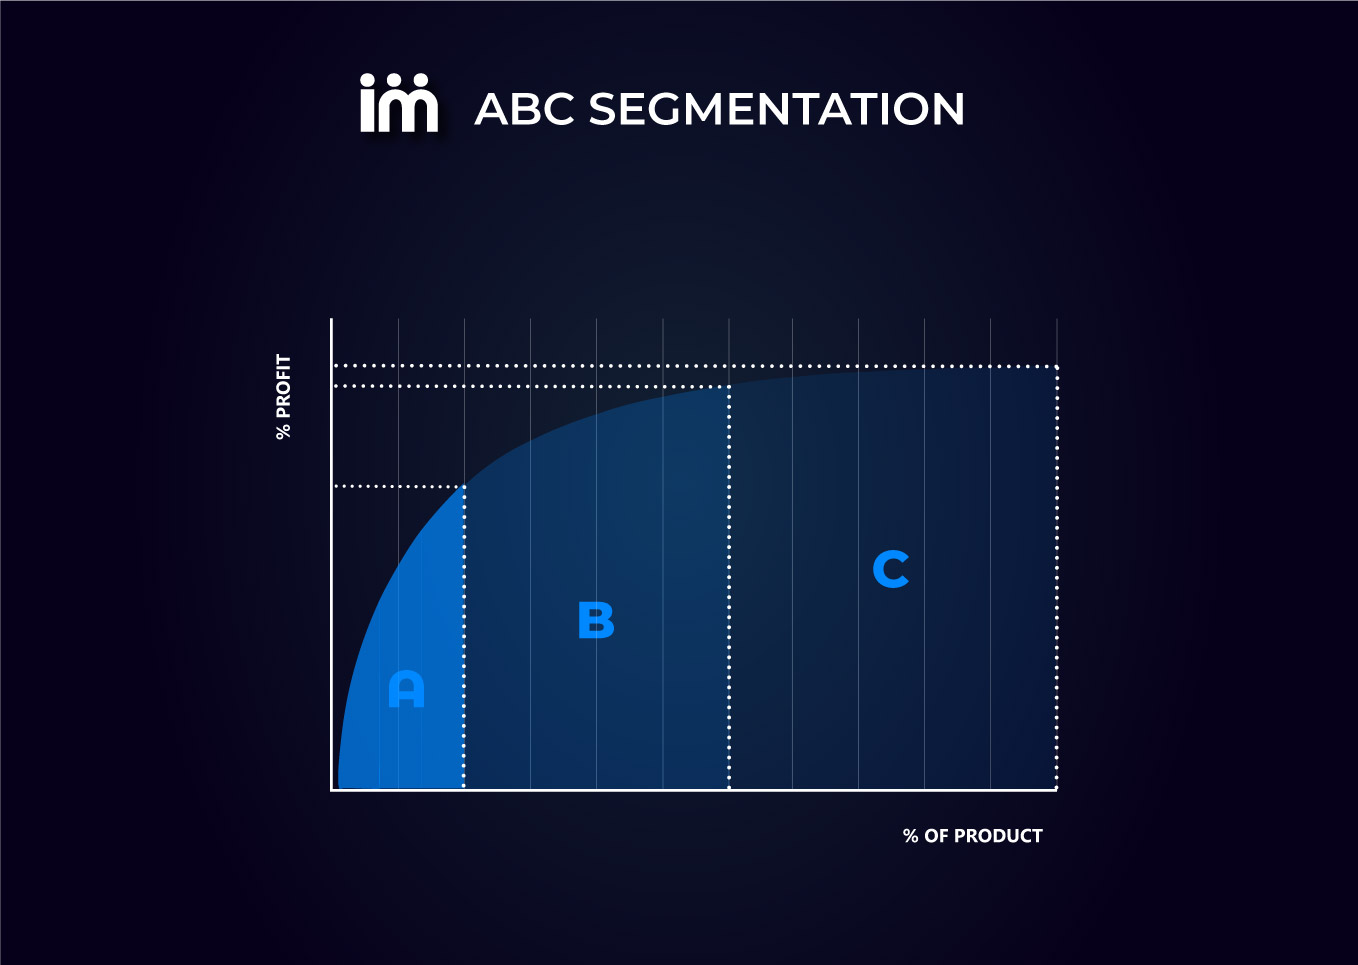
The ABC inventory method is an inventory categorization technique based on the Pareto principle, which posits that roughly 80% of a company’s inventory value comes from 20% of its items. By dividing stock into Class A, Class B, and Class C categories, businesses can allocate resources, time, and storage capital efficiently to high-value assets.
Understanding the Foundation of Inventory Prioritization
Managing physical stock in a warehouse, retail backroom, or distribution center presents a perpetual challenge for supply chain managers. Trying to give every single SKU (Stock Keeping Unit) the exact same level of attention, security, and cycle-counting frequency is not only inefficient; it is economically unsustainable. Resources—ranging from working capital to labor hours and secure storage space—are always finite. Recognizing this operational constraint requires adopting a systematic approach to asset classification.
The ABC inventory method serves as a primary framework for solving this allocation puzzle. Rooted in the economic principle known as the Pareto Principle (or the 80/20 rule), this methodology establishes that a small fraction of inventory drives the vast majority of financial value and operational impact. By segmenting stock based on consumption value, demand frequency, and financial return, organizations transition from a reactive, blanket approach to inventory control into a targeted, data-driven strategy.
Adopting this practice ensures that high-value assets receive rigorous oversight while low-value, high-volume items are managed through streamlined, automated processes. Consequently, organizations can minimize holding costs, reduce the risk of stockouts for critical products, and optimize warehouse labor efficiency.
The Core Concept: The Pareto Principle in Inventory Management
To successfully apply the ABC method, one must understand the underlying distribution model. The Pareto Principle, originally observed by economist Vilfredo Pareto regarding wealth distribution, manifests clearly in supply chain management. Typically, inventory distribution follows a predictable tripartite breakdown rather than a rigid rule, though the 80/20 proportion acts as a foundational benchmark:
- Class A Items: Represent roughly 70% to 80% of the total annual consumption value, yet they account for only about 10% to 20% of the total physical inventory items in stock.
- Class B Items: Represent roughly 15% to 25% of the annual consumption value, while accounting for roughly 30% to 40% of the total physical inventory items.
- Class C Items: Represent roughly 5% of the annual consumption value, but comprise a massive 50% to 60% of the total physical inventory items.
This inverse relationship between item count and financial value dictates how management resources must be distributed. Neglecting Class A items creates severe cash flow bottlenecks and catastrophic stockout risks. Conversely, spending excessive manual labor tracking Class C items wastes operational expenditure on goods that yield minimal financial return.
Step-by-Step Implementation of the ABC Inventory Method
Implementing the ABC classification system requires a disciplined sequence of data collection, mathematical calculation, and operational adjustment. Skipping preliminary data preparation or miscalculating annual usage value compromises the integrity of the entire inventory strategy.
Step 1: Data Gathering and Aggregation
Before performing any categorization, assemble a comprehensive dataset for all active SKUs over a defined historical period—typically the past twelve months. This dataset must include:
- The unique SKU identifier and product description.
- The total units sold or consumed within the period.
- The unit cost of acquisition or production for each item.
- Any associated holding, shipping, or carrying costs if available, though unit cost serves as the primary baseline.
Step 2: Calculating Annual Consumption Value
For each SKU, multiply the total number of units consumed or sold annually by the individual unit cost. This calculation yields the annual consumption value (ACV) or annual usage value, which serves as the ranking metric.
$$\text{Annual Consumption Value (ACV)} = \text{Annual Units Sold} \times \text{Unit Cost}$$
Step 3: Ranking and Sorting SKUs
Arrange the entire inventory list in descending order based on their calculated ACV, placing the highest financial contributors at the top and the lowest at the bottom.
Step 4: Cumulative Value Percentage Calculation
Calculate the cumulative value of the inventory. Add a running total column that sums the ACV of each item alongside all preceding items. Then, convert these running totals into a cumulative percentage of the overall inventory budget.
Step 5: Assigning Classifications (A, B, and C)
Review the cumulative percentage list and establish boundary thresholds. Items that accumulate the top 80% of the total value are designated as Class A. Items falling between 80% and 95% cumulative value are designated as Class B. The remaining items that round out the final 100% of value are categorized as Class C. Note that these percentages are guidelines; organizations frequently adjust thresholds based on industry specifics, such as perishable goods or high-security luxury retail.
| Category | Typical Annual Value % | Typical Item Count % | Management & Control Intensity | Cycle Counting Frequency |
|---|---|---|---|---|
| Class A | 70% – 80% | 10% – 20% | Maximum oversight, strict security, accurate forecasting | Continuous / Weekly |
| Class B | 15% – 25% | 30% – 40% | Moderate oversight, periodic reviews, standard reordering | Monthly / Quarterly |
| Class C | 5% | 50% – 60% | Minimal oversight, automated bulk reordering, loose security | Bi-annually / Annually |
Operational Differences Across Categories A, B, and C
Categorizing stock is only the administrative starting point. The true utility of the ABC method lies in executing distinct, tailored operational policies for each class. Treating every category uniformly nullifies the benefits of the segmentation process.
Managing Class A: High-Value Precision
Class A stock demands stringent management protocols. Because these items tie up a vast majority of working capital, carrying excess stock creates severe financial liquidity strains. Conversely, running out of a Class A item halts revenue generation immediately.
Consequently, organizations must implement tight inventory controls:
- Reorder Points and Safety Stock: Utilize rigorous demand forecasting models, such as probabilistic inventory formulas, rather than static rule-of-thumb minimums. Maintain lower safety buffers relative to total volume because holding excess Class A stock is prohibitively expensive, yet monitor lead times obsessively.
- Physical Security: Store Class A items in high-security, climate-controlled, or restricted-access zones within the warehouse to prevent shrinkage, theft, or damage.
- Inventory Auditing: Conduct frequent cycle counts—often weekly or even daily for exceptionally high-value goods—to catch discrepancies immediately before they compound into systemic shortages or financial write-offs.
Managing Class B: Balanced Control
Class B items serve as the transitional bridge between high-value core products and low-value accessory goods. They require balanced oversight that prevents excessive management overhead while protecting against supply chain disruptions.
- Reorder Points and Safety Stock: Employ standard MRP (Material Requirements Planning) software or automated reorder point triggers based on historical moving averages. Safety stock levels should be moderate to absorb standard demand spikes without inflating holding costs.
- Physical Security: Store Class B items in accessible general warehouse racking, balancing pick efficiency with standard inventory security protocols.
- Inventory Auditing: Schedule cycle counts on a monthly or quarterly basis to verify stock accuracy and recalibrate demand forecasting parameters.
Managing Class C: Automated Efficiency
Class C items are characterized by high volume, low unit cost, and steady, predictable demand. The primary risk with Class C inventory is not financial loss from holding excess stock, but rather the administrative labor cost of managing them. Spending hours manually counting cheap fasteners or packaging materials destroys profit margins.
- Reorder Points and Safety Stock: Use Two-Bin inventory systems, Kanban cards, or automated vendor-managed inventory (VMI) setups. Order these items in large bulk batches to minimize administrative and shipping overhead.
- Physical Security: Store Class C items in high-density, low-traffic areas of the warehouse, or near packing stations where they are consumed rapidly without requiring secure enclosures.
- Inventory Auditing: Perform physical audits infrequently—typically biannually or annually—relying on periodic spot-checks or bulk reconciliation rather than resource-heavy cycle counts.
Advantages of Implementing the ABC Inventory Method
Adopting a prioritized inventory strategy yields measurable benefits across operational, financial, and managerial dimensions.
- Optimized Working Capital: By controlling the quantities of high-value Class A items, businesses free up trapped cash that would otherwise sit idle on warehouse shelves as excess stock.
- Reduced Stockout Rates for Critical Goods: Focusing forecasting efforts and safety stock investments on Class A products ensures that key revenue-generating items remain consistently available to customers.
- Improved Warehouse Labor Efficiency: Staff spend less time manually auditing low-value, high-volume items and can direct their efforts toward high-precision picking, packing, and quality control.
- Enhanced Supplier Management: Clear visibility into consumption values allows purchasing managers to negotiate better volume discounts on bulk Class C items while establishing tighter SLA (Service Level Agreement) terms with suppliers of critical Class A stock.
Limitations and Common Implementation Pitfalls
While powerful, the ABC inventory method is not a universal panacea. Uncritical application can lead to operational blind spots if management fails to account for real-world complexities.
- Over-reliance on Financial Value Alone: Traditional ABC analysis ranks items solely by annual consumption value. This creates a critical flaw: a low-cost, inexpensive component (such as a specialized microchip worth $2) might be classified as a Class C item due to its low unit cost, yet its absence could completely halt the assembly of a million-dollar Class A finished product. To mitigate this, organizations must incorporate criticality analysis alongside financial valuation.
- Static Classifications in Dynamic Markets: Consumer demand fluctuates, seasonal trends shift, and supplier prices inflate or deflate. Treating ABC categories as permanent, unchanging assignments leads to outdated strategies. Classifications must be reviewed and updated periodically—typically on a quarterly or annual basis.
- Data Accuracy Dependencies: If the underlying historical sales data, bill of materials, or unit cost figures are inaccurate, the resulting categorization will be flawed. Garbage-in, garbage-out dynamics apply directly to inventory modeling.
Advanced Variations: Multi-Criteria ABC Analysis
To address the limitations of single-criterion financial valuation, modern supply chain professionals utilize multi-criteria ABC analysis. Rather than sorting solely by annual consumption value, this advanced approach integrates multiple operational dimensions into the prioritization matrix.
Common secondary and tertiary criteria include:
- Lead Time: Long-lead-time items carry higher operational risk and may warrant higher classification priority regardless of unit cost.
- Criticality/Vulnerability: Items with no available substitutes or components vital to safety and regulatory compliance are elevated in priority.
- Stockout Consequence: The operational or financial penalty associated with running out of a specific SKU.
- Obsolescence Risk: Items prone to rapid technological degradation or short shelf-lives require tighter inventory velocity tracking.
Integrating these factors transforms a basic financial ranking into a robust, risk-adjusted inventory management framework that protects supply chain resilience while preserving working capital.
Frequently Asked Questions
How often should an ABC inventory analysis be updated?
Organizations typically review and update their ABC classifications annually, though fast-moving industries with high volatility or seasonal product lifecycles may perform reviews on a quarterly basis. Regular reviews ensure that shifting demand patterns do not leave high-value products mismanaged in lower categories.
Can the ABC method be combined with FIFO or LIFO accounting?
Yes. The ABC inventory method is an operational stock control and prioritization technique, whereas FIFO (First-In, First-Out) and LIFO (Last-In, First-Out) are financial cost-flow assumptions used for accounting and tax valuation. They operate independently and complement each other within a well-managed business.
What happens if a Class C item suddenly experiences a massive spike in demand?
If a Class C item experiences sudden, sustained demand growth, its annual consumption value will rise accordingly. During the next periodic review, the item will automatically transition into a Class B or Class A category, triggering tighter management controls, increased safety stock parameters, and more frequent auditing.
Does the ABC method apply to service industries or intangible assets?
While most commonly deployed in physical warehousing, retail, and manufacturing, the underlying principle of prioritizing resources based on value concentration applies broadly. For example, service firms can categorize client accounts, project types, or support ticket resolutions using parallel tiered frameworks to optimize staff allocation.
Conclusion and Next Actions
Implementing the ABC inventory method transforms chaotic warehousing operations into a structured, capital-efficient system. Begin by auditing your historical sales and unit cost data, calculating annual consumption values, and sorting your SKUs in descending order. Establish realistic boundary thresholds to divide your inventory into Classes A, B, and C, and immediately align your security, auditing, and reorder policies with each tier's specific operational requirements.