In 2011, for Super Bowl XLV, the average cost of a 30-second commercial reached a landmark $3 million. This price point marked a significant recovery for the advertising industry following the global financial crisis, with broadcaster FOX selling out its inventory months in advance as brands competed for a record-breaking audience of 111 million viewers.
The 2011 Super Bowl, which saw the Green Bay Packers face off against the Pittsburgh Steelers, remains a watershed moment in the history of sports marketing. It was the year that advertising rates officially "bounced back" from the stagnant levels of the late 2000s, signaling a renewed corporate confidence. Beyond the raw numbers, 2011 was the year the "Social Super Bowl" was born, as brands began to integrate digital calls-to-action and long-form storytelling into their multimillion-dollar investments.
The Economic Climate: From Recession to Recovery
To understand why the 2011 Super Bowl ad rates were so significant, one must look at the preceding three years. Following the 2008 housing market crash, the advertising sector faced unprecedented austerity. In 2009 and 2010, many traditional heavy hitters—particularly in the automotive and financial sectors—either pulled out of the Big Game or negotiated heavily to keep rates flat.
By late 2010, when FOX began selling slots for the February 2011 game, the narrative had changed. The U.S. economy was showing signs of stabilization, and consumer spending was on the rise. Advertisers who had been "playing it safe" felt the pressure to re-establish market dominance. This surge in demand allowed FOX to push the average rate for a 30-second spot to $3 million, a jump from the $2.5 million to $2.8 million range seen in 2010.
The Early Sell-Out Phenomenon
One of the most telling indicators of the 2011 market strength was the speed at which inventory disappeared. FOX announced as early as October 2010 that it had sold 90% of its Super Bowl inventory. By the time January 2011 arrived, only a handful of "floating" spots remained, which reportedly commanded premiums even higher than the $3 million average. This "scarcity mindset" allowed the network to maintain a hard line on pricing, a stark contrast to the 2009 season when NBC was still searching for buyers in the final weeks before kickoff.
Breaking Down the $3 Million Investment
When a brand spent $3 million in 2011, they weren't just buying 30 seconds of airtime; they were buying a guaranteed audience that accounted for nearly half of all American households with a television. At $100,000 per second, the Super Bowl was—and remains—the most expensive "beachfront property" in the media landscape.
Production Costs vs. Media Buy
It is a common misconception that the $3 million ad rate was the total cost of a Super Bowl campaign. In 2011, high-tier production costs for a 30-second spot often equaled or exceeded the media buy itself. Brands like Coca-Cola, PepsiCo, and Anheuser-Busch spent between $1 million and $5 million on production alone, hiring A-list directors and utilizing advanced CGI. When factoring in the $3 million airtime fee, a single commercial could represent an $8 million gamble for a corporation.
Cost Per Thousand (CPM) Analysis
From a technical SEO and marketing perspective, the value of the 2011 Super Bowl was often measured through CPM (Cost Per Thousand viewers). With 111 million viewers, a $3 million ad resulted in a CPM of approximately $27.02. While this is higher than standard prime-time television (which hovered around $15 to $20 in 2011), the Super Bowl offered something no other program could: "active" viewership. During the Super Bowl, the commercials are considered part of the entertainment, meaning the "skip rate" or "bathroom break" rate is significantly lower than during regular programming.
Historical Comparison of Super Bowl Ad Rates
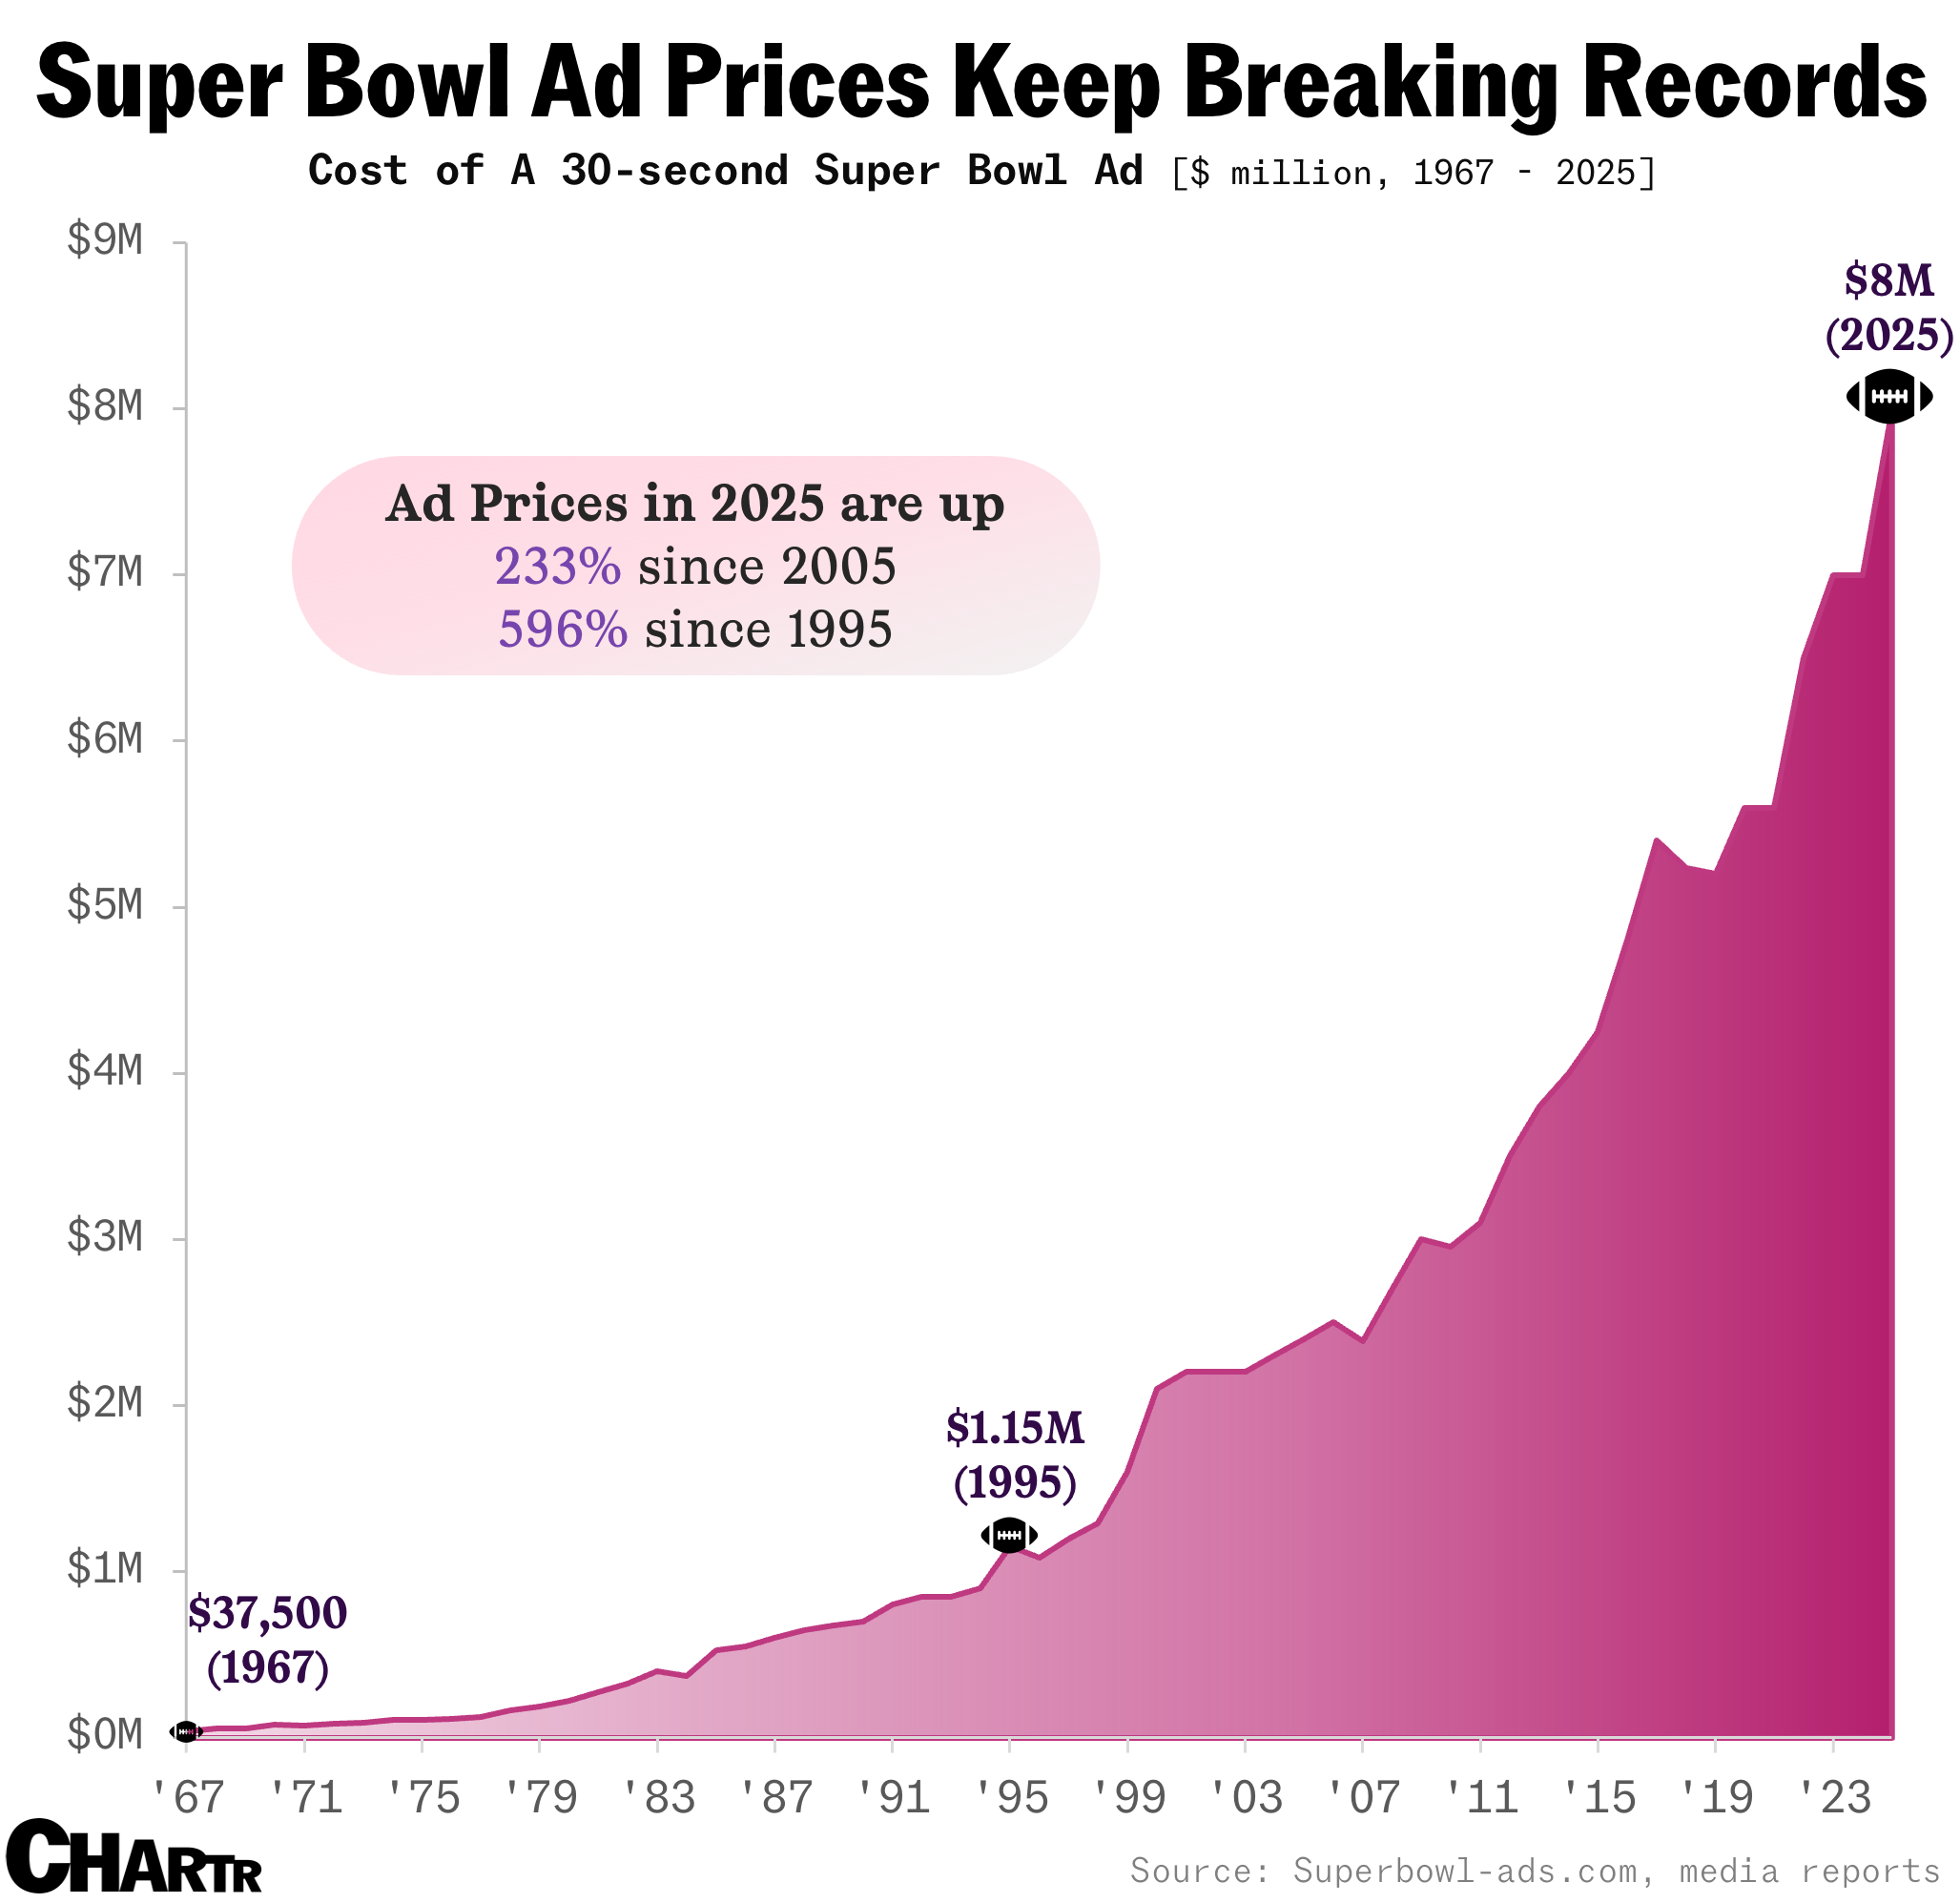
To contextualize the 2011 rates, it is helpful to look at the progression of pricing in the years surrounding Super Bowl XLV. The following table illustrates the steady climb of advertising costs during this era.
| Super Bowl Year | Host Network | Avg. Cost for 30-Second Spot | Total Viewership (Approx.) |
|---|---|---|---|
| 2008 (XLII) | FOX | $2.7 Million | 97.5 Million |
| 2009 (XLIII) | NBC | $3.0 Million* | 98.7 Million |
| 2010 (XLIV) | CBS | $2.5 - $2.8 Million | 106.5 Million |
| 2011 (XLV) | FOX | $3.0 Million | 111.0 Million |
| 2012 (XLVI) | NBC | $3.5 Million | 111.3 Million |
| 2013 (XLVII) | CBS | $3.8 Million | 108.7 Million |
*Note: While some 2009 spots hit $3M, the average was pulled down by late-cycle discounting during the recession.
Case Studies: The 2011 Ad Pioneers
The 2011 Super Bowl was the year of the "Cinematic Commercial." Two specific ads from this year are still studied in marketing textbooks for how they justified their $3 million (and higher) investments.
Chrysler: "Born of Fire"
Chrysler took a massive risk by purchasing a two-minute slot—effectively four 30-second units—costing the company roughly $12 million in airtime alone. Featuring Eminem and the tagline "Imported from Detroit," the ad was a gritty, high-production tribute to the American auto industry's resilience. It didn't just sell the Chrysler 200; it sold a brand identity. The investment paid off in "earned media," as the ad was discussed on news programs and late-night talk shows for weeks following the game.
Volkswagen: "The Force"
Volkswagen’s "The Force" ad, featuring a child dressed as Darth Vader trying to use his powers on a VW Passat, changed Super Bowl marketing forever. While they paid the standard $3 million rate for the spot, VW released the ad on YouTube days before the game. This was a radical move at the time. By the time the kickoff occurred, the ad had already gone viral. This strategy maximized the ROI of the $3 million buy by ensuring the brand had already captured millions of views for "free" before the television audience even saw it.
The Technological Shift: Birth of the "Social Super Bowl"
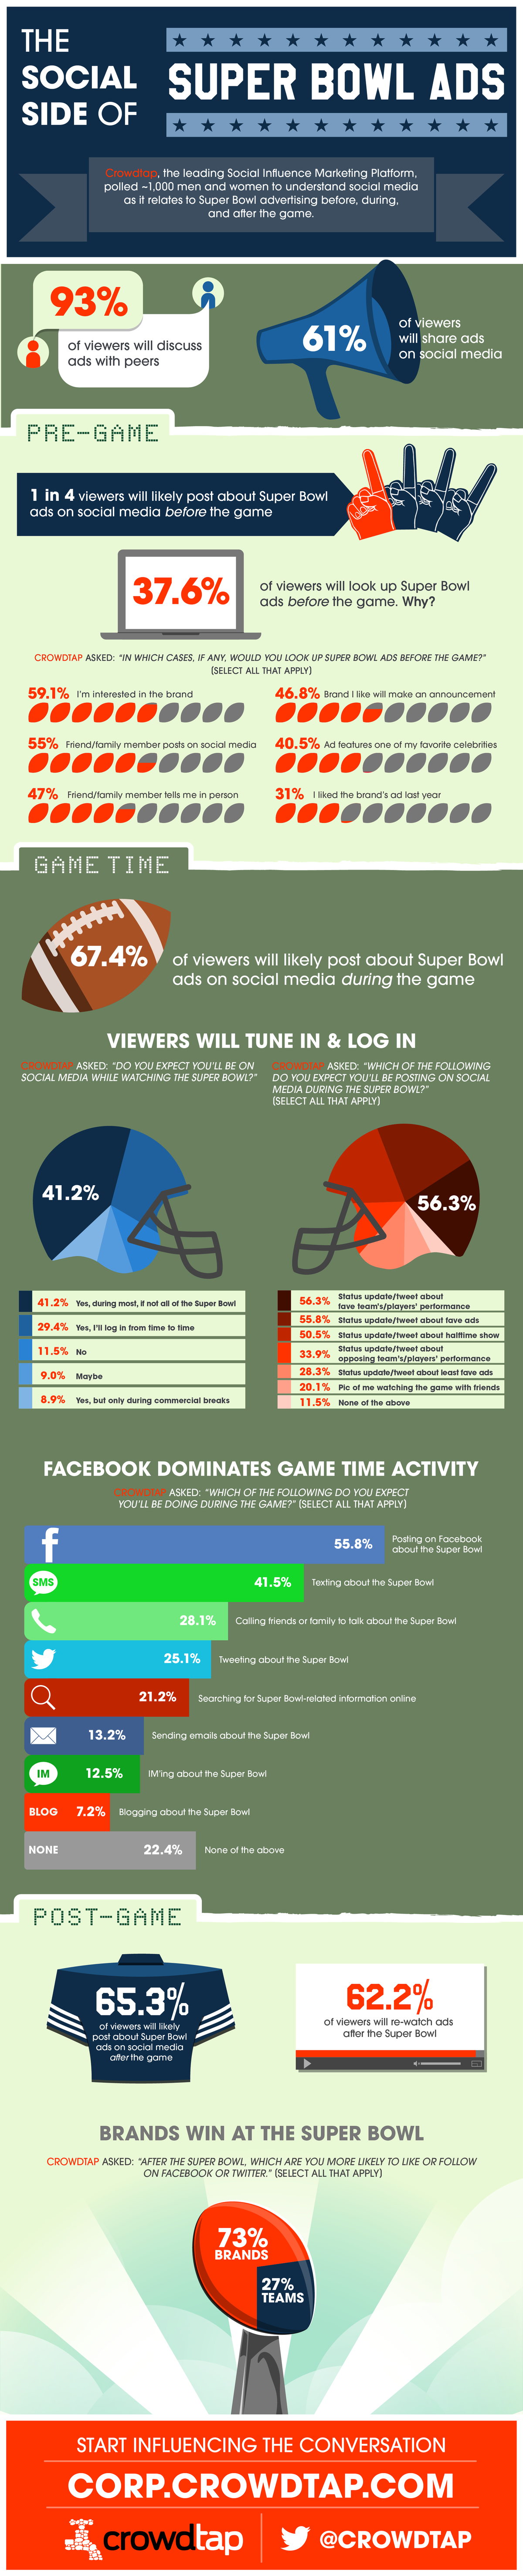
In 2011, the ROI of a Super Bowl ad began to be measured by more than just sales lift or Nielsen ratings. This was the first year that social media integration became a requirement rather than an afterthought.
- Hashtag Integration: While still in its infancy, 2011 saw the first wave of brands including Twitter hashtags in their television creative.
- Facebook Interaction: Brands like Audi and Doritos encouraged viewers to "Like" their pages to see extended cuts or participate in contests.
- YouTube as a Second Screen: The 2011 game saw a record number of searches for "Super Bowl commercials" on mobile devices during the game, proving that the $3 million investment was now competing for attention with the smartphones in viewers' hands.
This shift meant that the $3 million ad rate was no longer the "end" of the campaign but the "launch" of a multi-platform conversation. Marketing executives began to realize that if an ad didn't trend on Twitter or gain traction on Facebook, the $3 million spend was considered a partial failure.
Factors That Influenced the 2011 Pricing
Several micro-factors contributed to FOX’s ability to demand $3 million per spot in 2011:
- The Matchup: The Green Bay Packers and Pittsburgh Steelers are two of the most storied franchises in the NFL with massive, national fan bases. Networks know that "Blue Chip" teams drive higher ratings, which in turn justifies higher ad rates.
- The Return of Dot-Coms: After the dot-com bubble burst in 2000, tech companies were wary of Super Bowl spending. By 2011, a new generation of tech firms (like GoDaddy and various social apps) were ready to spend big to gain mainstream legitimacy.
- Automotive Resurgence: With the government bailout of GM and Chrysler in the rearview mirror, the auto sector returned to the Super Bowl in force, creating a bidding war for the limited number of slots available in that category.
Frequently Asked Questions
Which brand spent the most on advertising during the 2011 Super Bowl?
Anheuser-Busch InBev is traditionally the largest spender, as they hold an exclusive category sponsorship (alcohol). In 2011, they purchased multiple minutes of airtime across several spots for Bud Light and Stella Artois, totaling an estimated investment exceeding $25 million when including production and activation.
Why did the rates drop in 2010 before rising back to $3 million in 2011?
The 2010 rates reflected the "lag time" of the 2008-2009 recession. Advertising budgets are often set 6–12 months in advance. By the time 2010 rolled around, corporations were still in a cost-cutting phase. The 2011 rate increase was the result of a "coiled spring" effect where pent-up marketing demand finally broke through as the economy improved.
How does the 2011 rate compare to current 2026 standards?
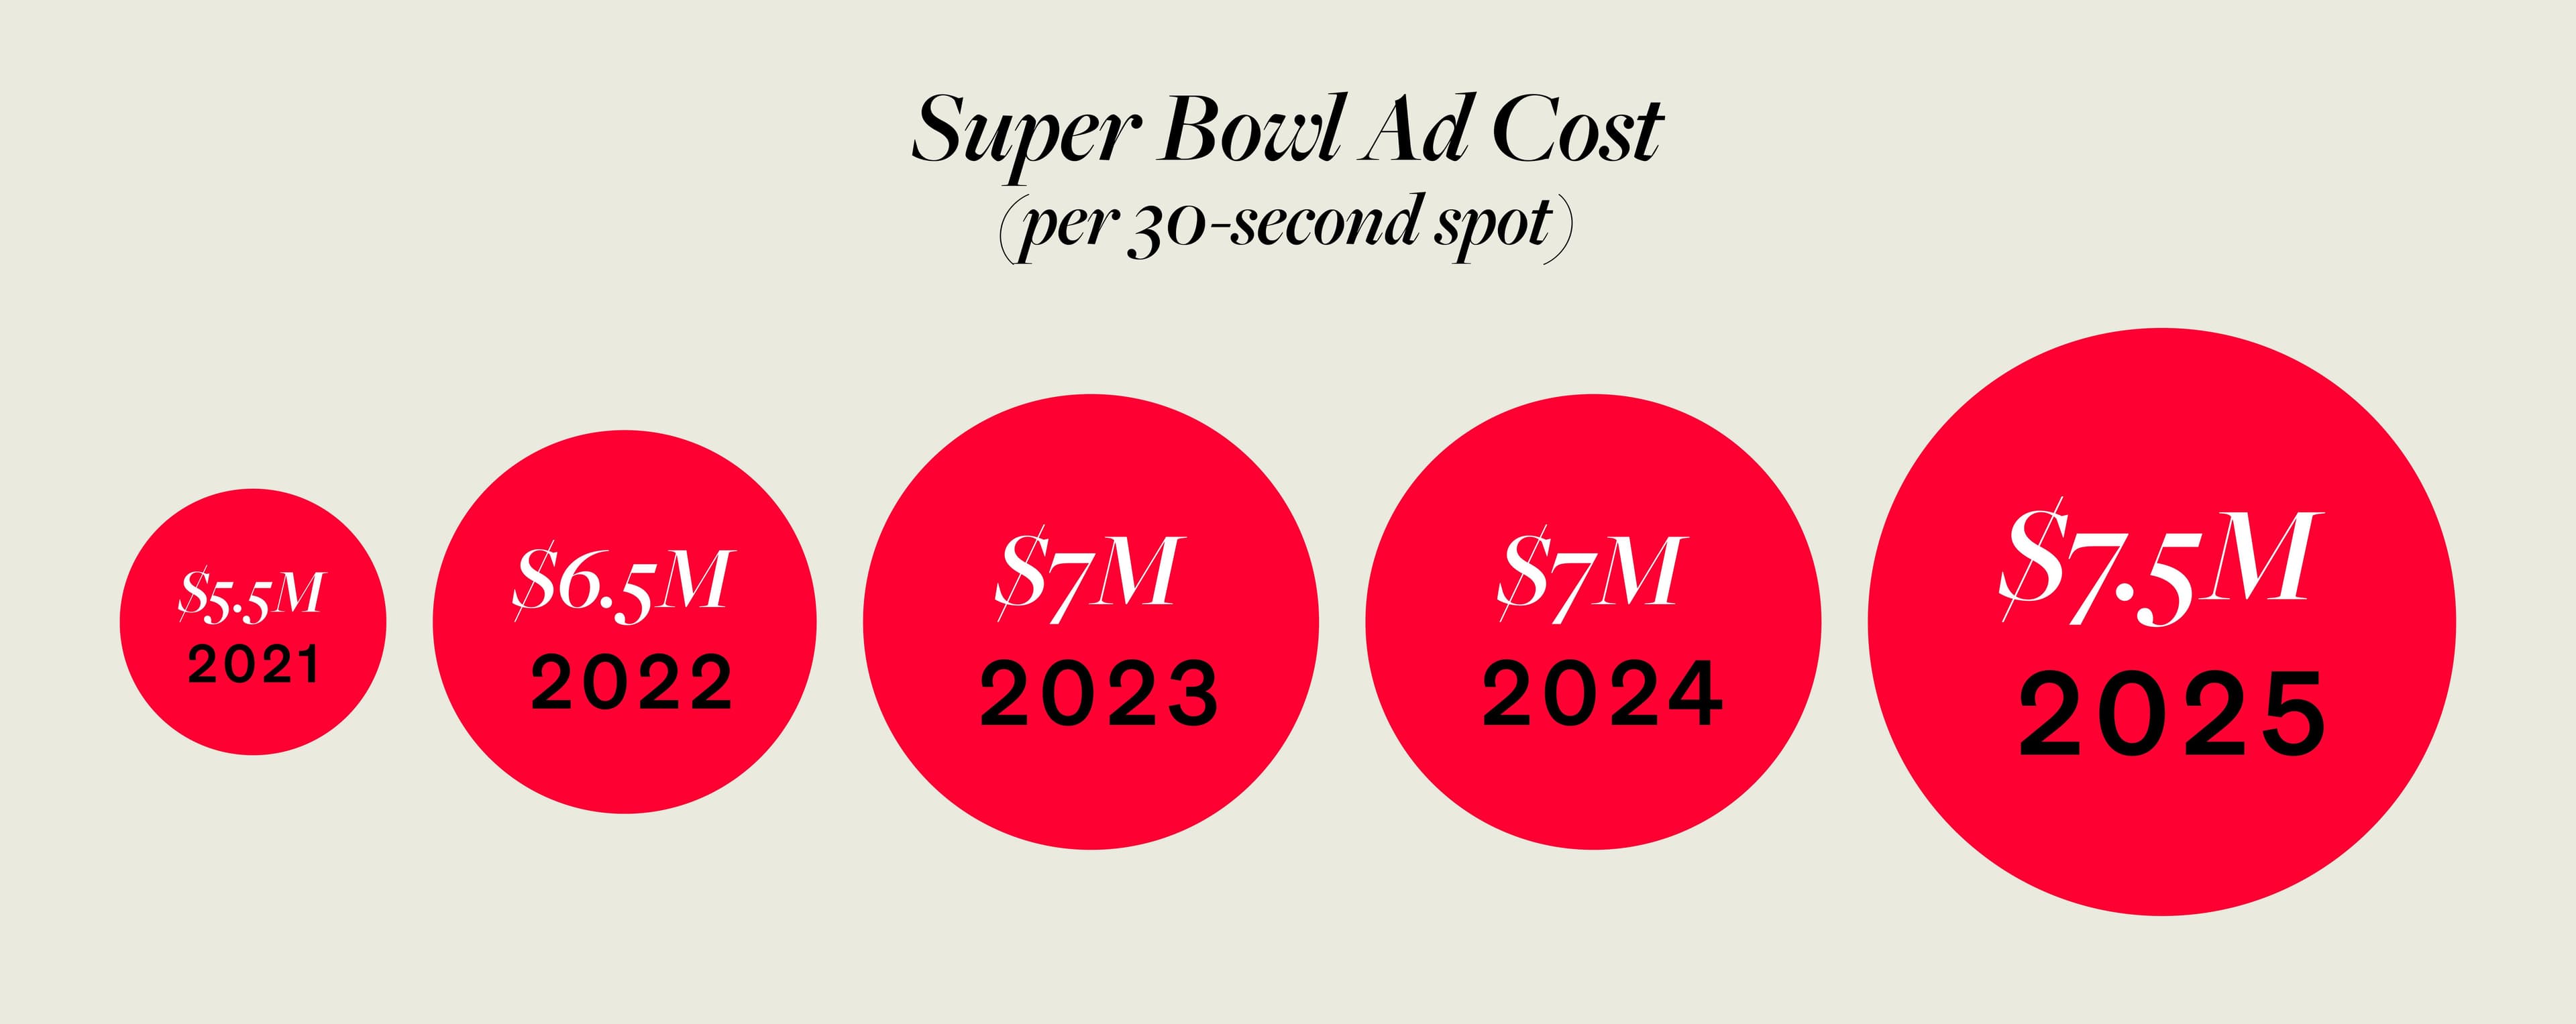
Looking back from 2026, the $3 million rate seems like a bargain. In the current market, Super Bowl ad rates have climbed significantly higher, often doubling or tripling that 2011 figure, driven by the continued decline of linear television and the Super Bowl’s unique status as the last remaining "mass audience" event.
Was the $3 million for a 30-second spot the same for every advertiser?
Not necessarily. Long-standing partners of the NFL and the network, such as Coca-Cola or Anheuser-Busch, often negotiate "package deals" that include pre-game and post-game inventory, which can lower the effective cost per 30-second unit. Conversely, a new advertiser or a "one-off" brand buying a single spot late in the cycle might have paid slightly above the $3 million average.
What was the viewership for the 2011 Super Bowl?
Super Bowl XLV was watched by an estimated 111 million people in the United States. At the time, it set the record for the most-watched television program in American history, surpassing the previous year’s Super Bowl and the series finale of MAS*H.
Strategic Takeaways for Media Buyers
The 2011 Super Bowl ad rates serve as a masterclass in supply and demand. For brands looking to analyze historical data for future planning, the key takeaway from 2011 is the importance of early commitment. Brands that waited until the fourth quarter of 2010 to secure their spots faced higher prices and less desirable "pod placement" (the order in which ads appear during a commercial break).
Furthermore, 2011 proved that the value of a Super Bowl spot is heavily tied to the "halo effect" of social media. The $3 million price tag became easier to justify to boards and shareholders when it was accompanied by millions of YouTube views and global press coverage. For modern marketers in 2026, the 2011 model of "integrated storytelling" remains the gold standard for high-stakes media buys.