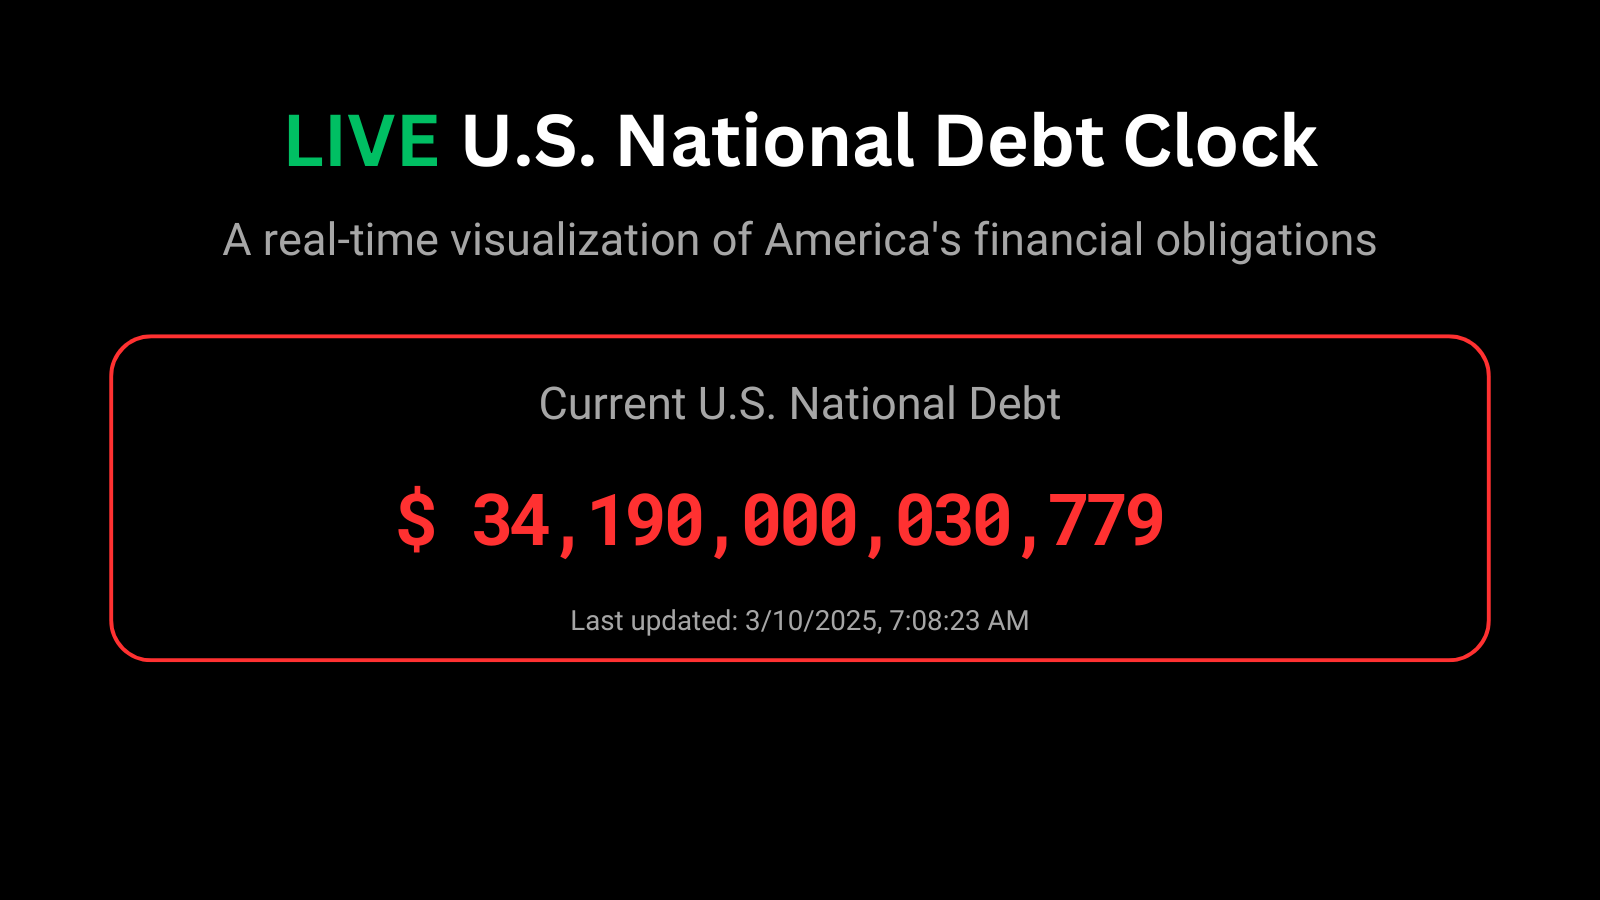
America’s live debt is tracked through the U.S. Treasury’s daily reporting and real-time algorithmic "debt clocks." As of mid-2026, the gross national debt has surpassed $39 trillion. This figure represents the total outstanding obligations of the federal government, driven by persistent budget deficits, rising interest costs, and mandatory spending requirements.
Understanding the Mechanics of "America’s Debt Live"
When users search for "America’s debt live," they are typically looking for the U.S. National Debt Clock, a visual representation of the country's fiscal state. It is important to distinguish between the live "clocks" seen on various websites and the official data released by the government. The live clocks are mathematical models. They take the most recent official data from the U.S. Department of the Treasury and apply a growth algorithm based on the projected annual deficit. Because the federal government spends more than it collects in tax revenue almost every day, the "live" number ticks upward second by second to reflect that ongoing imbalance.
The official number, however, is updated every business day. The Treasury’s Bureau of the Fiscal Service processes the previous day’s transactions—including the issuance of new Treasury bonds and the redemption of old ones—to provide a "Debt to the Penny" figure. In 2026, this process remains the gold standard for financial analysts, even if the real-time tickers provide a more visceral sense of the scale of government borrowing.
The Two Main Components of U.S. National Debt
To understand why the live debt number is so high, one must look at what constitutes the "Gross National Debt." It is not a single pool of borrowed money but is divided into two distinct categories that represent different types of financial obligations.
Debt Held by the Public
This is the most significant portion of the debt and the one that most affects global financial markets. It consists of all federal debt held by individuals, corporations, state or local governments, the Federal Reserve, and foreign governments. When you buy a U.S. Savings Bond or when a pension fund invests in Treasury notes, you are holding part of this debt. In 2026, debt held by the public continues to be a primary focus for economists because it requires the government to make cash interest payments to outside parties, which can influence interest rates across the entire economy.
Intragovernmental Holdings
This category represents debt that the Treasury owes to other federal agencies. For example, the Social Security Trust Fund and the Medicare Trust Fund are required by law to invest their surpluses into special-issue Treasury securities. Essentially, one part of the government is lending money to another part to fund current operations. While this does not impact private credit markets in the same way as public debt, it represents a legal obligation to future retirees and must eventually be repaid or refinanced when those trust funds need to pay out benefits.
Primary Drivers of Debt Growth in 2026
The rapid "ticking" of the live debt clock in 2026 is the result of structural fiscal realities that have been building for decades. There are three primary engines driving this growth: the primary deficit, interest costs, and demographic shifts.
The Primary Deficit
The primary deficit is the gap between what the government spends on programs (defense, infrastructure, education, etc.) and what it collects in taxes, excluding interest payments on existing debt. Despite various legislative attempts to curb spending, the demand for federal services and the volatility of tax receipts—often influenced by economic cycles—frequently lead to a gap that must be filled by borrowing.
The Escalating Cost of Interest
In 2026, interest payments on the national debt have become one of the largest line items in the federal budget. As the total principal grows, the amount of interest owed grows with it. Furthermore, the interest rates set by the Federal Reserve to manage inflation directly impact the cost of servicing this debt. When older Treasury bonds that were issued at low rates mature, the government must often "roll over" that debt by issuing new bonds at the current, potentially higher market rates. This creates a compounding effect where the debt grows simply because it costs more to maintain the debt already on the books.
Demographic Pressures
The aging of the U.S. population is a permanent driver of debt. As more members of the "Baby Boomer" and "Gen X" generations reach retirement age, the outlays for Social Security and Medicare increase. Because these are mandatory programs, the government is legally obligated to fund them, regardless of the current year's tax revenue. In 2026, the ratio of workers paying into these systems relative to the number of retirees drawing benefits continues to tighten, putting more pressure on the federal balance sheet.
The Role of the Debt Ceiling
A critical factor in the "live" status of America's debt is the Statutory Debt Limit, or the debt ceiling. This is a legislative limit set by Congress on the total amount of national debt that the Treasury can incur.
In 2026, the debt ceiling remains a focal point of political and economic debate. When the government approaches this limit, the Treasury Department must engage in "extraordinary measures" to keep paying the nation's bills without issuing new debt. If the limit is not raised or suspended, the U.S. faces the risk of default—a scenario that would likely cause a global financial crisis. The live debt trackers are often monitored most closely during these periods of political negotiation, as they show exactly how much "room" is left before the legal limit is reached.
Comparative Debt Statistics: 2022–2026
Tracking the trajectory of the debt provides context for the current figures. The following table illustrates the growth of the gross national debt and the associated interest costs over the last several years, based on historical data and 2026 projections.
| Fiscal Year | Gross National Debt (Approx.) | Debt-to-GDP Ratio | Annual Interest Expense |
|---|---|---|---|
| 2022 | $30.9 Trillion | 121% | $475 Billion |
| 2023 | $33.1 Trillion | 123% | $659 Billion |
| 2024 | $35.8 Trillion | 124% | $892 Billion |
| 2025 | $37.5 Trillion (Est.) | 125% | $1.02 Trillion (Est.) |
| 2026 | $39.2 Trillion (Proj.) | 127% (Proj.) | $1.15 Trillion (Proj.) |
Note: Data for 2025 and 2026 are based on Congressional Budget Office (CBO) baseline projections and current fiscal trends.
Economic Consequences of a High Debt Load
While the U.S. has operated with debt for most of its history, the current scale of the debt in 2026 presents specific economic challenges. Understanding these consequences is essential for taxpayers and investors alike.
Crowding Out Investment
One of the most significant concerns for economists is the "crowding out" effect. When the government borrows massive amounts of money, it competes with the private sector for available capital. This high demand for loans can lead to higher interest rates for mortgages, car loans, and business expansions. Essentially, if the government is soaking up all the available investment dollars to fund its debt, there is less money available for the private innovation that drives long-term economic growth.
Inflationary Pressures
The relationship between debt and inflation is complex. Large-scale government spending can stimulate demand, but if that spending is funded by increasing the money supply or if it outpaces the economy's ability to produce goods and services, it can contribute to inflation. In 2026, the Federal Reserve must balance its mandate of price stability with the reality of a high-debt environment, where high interest rates to combat inflation also make the government's debt more expensive to service.
Reduced Fiscal Flexibility
High levels of debt limit the government's ability to respond to future crises. Whether it is a pandemic, a military conflict, or a severe economic recession, the government's primary tool is often fiscal stimulus. However, if the debt is already at record levels, policymakers may be hesitant—or unable—to borrow the trillions needed for an emergency response without risking a currency crisis or a credit rating downgrade.
How to Verify Official Debt Data
For those who need precise figures for research, financial planning, or tax purposes, relying on live clocks is insufficient. The Treasury’s Fiscal Data platform is the primary resource for verified information.
- Debt to the Penny: This tool allows users to search the exact total public debt outstanding for any given date.
- Daily Treasury Statement (DTS): This document provides a summary of the cash and debt operations of the U.S. Treasury. It shows the daily cash balance and the types of debt instruments being issued.
- Monthly Treasury Statement (MTS): This report offers a broader view of the month's receipts and outlays, helping to explain why the debt moved the way it did over a 30-day period.
Accessing these records through fiscaldata.treasury.gov ensures that you are viewing the same data used by the Federal Reserve Bank of New York and global financial institutions.
Frequently Asked Questions
Who does the U.S. government owe the most money to?
The largest holder of U.S. debt is actually the U.S. government itself through various trust funds, followed by the Federal Reserve. Among foreign creditors, Japan and China remain the largest holders of Treasury securities in 2026, though their share of the total debt has decreased proportionally as domestic borrowing has increased.
Can the U.S. ever pay off its debt?
In theory, the U.S. could pay off its debt by running consistent budget surpluses, where tax revenue exceeds spending. However, the U.S. has not had a budget surplus since 2001. Most economists agree that the goal is not necessarily to reach a zero balance, but to ensure that the economy (GDP) grows faster than the debt, making the debt-to-GDP ratio sustainable.
What happens if the live debt clock hits a certain number?
There is no "magic number" that triggers an immediate economic collapse. The debt clock is a measurement, not a deadline. However, crossing major psychological thresholds (like $40 trillion) often triggers renewed political debate about spending cuts, tax reforms, and the long-term sustainability of entitlement programs.
Why does the debt clock keep moving even when Congress is not in session?
The live debt clock is an estimate of the accrual of debt. Interest on the national debt accrues every single day, regardless of whether Congress is meeting. Additionally, the government has ongoing obligations—such as payroll for the military and federal employees, and the distribution of Social Security checks—that occur continuously.
Is the national debt the same as the budget deficit?
No. The budget deficit is the difference between what the government takes in and spends in a single fiscal year. The national debt is the accumulation of all past deficits, minus any surpluses. If the deficit is the "speed" at which you are borrowing, the debt is the "total distance" you have traveled into the red.
Next Steps for Concerned Citizens and Investors
Monitoring "America’s debt live" provides a snapshot of the nation's fiscal health, but it should be the beginning of your analysis, not the end. To stay informed in 2026, consider the following actions:
- Monitor CBO Reports: The Congressional Budget Office provides non-partisan analysis of the long-term budget outlook. Their reports explain the policy choices that contribute to debt growth.
- Evaluate Interest Rate Trends: Since interest is a major driver of debt, keep an eye on Federal Reserve announcements. Changes in the federal funds rate will eventually impact the "speed" of the debt clock.
- Review Diversification Strategies: For investors, high national debt can lead to currency volatility. Reviewing your portfolio's exposure to inflation-protected securities (like TIPS) or international assets may be a prudent way to manage the risks associated with long-term fiscal instability.
- Engage with Fiscal Policy Debates: Understanding that the debt is driven by both spending and revenue allows for a more informed perspective on tax legislation and federal budget proposals.
By moving beyond the ticking numbers of a live clock and understanding the structural components of the debt, you can better navigate the economic landscape of 2026.