Market capitalization history tracks the total market value of a company’s outstanding shares over time, serving as a definitive barometer for global economic shifts and investor sentiment. By analyzing historical data, investors observe how leadership transitioned from 20th-century industrial and energy giants to the 21st-century dominance of technology and artificial intelligence.
Understanding the Fundamentals of Market Capitalization
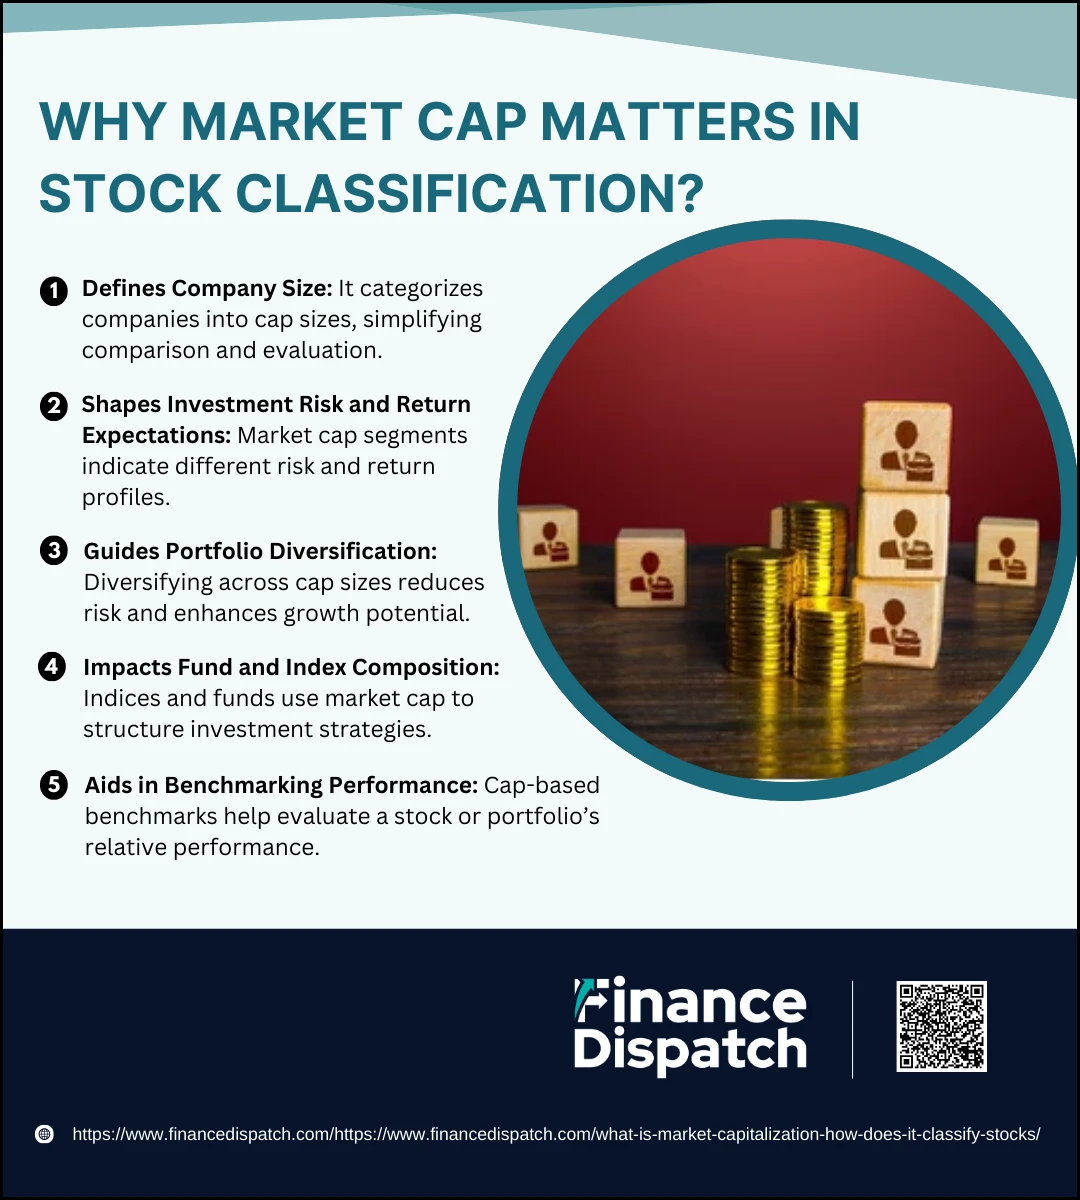
To analyze the history of market capitalization (market cap), one must first grasp its calculation: the total number of a company's outstanding shares multiplied by the current market price of one share. Historically, this metric has been the primary tool for categorizing companies into "large-cap," "mid-cap," and "small-cap" tiers. However, the scale of these definitions has shifted dramatically over the decades. In the mid-20th century, a company with a market cap of $1 billion was considered a massive global entity; by 2026, that same valuation often denotes a niche mid-cap firm.
Market cap history is more than a list of valuations; it is a record of corporate longevity and extinction. It reflects the "survivorship bias" of indices like the S&P 500, where underperforming companies are removed and replaced by rising stars. Historically, the total market cap of the global equity market has expanded alongside global GDP, though the two have frequently decoupled during periods of extreme speculation, such as the Dot-com bubble of 2000 or the post-pandemic liquidity surge of 2021.
Investors study these historical trends to identify structural changes in the economy. For instance, the transition from "book value" (physical assets like factories) to "intangible value" (intellectual property and software) is clearly visible in the market cap history of the last forty years. This shift explains why modern technology leaders can achieve valuations in the trillions with relatively few physical assets compared to the industrial titans of the 1950s.
The Era of Industrial and Energy Dominance (1900–1980)
For much of the early 20th century, market cap leadership was synonymous with physical infrastructure and resource extraction. Companies like United States Steel, Standard Oil, and General Motors dominated the landscape. In 1901, U.S. Steel became the first corporation in the world to reach a market capitalization of $1 billion, a milestone that reflected the era's reliance on steel for railroads, skyscrapers, and machinery.
Following World War II, the "Nifty Fifty" era saw a broader range of consumer and industrial stocks gain prominence. By the 1960s and 1970s, IBM and AT&T (Ma Bell) were the undisputed heavyweights. IBM, in particular, represented the first wave of computational dominance, though its market cap was still grounded in the sale of hardware. During this period, the concentration of market cap was relatively diversified across chemicals, automotive, and telecommunications.
The late 1970s and early 1980s were defined by the energy crisis, which catapulted oil companies to the top of the rankings. By 1980, Exxon (later ExxonMobil) frequently held the title of the world’s most valuable company. This era demonstrated how geopolitical events—specifically oil supply shocks—can radically alter market cap hierarchies in a short period.
The Japanese Asset Bubble and the Shift to Finance (1980–1990)
The 1980s presented one of the most significant anomalies in market cap history: the rise of Japanese equities. Driven by a massive real estate and credit bubble, Japanese firms came to dominate the global top ten lists. By 1989, Nippon Telegraph and Telephone (NTT) was the most valuable company in the world, with a market cap exceeding $160 billion—a staggering figure for the time.
During this decade, Japanese banks like Industrial Bank of Japan and Sumitomo Bank also occupied the top ranks. At the peak of the bubble in late 1989, the market cap of the Tokyo Stock Exchange briefly surpassed that of the New York Stock Exchange. The subsequent "Lost Decade" in Japan serves as a historical warning of how inflated market caps, unsupported by sustainable earnings growth, can lead to long-term stagnation. When the bubble burst, these companies saw their valuations plummet, allowing American technology and consumer firms to reclaim leadership.
The Dot-com Boom and the Birth of Modern Tech (1990–2010)
The 1990s marked the beginning of the information technology revolution. Microsoft and Cisco Systems began their ascent, challenging the old guard like General Electric (GE). GE, under Jack Welch, managed to maintain a top-three position for years by diversifying into financial services, but the real story was the internet.
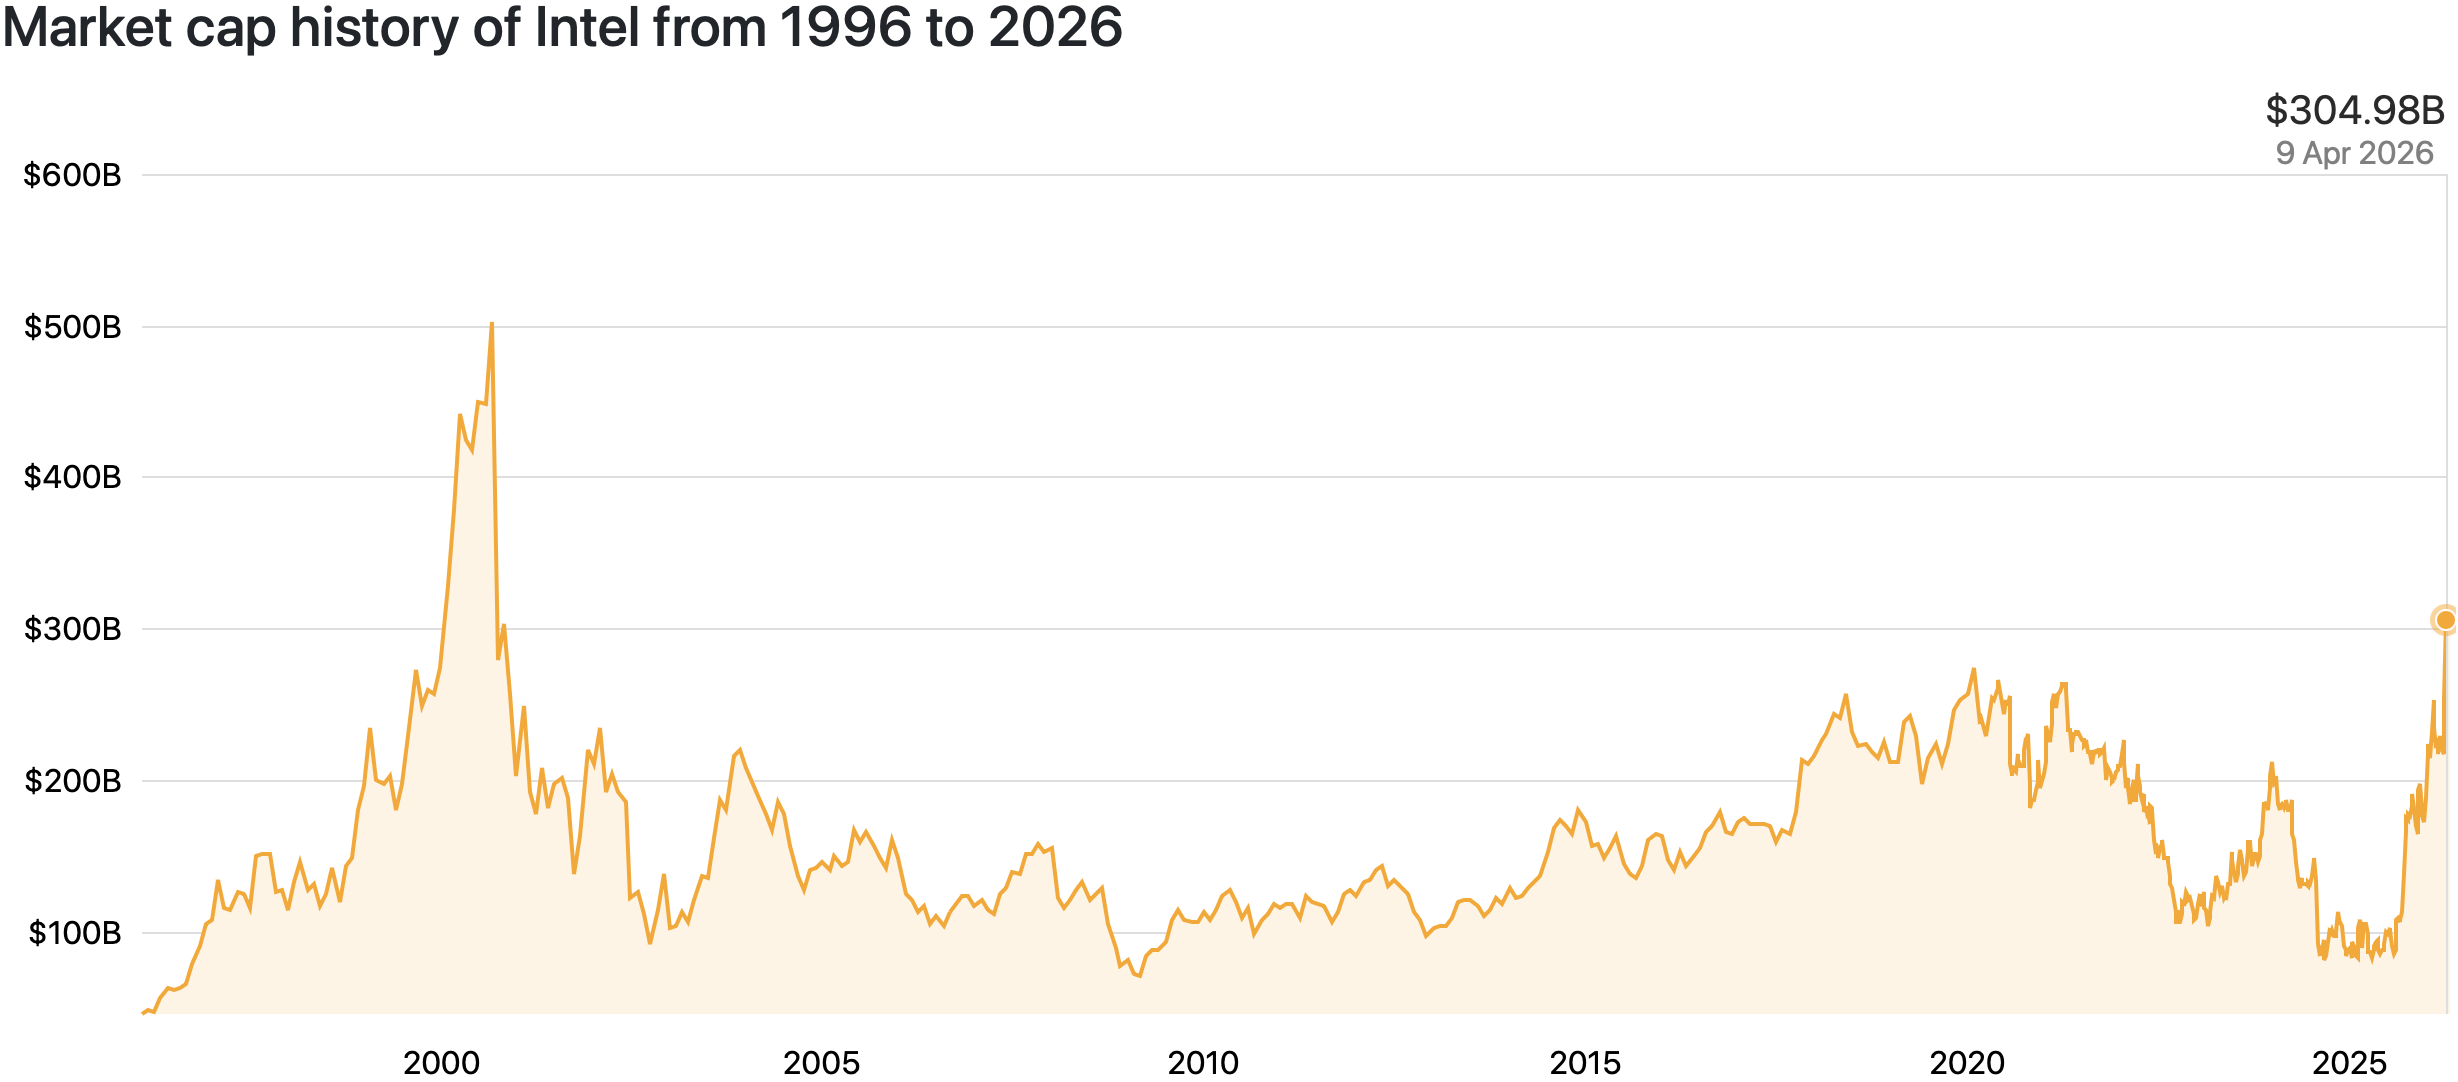
By March 2000, at the height of the Dot-com bubble, Microsoft’s market cap hit approximately $600 billion. Other companies like Intel and Lucent Technologies reached valuations that were historically unprecedented relative to their earnings. When the bubble burst, many of these market caps evaporated. It took Microsoft over 15 years to return to its year-2000 valuation peak, highlighting the danger of "over-earning" or over-valuation in market cap history.
The mid-2000s saw a brief return to energy and banking dominance. Before the 2008 financial crisis, ExxonMobil and PetroChina (which briefly touched a $1 trillion valuation upon its 2007 IPO on the Shanghai exchange, though this was largely due to limited float) were the global leaders. The 2008 crash decimated the market caps of financial institutions like Citigroup and AIG, leading to a permanent shift in how investors valued highly leveraged businesses.
The Rise of the Trillion-Dollar Club (2010–2026)
The most dramatic chapter in market cap history began in the 2010s with the "platform economy." Companies that controlled digital ecosystems—Apple, Microsoft, Alphabet (Google), and Amazon—leveraged network effects to grow at scales previously thought impossible.
In August 2018, Apple became the first publicly traded U.S. company to reach a $1 trillion market cap. This milestone was followed rapidly by others. By 2020, even amidst a global pandemic, Apple and Microsoft breached the $2 trillion mark. The acceleration of digital transformation during 2020-2022 provided the liquidity and growth necessary for these valuations to stabilize.
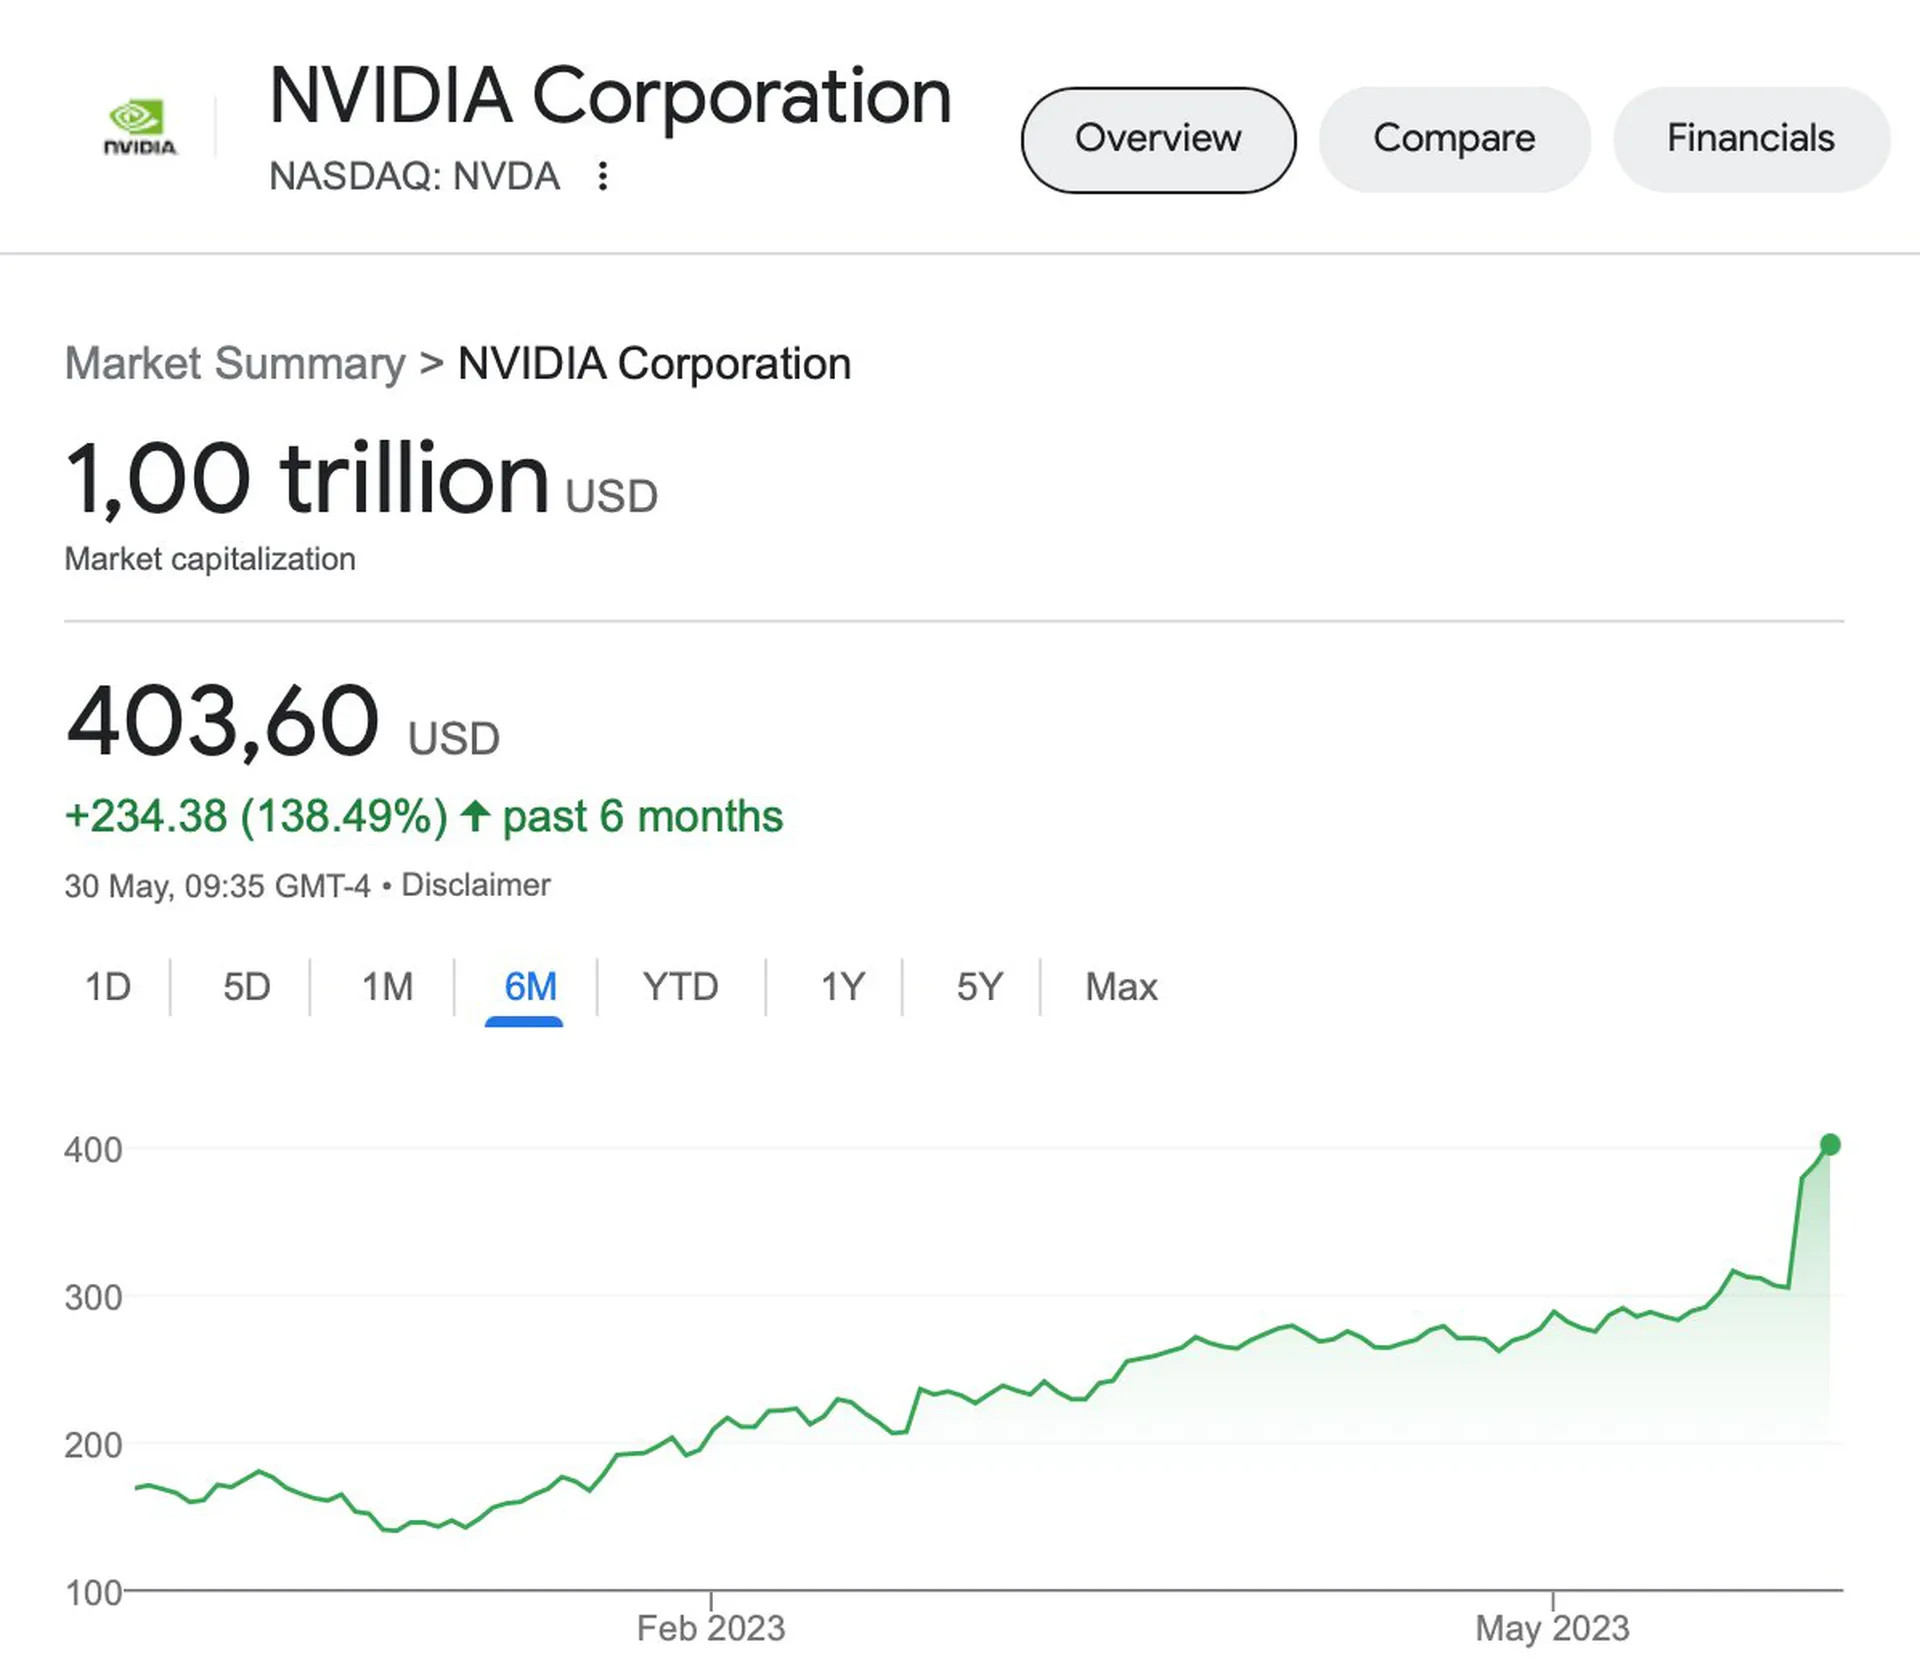
The entry of NVIDIA into the top tier is perhaps the most significant development of the mid-2020s. Driven by the demand for generative AI hardware, NVIDIA’s market cap surged from under $500 billion in early 2023 to over $3 trillion by 2024, briefly surpassing Apple and Microsoft to become the world’s most valuable company. As of 2026, the market cap landscape is dominated by a small group of "Mega-caps" whose individual valuations exceed the entire GDP of many developed nations.
Historical Comparison of Top Companies by Market Cap (1980–2026)
The following table tracks the company holding the #1 spot globally at the start of each decade, illustrating the total transformation of the global economy.
| Year | Company | Primary Sector | Approximate Market Cap | Key Driver of Valuation |
|---|---|---|---|---|
| 1980 | IBM | Technology | $35 Billion | Mainframe Computing Dominance |
| 1990 | NTT | Telecom | $160 Billion | Japanese Asset Bubble |
| 2000 | Microsoft | Technology | $580 Billion | PC Operating System Monopoly |
| 2010 | ExxonMobil | Energy | $300 Billion | High Oil Prices & Global Demand |
| 2020 | Apple | Consumer Tech | $1.3 Trillion | iPhone Ecosystem & Services |
| 2026 | NVIDIA / Microsoft | AI & Cloud | $3.5+ Trillion | Artificial Intelligence Infrastructure |
Factors Influencing Market Cap Fluctuations
Historical market cap trends are not merely the result of company performance; they are heavily influenced by macro-economic factors. Understanding these variables is crucial for interpreting why certain eras favored specific industries.
- Interest Rates: Low-interest-rate environments, such as the 2009–2021 period, tend to inflate the market caps of "growth" stocks (like Tech). High rates discount future cash flows more aggressively, which historically benefits "value" stocks or companies with immediate high cash flow (like Energy or Banking).
- Monetary Policy: Quantitative Easing (QE) by central banks has historically correlated with a rise in total global market cap. When the money supply increases, a portion of that capital inevitably flows into equities, lifting valuations across the board.
- Share Buybacks: In the last 15 years, share buybacks have played a massive role in market cap history. Companies like Apple have spent hundreds of billions of dollars retiring their own shares. While this reduces the "shares outstanding" part of the market cap equation, it often drives the share price up even faster, resulting in a net increase in total valuation.
- Technological Paradigms: Every major market cap shift corresponds to a technological leap. The steam engine, the internal combustion engine, the transistor, the internet, and now Artificial Intelligence have each minted a new generation of market cap leaders while devaluing the previous ones.
Market Cap in Alternative Asset Classes
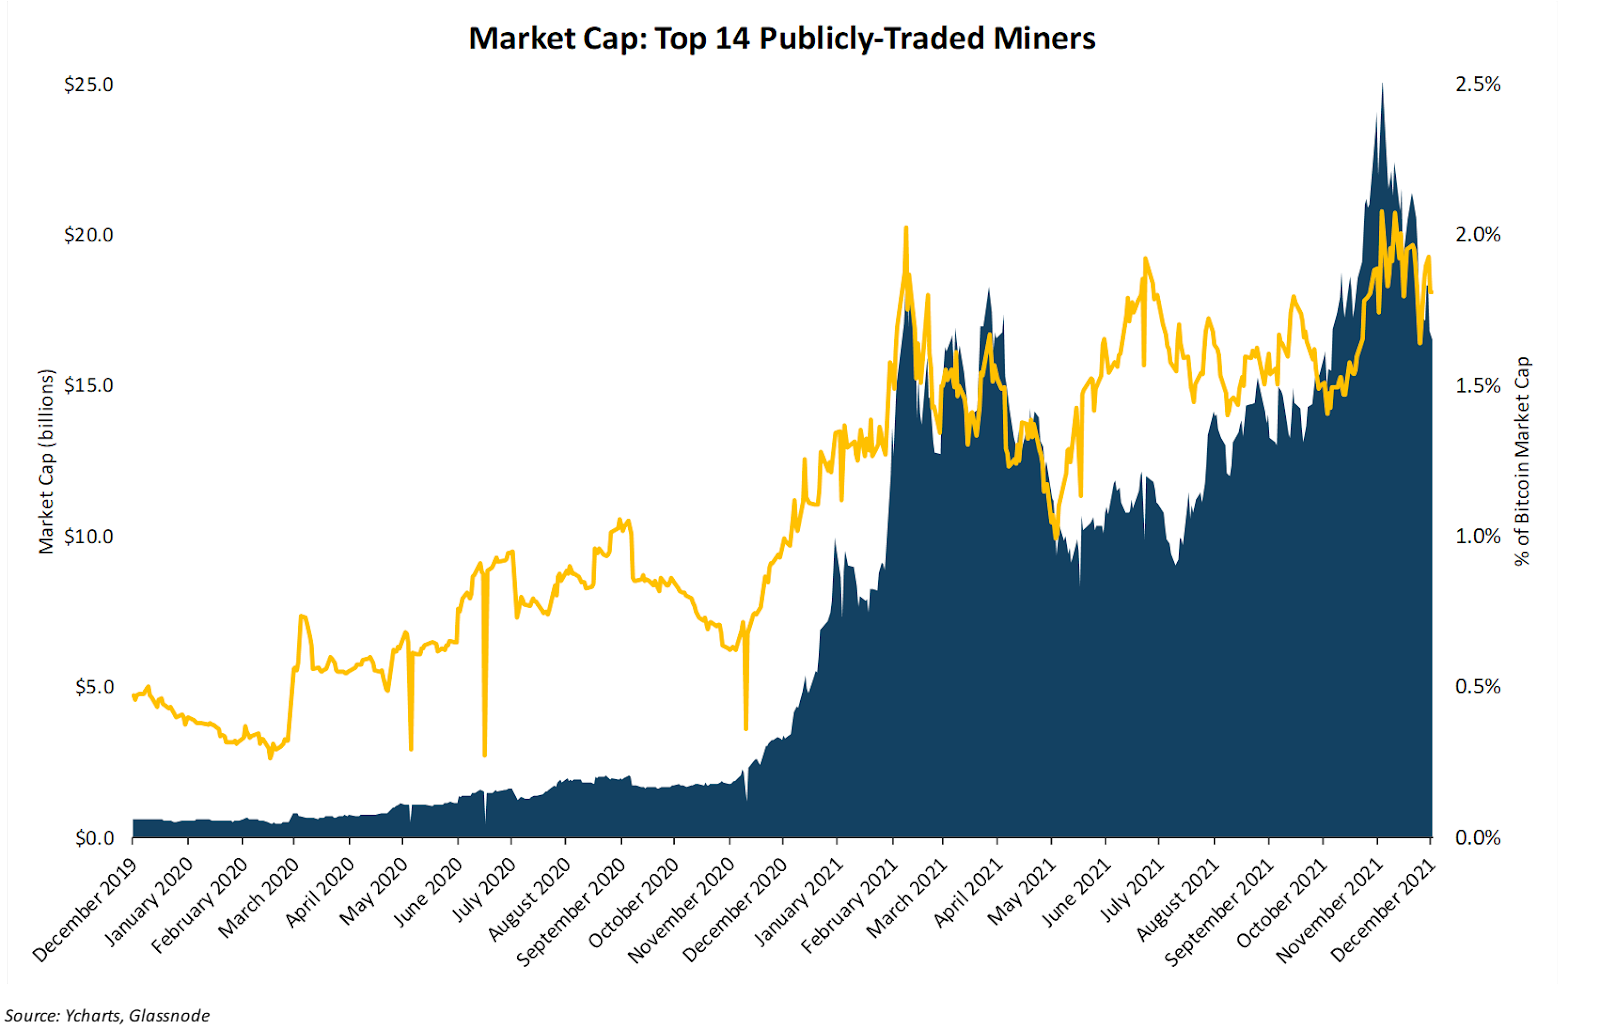
While the term is most often associated with stocks, the history of market cap has expanded into the world of digital assets. Bitcoin, for example, saw its market cap grow from zero in 2009 to over $1 trillion for the first time in 2021. By 2026, the "Total Crypto Market Cap" is a standard metric used by institutional investors to gauge the adoption of blockchain technology.
Unlike equities, the market cap of cryptocurrencies is often criticized for being "hollow" because of low liquidity in certain tokens. However, for major assets like Bitcoin and Ethereum, market cap history provides a clear visual of the "halving" cycles and the increasing institutionalization of the asset class.
Practical Guidance: Analyzing History for Future Investment
For investors, the history of market cap offers several vital lessons for portfolio construction:
- Avoid "Peak Performance" Chasing: History shows that the company at the #1 spot rarely stays there for more than two decades. The "winners" of the 1990s were not the winners of the 2010s. Diversification is the only hedge against the inevitable disruption of today’s leaders.
- Watch for Sector Concentration: When a single sector (like Tech in 2000 or 2024-2026) represents a disproportionately high percentage of the total market cap of an index like the S&P 500, the risk of a "reversion to the mean" increases.
- Contextualize with Earnings: A rising market cap is healthy if it is accompanied by rising earnings (P/E ratio stability). If market cap grows while earnings stagnate, history suggests a bubble is forming.
For more detailed historical data on corporate valuations and index performance, investors often consult resources such as The World Bank's database on listed companies or official SEC filings for specific historical share counts.
Frequently Asked Questions
Who was the first company to reach a $1 trillion market cap? Apple Inc. was the first publicly traded U.S. company to reach a $1 trillion market capitalization on August 2, 2018. While PetroChina briefly hit this mark in 2007 on the Shanghai Stock Exchange, it was widely considered an anomaly due to the very small percentage of shares available for public trading and the specific conditions of the Chinese market at that time.
How do stock splits affect a company’s market cap history? A stock split has no direct impact on a company’s market cap. In a 2-for-1 split, the number of shares outstanding doubles, but the price per share is halved. The total value (Price × Shares) remains the same. However, splits often increase liquidity and can lead to a psychological boost in share price, which may indirectly increase market cap over time.
Why did Japanese companies disappear from the top market cap lists? The dominance of Japanese companies in the late 1980s was fueled by an unsustainable asset bubble. When the Bank of Japan raised interest rates to combat inflation, the bubble burst, leading to a massive contraction in equity valuations. Furthermore, Japanese firms struggled to transition to the software-driven economy that defined the 1990s and 2000s, allowing U.S. tech firms to overtake them.
What is the difference between Market Cap and Enterprise Value (EV)? Market cap only accounts for the value of a company’s equity. Enterprise Value (EV) provides a more comprehensive picture by taking the market cap, adding the company’s total debt, and subtracting its cash and cash equivalents. EV is often used by historians and analysts to understand the "takeover" value of a company, rather than just its public market price.
Has any company reached a $5 trillion market cap by 2026? As of early 2026, while the top companies like NVIDIA, Apple, and Microsoft have toyed with the $3.5 to $4 trillion range, the $5 trillion mark remains a significant psychological and economic barrier. Reaching such a valuation requires a combination of sustained earnings growth in the AI sector and a favorable macroeconomic environment with stable or falling interest rates.
Next Steps for Investors
To apply these historical insights, begin by reviewing your portfolio’s concentration in "Mega-cap" stocks. Ensure that your investment strategy accounts for the historical reality that market leadership is cyclical. Utilize tools like the S&P Global Market Intelligence platform to track how current valuations compare to 10-year and 20-year historical averages for specific sectors.