The lowest price for Apple Inc. (AAPL) stock is not a static figure but a historical data point determined by market supply and demand. Investors seeking the "lowest price" are typically looking for historical lows for comparative analysis or are attempting to time the market based on support levels and cyclical valuation trends within the 2026 fiscal landscape.
Defining Historical Lows vs. Current Market Entry
When discussing the "lowest price" of Apple stock, it is essential to distinguish between the nominal price—the actual dollar amount per share—and the inflation-adjusted, split-adjusted price. Apple has undergone multiple stock splits throughout its history, most notably the 4-for-1 split in 2020 and the 7-for-1 split in 2014. These actions intentionally lowered the nominal price to increase liquidity and accessibility for retail investors.
If an investor is researching the historical floor, they must use "split-adjusted" data. Looking at raw, pre-split data from the 1980s or 1990s can be misleading, as those figures do not reflect the current share count or the massive scale of the company’s enterprise value today. The lowest historical price point, when adjusted for these splits, sits well below one dollar, dating back to the company's initial public offering (IPO) in December 1980.
The Role of Market Volatility in Determining Price Floors
In the context of modern trading as of 2026, finding the "lowest price" often refers to identifying "support levels"—technical indicators where the stock price has historically struggled to fall further because buying interest is strong enough to overcome selling pressure.
Investors utilize various analytical tools to determine if the current stock price represents a relative low:
- Moving Averages: Traders look at the 200-day moving average to determine if the stock is in a long-term uptrend or if it has drifted into an undervalued position.
- Price-to-Earnings (P/E) Ratio: This metric compares Apple’s share price to its earnings per share (EPS). A lower-than-average P/E ratio compared to its five-year mean may suggest the stock is trading at a "low" relative to its fundamental earning power.
- Market Sentiment: Macroeconomic indicators, such as interest rate decisions by the Federal Reserve and consumer demand for hardware like the iPhone or services, significantly influence the daily floor price.
Comparative Analysis of Stock Valuation
To understand where Apple stands, it is helpful to look at how analysts view the stock compared to previous years. The following table provides a high-level overview of metrics used to define whether the current price is considered a favorable entry point or a period of high valuation.
| Metric | Purpose for Analysis | Impact on "Lowest Price" Perception |
|---|---|---|
| Split-Adjusted Price | Normalizes historical data | Essential for accurate long-term charting |
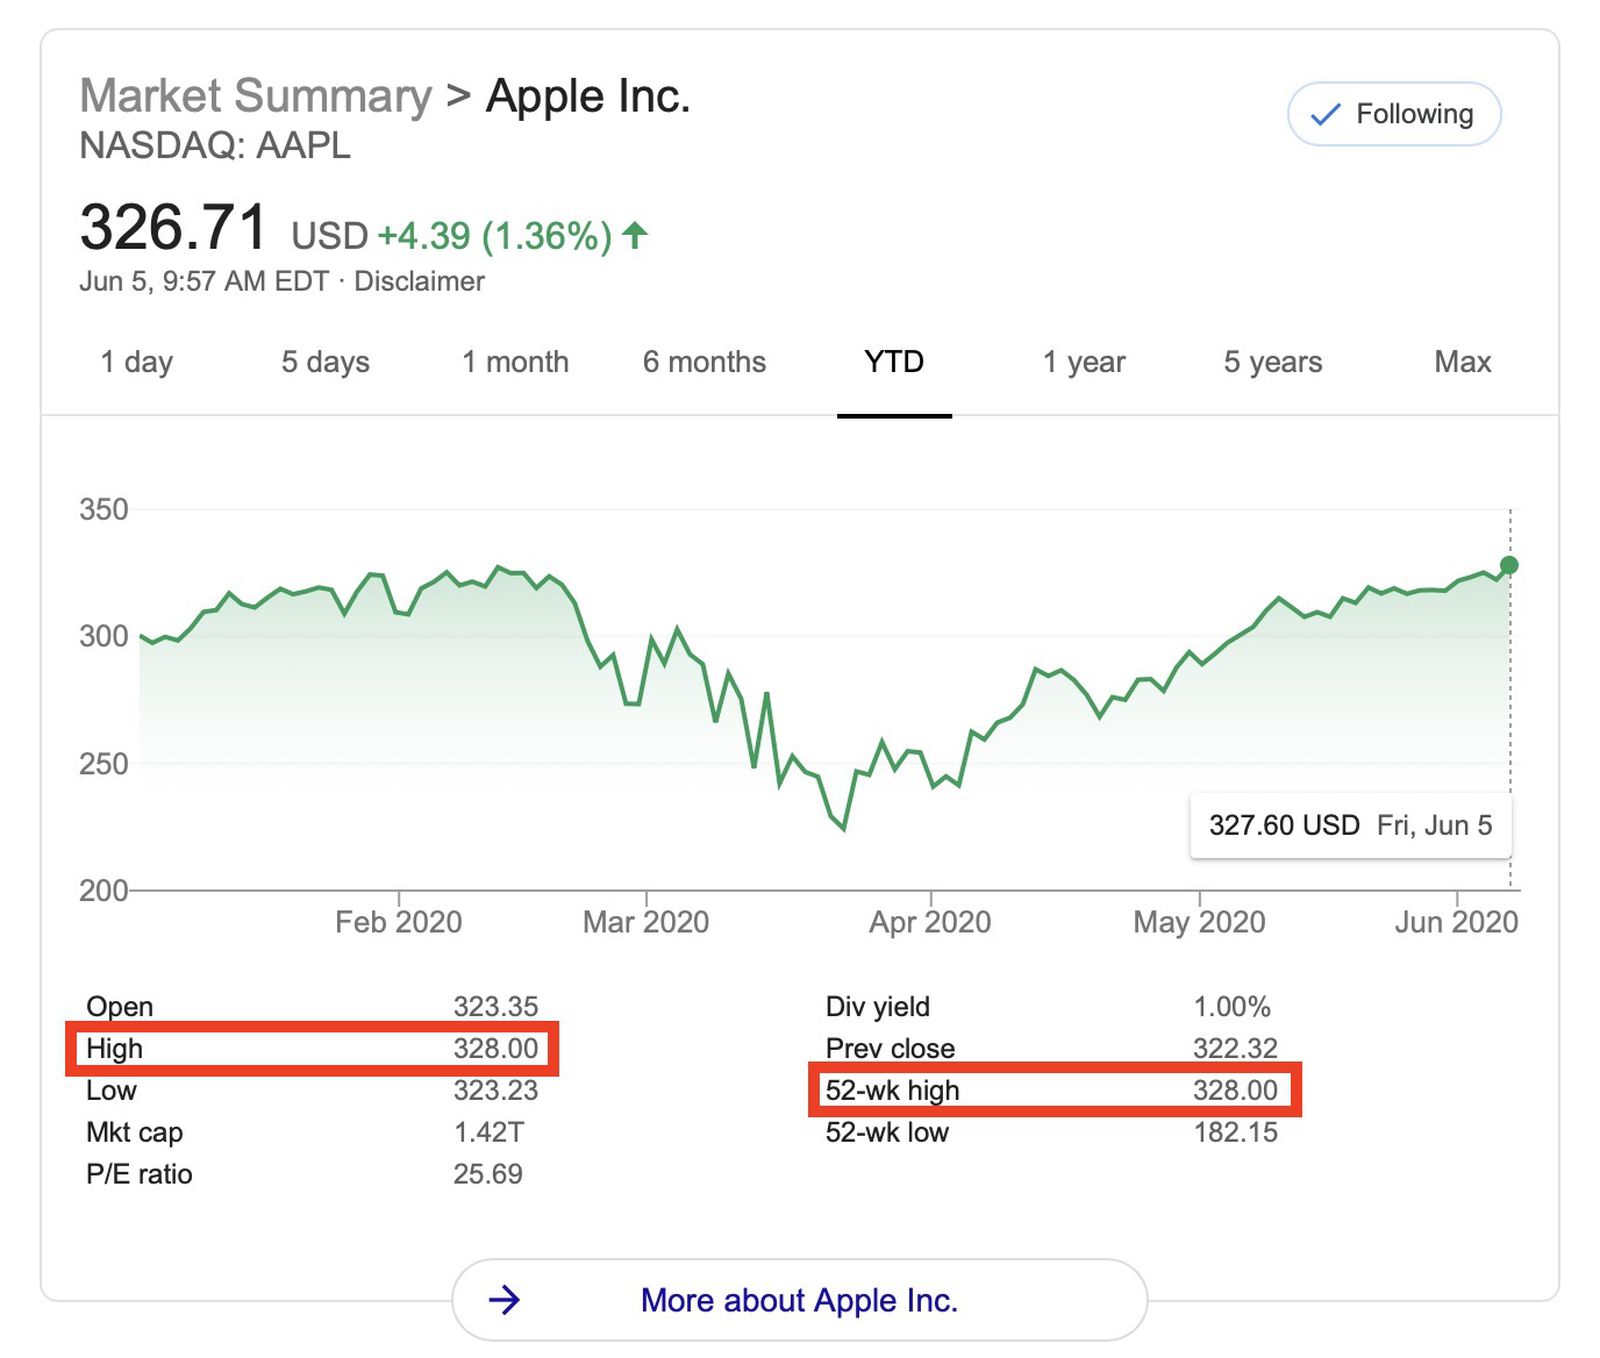
| 52-Week Low | Defines the immediate cycle floor | Useful for short-term entry strategy |
| Forward P/E Ratio | Predicts valuation vs. future earnings | Indicates if the price is "cheap" vs. potential growth |
| Dividend Yield | Measures income return | Higher yields can signal an undervalued entry |
Why "Timing the Bottom" is Historically Difficult
One of the most common pitfalls for retail investors is the attempt to purchase Apple stock at its absolute lowest price. Market history demonstrates that even the most sophisticated institutional investors rarely hit the exact bottom. Apple, as a bellwether of the S&P 500, is highly liquid, meaning its price is heavily influenced by global index funds and automated trading algorithms.
When a stock hits a "new low," it is often accompanied by negative news cycles or broader market downturns. Attempting to catch a falling knife—buying while a stock is rapidly declining—carries significant risk. Experts often suggest that instead of hunting for the "lowest price," long-term investors should focus on Dollar-Cost Averaging (DCA). This strategy involves investing a fixed dollar amount at regular intervals regardless of the price. Over time, this lowers the average cost per share and mitigates the risk of deploying all capital at a temporary market high.
Factors Influencing Apple’s Valuation in 2026
In 2026, the variables affecting Apple's price are more complex than in previous decades. The company’s pivot toward integrated services and artificial intelligence integration across its hardware lineup has changed how Wall Street values the firm.
- Supply Chain Stability: Any disruption in manufacturing or logistics can lead to temporary price dips. Investors often watch these periods as opportunities to buy when the stock price falls due to external supply factors rather than internal business failure.
- Product Cycle Milestones: Apple’s stock price often exhibits a "sell the news" pattern following large product launches, where traders take profits, causing a short-term price decline. Identifying these patterns is often more practical than trying to find a mathematical "lowest price."
- Regulatory Landscape: Ongoing antitrust scrutiny in various jurisdictions can cause price volatility. Such events can create sudden, sharp drops in the stock price that do not necessarily reflect the long-term health of the company.
How to Verify Current Price Data Safely
When searching for live pricing, utilize established financial portals that provide real-time data. Relying on search engine snippets can be risky, as they may be delayed by 15–20 minutes. For accurate financial decision-making:
- Use official investor relations pages for company-specific disclosures.
- Check reputable exchanges (such as NASDAQ, where AAPL is listed).
- Consult regulated brokerage platforms that provide audited, real-time market data.
Avoid relying on forums, social media, or unofficial financial blogs that may speculate on "all-time lows" to drive traffic. Always verify the source's data against primary exchange reporting.
Frequently Asked Questions
Is it possible to buy Apple stock at its all-time low price today? No. The all-time low, after adjusting for stock splits, occurred shortly after the company’s IPO in the 1980s. The market valuation of the company has grown significantly since then, and the share price reflects the current multi-trillion dollar capitalization of the firm.
Does a low stock price mean a stock is a "good buy"? Not necessarily. A low price could indicate that the market has identified fundamental weaknesses in the business model, reduced earnings expectations, or systemic risks. Always evaluate the Price-to-Earnings ratio and company growth prospects rather than focusing on the nominal share price.
How do I find the 52-week low for AAPL? You can find the 52-week low on any major financial news website or through your brokerage platform by searching for the ticker symbol "AAPL." This figure represents the lowest price the stock has traded at over the past 365 days.
What is the difference between a market order and a limit order? A market order tells your broker to buy the stock at the current best available price immediately. A limit order allows you to specify the maximum price you are willing to pay. If you have a specific "low" price target in mind, you would use a limit order to ensure you only purchase the stock if it drops to or below that level.
Should I wait for a price drop to invest? Waiting for a significant price drop can lead to "opportunity cost," where you remain on the sidelines while the stock price continues to appreciate. For most individual investors, consistent, long-term investing through Dollar-Cost Averaging is statistically more effective than trying to time the absolute bottom of a stock cycle.
Practical Recommendation for Investors
If you are an investor looking to add Apple to your portfolio, shift your focus from finding the "lowest price" to determining your "target allocation." Decide what percentage of your portfolio you want to dedicate to technology or specifically to Apple. Once this is determined, consider initiating a position with a portion of your capital and using subsequent price dips to add to your holding. This approach replaces the stress of timing the market with a disciplined, strategy-based methodology that accounts for long-term growth rather than short-term fluctuations.