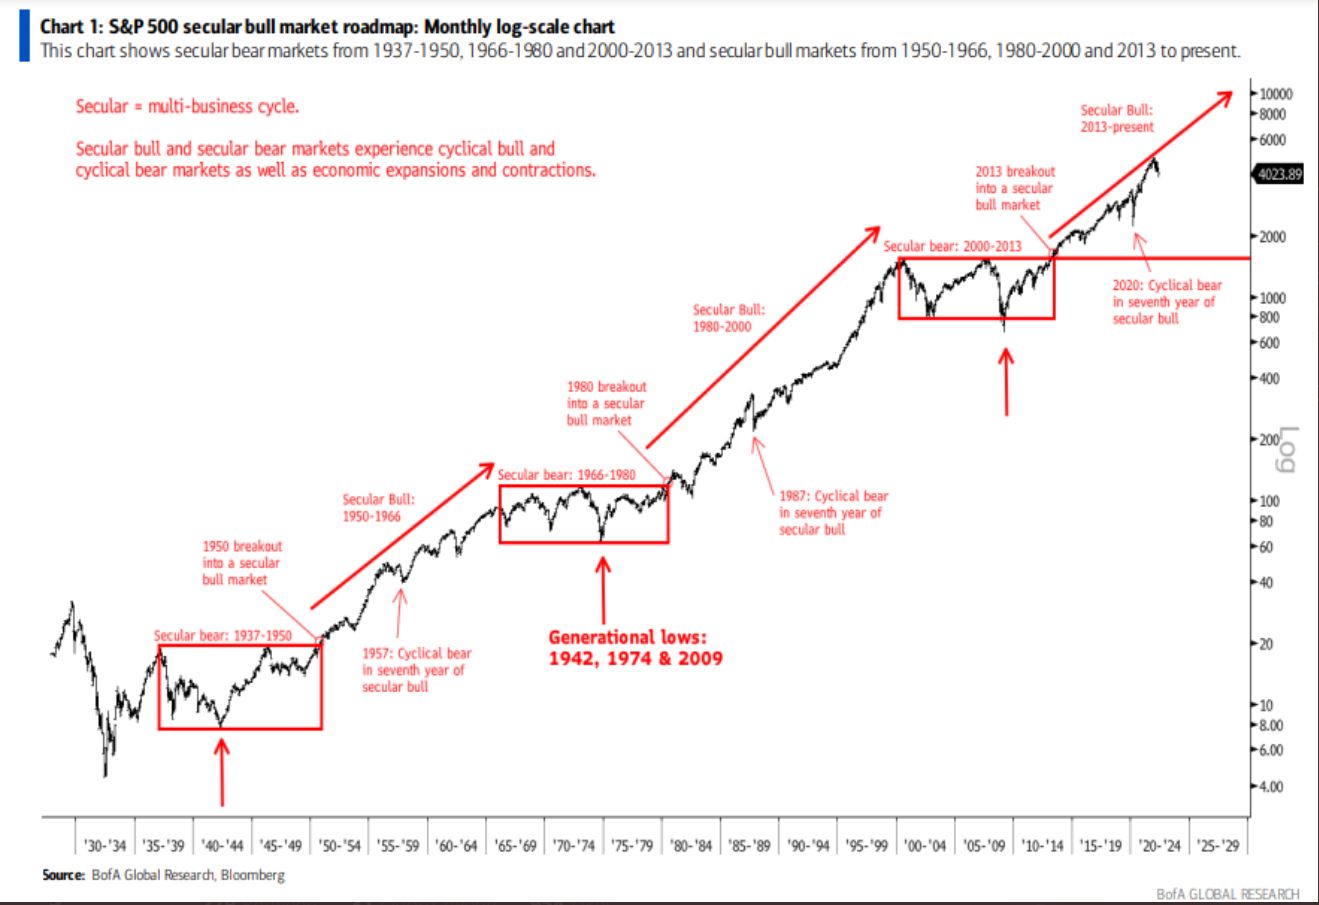
A 500-day analytical window of the S&P 500 index provides market participants with a comprehensive intermediate-to-long-term perspective that filters out daily noise while capturing structural market shifts, macroeconomic transitions, and evolving sector leadership dynamics.
Understanding the Intermediate Horizon in Market Analysis
Analyzing financial markets requires balancing short-term tactical movements with long-term strategic positioning. While daily charts reveal intraday volatility and weekly charts show immediate trend direction, a span of roughly 500 trading days—representing approximately two calendar years—serves as a vital bridge in market analysis. This timeframe is long enough to encompass complete intermediate business cycles, Federal Reserve policy shifts, and multi-quarter earnings seasons, yet short enough to remain relevant to contemporary macroeconomic conditions.
For equity analysts, portfolio managers, and individual investors, examining the S&P 500 through this multi-hundred-day lens offers a clearer view of underlying momentum, valuation re-ratings, and structural support or resistance levels. By moving away from hyper-reactive trading intervals, market participants can better evaluate whether current price action represents a durable secular trend, a cyclical correction within a broader bull market, or the early stages of a structural distribution phase.
Macroeconomic Drivers and Structural Context
The trajectory of the S&P 500 over any 500-day window is fundamentally tethered to macroeconomic variables. Monetary policy, fiscal stimulus, inflation prints, and labor market resilience act as the primary gravitational forces pulling equity valuations higher or lower. During periods marked by shifting central bank rate trajectories, market sensitivity to inflation data releases and employment reports intensifies significantly.
Interest rate expectations remain a dominant catalyst. When the Federal Reserve pivots between easing and tightening cycles, equity valuations adjust to reflect higher or lower discount rates applied to future corporate cash flows. Over a 500-day span, these policy transitions often unfold in distinct phases:
- Anticipation Phase: Markets price in expected rate adjustments well before central bank actions occur, leading to sector rotations.
- Implementation Phase: Actual policy changes create short-term volatility as algorithmic and institutional portfolios rebalance.
- Digestion Phase: Economic data validates or refutes the policy stance, establishing a clearer intermediate trend for corporate earnings.
Simultaneously, corporate earnings durability dictates the fundamental floor and ceiling for index returns. The S&P 500, being a market-capitalization-weighted index, is heavily influenced by its largest components. Earnings reports from mega-cap technology and consumer discretionary firms often dictate whether the broader index can sustain upward momentum against macroeconomic headwinds.
Technical Frameworks: Moving Averages and Momentum Indicators
Technical analysis provides quantitative tools to interpret a 500-day price series systematically. Moving averages calculated over various intervals within this window help identify trend strength and potential inflection points. While a 50-day moving average captures short-term sentiment, and a 200-day moving average defines the primary intermediate-to-long-term trend, observing price behavior relative to multi-hundred-day structures reveals deep structural liquidity levels.
Market participants frequently evaluate several core technical dimensions when reviewing extended index histories:
| Technical Dimension | Analytical Purpose within a 500-Day Window |
|---|---|
| Moving Average Slopes | Confirms the velocity and persistence of the primary trend. |
| Support and Resistance | Identifies historical price clusters where volume spiked. |
| Volatility Bands | Measures market expansion and contraction cycles. |
| Breadth Indicators | Assesses whether index gains are broad-based or narrow. |
When the index trades consistently above rising intermediate moving averages, market structure typically reflects persistent institutional accumulation. Conversely, consecutive tests and failures at key resistance levels over a multi-hundred-day period can signal distribution, where institutional investors systematically reduce equity exposure into market strength.
Market Breadth and Concentration Risk
A critical challenge when evaluating the S&P 500 over any extended timeframe is understanding market concentration. Because the index weights its constituent companies by market capitalization, a small cohort of mega-cap corporations can disproportionately drive headline index performance. This phenomenon introduces unique analytical considerations for anyone reviewing a 500-day price chart.
During periods of high concentration, headline index returns may signal a robust, upward-trending market while an equal-weighted variant of the S&P 500 tells a very different story. Analyzing breadth metrics—such as the percentage of index constituents trading above their 200-day moving averages or the Advance-Decline line—reveals the underlying health of the broader market. A healthy 500-day advancement is typically characterized by participation across multiple sectors, including industrials, financials, healthcare, and technology, rather than reliance on a single leadership group.
Risk Management and Strategic Applications
Interpreting a 500-day view of the S&P 500 index serves little practical purpose without translating insights into risk management protocols. Investors and portfolio managers utilize this historical perspective to establish asset allocation boundaries, rebalance portfolio weights, and set appropriate risk parameters.
- Evaluate Portfolio Beta: Assess whether portfolio holdings correlate with the broader S&P 500 trends observed over the 500-day window.
- Define Rebalancing Triggers: Establish rules-based schedules to trim overperforming assets and accumulate undervalued sectors based on intermediate technical deviations.
- Stress Test Allocations: Model how a reversion to historical support levels observed within the 500-day data set would impact overall capital preservation goals.
- Monitor Sentiment Extremes: Use extended momentum indicators to identify when market optimism or pessimism reaches unsustainable extremes.
Disclaimer: Financial markets are inherently volatile, and historical index performance does not guarantee future results. Technical indicators and macroeconomic analyses provide probabilistic frameworks rather than certainties. Investors should consider their individual risk tolerance, investment horizon, and financial objectives before making capital allocation decisions.
Frequently Asked Questions
What does a 500-day view of the S&P 500 index represent?
A 500-day view covers roughly two calendar years of trading activity. It provides an intermediate-to-long-term perspective that helps analysts filter out short-term market noise to identify structural trends, macroeconomic regime shifts, and multi-quarter earnings cycles.
Why is market concentration important when analyzing the S&P 500?
Because the S&P 500 is market-cap-weighted, a few large companies can dominate index returns. Examining market breadth alongside headline index performance ensures that analysts do not mistake narrow leadership for universal market strength.
How do moving averages help interpret intermediate market trends?
Moving averages smooth out daily price fluctuations. Observing how the index interacts with intermediate and long-term moving averages over a 500-day span helps identify whether institutional investors are accumulating or distributing shares.
Can historical index performance predict future market movements?
No. While historical analysis highlights how markets have responded to past macroeconomic conditions and technical levels, it cannot predict future outcomes with certainty due to unpredictable economic and geopolitical variables.
What is the difference between headline S&P 500 and equal-weighted S&P 500?
The standard S&P 500 weights companies by market capitalization, giving larger firms more influence. An equal-weighted index gives every constituent company the same weight, providing a clearer picture of the average stock's performance.
Next Actions for Market Participants
To apply these insights effectively, begin by auditing your current portfolio allocation against broad index benchmarks. Review whether your holdings reflect the sector concentration of the headline S&P 500 or a more diversified posture. Consult with a qualified financial professional to align your long-term wealth strategy with current macroeconomic realities and personal risk parameters.