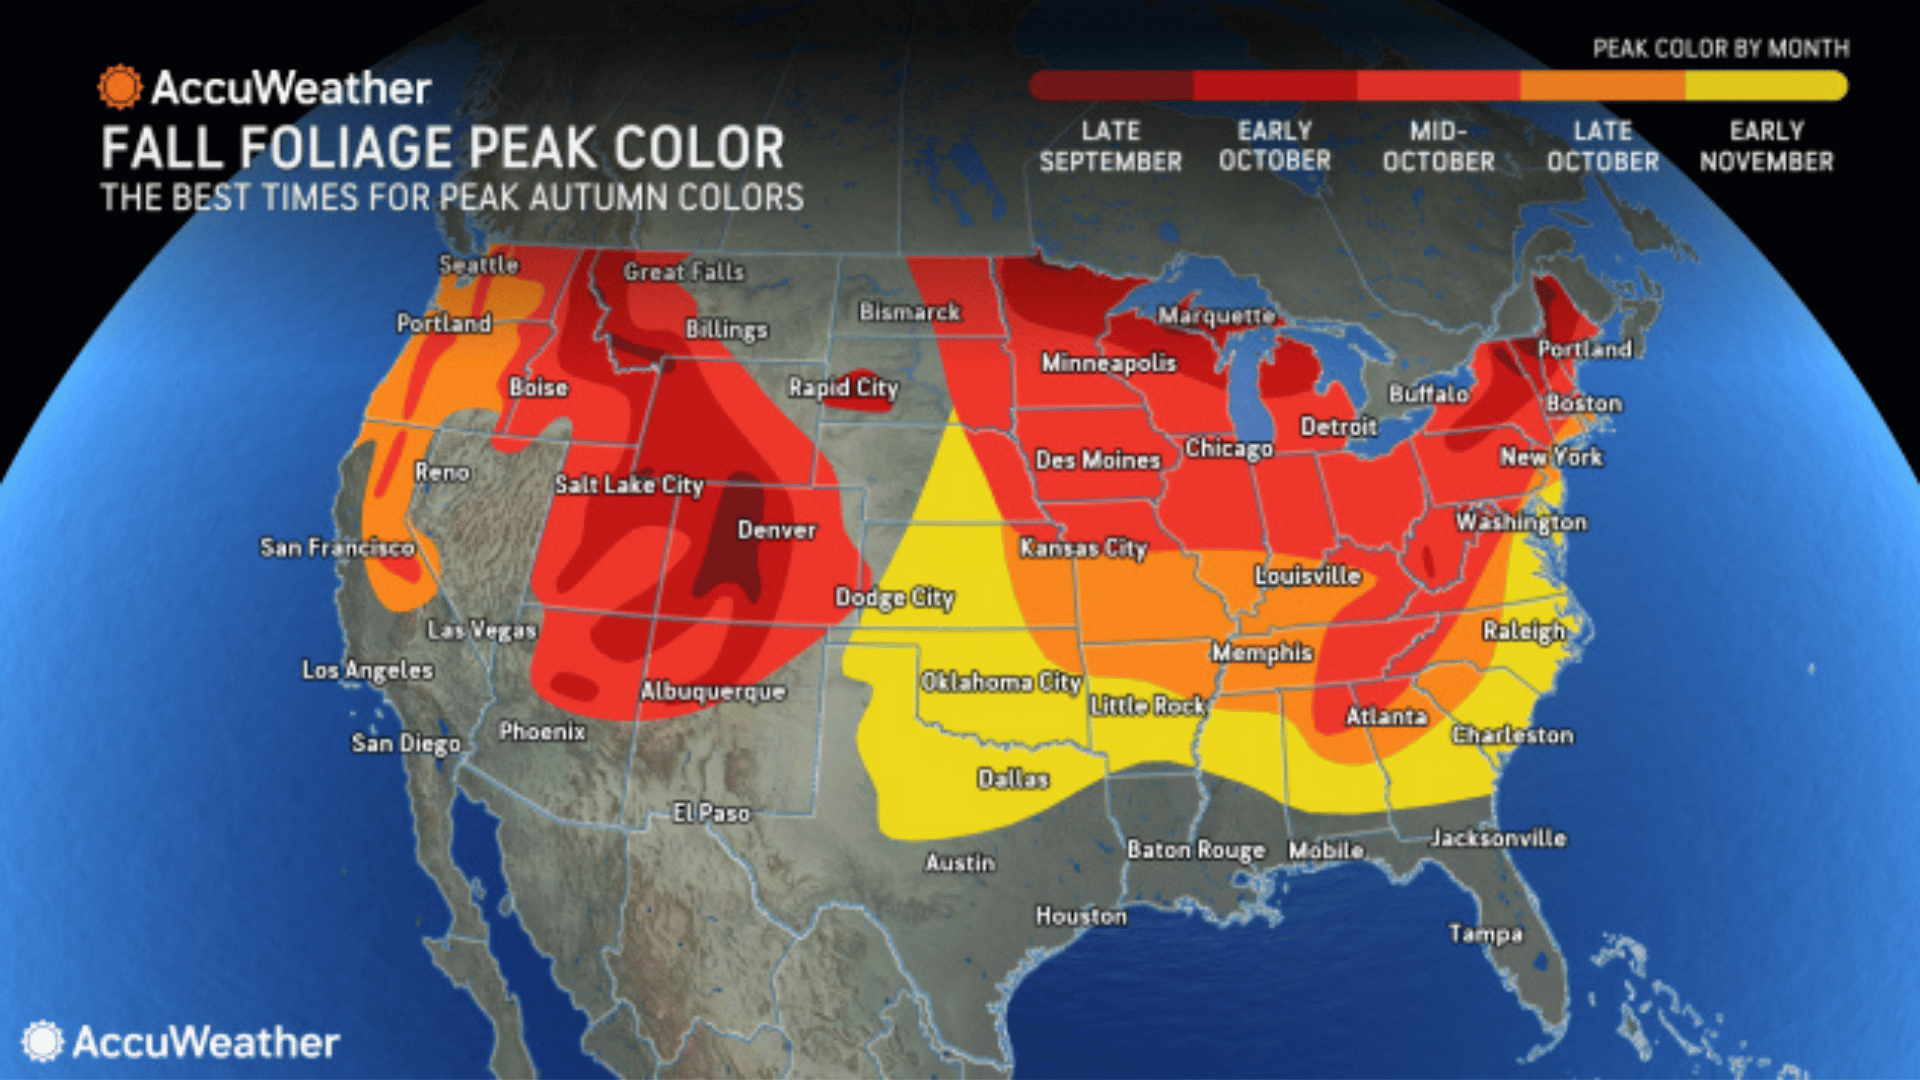
The 2017 fall foliage map created by SmokyMountains.com established a widely recognized standard for predicting autumn leaf color timing across the contiguous United States. By analyzing millions of historical and real-time data points from weather agencies, the interactive tool forecasts when foliage transitions from green to peak color across every county in the lower 48 states.
The Origins and Legacy of the Interactive Fall Foliage Prediction Map
First introduced in 2013 and heavily refined by 2017, the interactive fall foliage prediction map addressed a longstanding problem for travelers: autumn leaves change color based on complex environmental variables that shift every year. Historically, leaf-peeping tourists relied on static calendar estimates or localized word-of-mouth reports, which frequently led to missed peaks due to unpredictable late-summer warmth or unseasonal droughts.
Created by data analysts and travel experts at SmokyMountains.com, led by co-founder David Angotti, the tool became the premier nationwide visual guide for mapping autumn color shifts. The 2017 model integrated an updated mathematical algorithm that evaluated historical temperature and precipitation trends alongside real-time forecasts from the National Oceanic and Atmospheric Administration (NOAA National Centers for Environmental Information).
By dividing the continental United States into thousands of individual county regions, the map enabled users to drag an interactive timeline slider from late August through November. This visual interface demonstrated week-by-week foliage progression across seven distinct stages:
- No Change: Leaves retain full green chlorophyll saturation.
- Minimal: Subtle light green and early yellow hints appear on outer canopy branches.
- Patchy: Scattered trees show vivid hues, primarily along ridgelines or exposed tree lines.
- Partial: Widespread color changes across multiple species, though green still dominates overall.
- Near Peak: Bright colors predominate; ideal viewing begins in higher elevations and northern latitudes.
- Peak: Maximum color vibrancy across all local deciduous tree species.
- Past Peak: Rapid leaf drop occurs; muted browns dominate as trees prepare for winter dormancy.
Although designed initially to help visitors plan trips to the Great Smoky Mountains region, the algorithmic model proved adaptable for national forecasting. Today, the core data modeling techniques introduced during the 2017 mapping cycle continue to inform modern foliage prediction tools.
How Predictive Foliage Models Work: The Science and Data Behind the Map
Predicting when forest canopies will reach peak color requires synthesizing meteorological, geographical, and botanical inputs. The predictive engine behind the 2017 map operated by parsing tens of thousands of data points to model plant physiology responses under varying weather conditions.
| Historical Weather | Real-Time Forecasts | Botanical Variables |
|---|---|---|
| 30-Year Temperature Means | NOAA Temperature Projections | Native Tree Types |
| Historical Rainfall Rates | Short-Range Precipitation | Soil Moisture |
| Sunlight Hour Records | Daylight Loss Calculations | Elevation Profiles |
Key Data Inputs Fueling the Algorithm
- Photoperiod (Daylight Length): Unlike temperature or rain, the decrease in daylight hours is astronomically fixed. As nights lengthen after the summer solstice, deciduous trees receive a consistent signal to begin forming an abscission layer at the base of leaf stems.
- Temperature Trends: Daily maximums and minimums play a pivotal role. Cool, crisp night temperatures above freezing accelerate chlorophyll destruction, while warm, sunny days maximize sugar retention within leaf tissue. Conversely, early hard freezes can instantly kill leaf tissues, turning leaves brown before vibrant pigments develop.
- Precipitation and Soil Moisture: Severe summer droughts stress trees, causing them to drop leaves prematurely or skip vibrant color phases altogether. Adequate late-summer moisture keeps leaves healthy enough to undergo a full chemical color transition.
- Elevation and Microclimates: Higher elevations experience cooler air temperatures earlier in the season than nearby valleys. The algorithmic model accounts for lapse rates—the mathematical rate at which air temperature decreases with altitude.
By feeding these dynamic variables into a predictive matrix, the software generates probability curves for peak timing at the county level. While no mathematical model can account for sudden, localized micro-bursts or sudden windstorms that strip branches overnight, the 2017 foliage map provided a remarkably accurate macro-level timeline for autumn travelers.
The Biochemistry of Autumn Leaves: Why Colors Shift from Green to Red and Gold
Understanding why foliage maps change requires examining the cellular changes occurring inside deciduous leaves as autumn approaches. Tree leaves act as biological solar panels, packed with chemical pigments that respond to seasonal environmental cues.
- Summer: High Sunlight & Warmth
- Chlorophyll Production (Green) masks underlying Carotenoids (Yellow/Orange)
- Autumn: Shorter Days & Cool Nights
- Abscission Layer Forms
- Chlorophyll Production Ceases
- Green Fades
- Chemical Unmasking & Synthesis
- Carotenoids & Flavonoids Exposed: Yellows & Oranges (Birch, Aspen, Poplar)
- Anthocyanins Synthesized: Reds & Purples (Sugar Maple, Red Oak, Dogwood)
Chlorophyll Breakdown
During spring and summer, leaves are saturated with chlorophyll, the green pigment responsible for absorbing sunlight during photosynthesis. Because chlorophyll degrades rapidly in sunlight, trees continuously produce it throughout the growing season. When autumn daylight decreases, trees cease chlorophyll production and reabsorb valuable nutrients into their trunk and root system for winter storage. As existing chlorophyll breaks down, the green color fades, exposing other pigments previously hidden underneath.
Carotenoids and Flavonoids (Yellows and Oranges)
Carotenoids (such as carotene and xanthophyll) are present within leaf cells throughout the entire growing season. They assist chlorophyll by absorbing complementary wavelengths of light. When chlorophyll degrades in autumn, these stable carotenoid molecules remain, revealing brilliant shades of gold, yellow, and deep orange. Species like birch, yellow poplar, hickory, and quaking aspen owe their bright yellow autumn displays entirely to carotenoids.
Anthocyanins (Reds, Crimson, and Purples)
Unlike carotenoids, anthocyanins are not present in leaves during the summer. Instead, trees actively manufacture these pigments in late summer and early autumn. As an abscission layer of corky cells forms across the base of the leaf petiole (stem), sugar produced by photosynthesis becomes trapped within the leaf blade. Warm, sunny days induce high sugar production, while cool (but non-freezing) autumn nights trap those sugars within the leaf, triggering chemical reactions that synthesize anthocyanins.
Anthocyanins produce brilliant scarlet, red, and purple hues in species such as sugar maples, red maples, dogwoods, and sumacs. Strong sunlight combined with crisp night temperatures produces the most intense red coloration.
Regional Breakdown: Historical Peak Timing Patterns Across the U.S.
Because geographic latitude, ocean currents, and mountainous topography dictate local climate conditions, peak foliage moves in a gradual wave across the United States, generally traveling from north to south and high elevation to low elevation.
- Late Sept: Northern Tier & High Rockies (ME, Northern VT/NH, MN, CO)
- Early Oct: Mid-Latitude Forests & Inland Upper Midwest (NY, PA, MI, WI)
- Mid Oct: Central Appalachians & Mid-Atlantic (VA, WV, Southern OH, IN)
- Late Oct: Southern Appalachians & Ozarks (NC, TN, AR, Northern GA)
- Early Nov: Deep South & Coastal Valleys (SC, AL, MS, East TX)
1. New England and the Northeast
Home to dense stands of sugar maples and American beech trees, New England represents the classic leaf-peeping destination. Northern Maine, northern Vermont, and New Hampshire’s White Mountains typically hit peak status between late September and the first week of October. Southern New England, coastal Massachusetts, and New York’s Hudson Valley reach their height in mid-to-late October.
2. The Upper Midwest and Great Lakes
States like Michigan, Wisconsin, and Minnesota benefit from the temperature-modifying influence of the Great Lakes. Minnesota’s North Shore along Lake Superior and Michigan’s Upper Peninsula generally peak in late September or early October. Lower Michigan and northern Indiana transition during mid-October, displaying vibrant yellows from birch and deep reds from native maples.
3. Central and Southern Appalachians
The Appalachian Mountains present a long, continuous foliage season due to extreme topographic variations. High peaks in the Blue Ridge Mountains and Great Smoky Mountains—such as Clingmans Dome or Mount Mitchell—often reach peak color by late September or early October. Meanwhile, nearby low-elevation valleys, river basins, and surrounding foothill cities do not hit full peak until late October or early November. The National Park Service Great Smoky Mountains provides updated ground monitoring reports every autumn to help visitors navigate these elevation-based shifts.
4. The Rocky Mountains and Western States
Western autumn colors depend almost entirely on quaking aspen groves, which transform into vast seas of brilliant shimmering yellow and gold. Because high elevation speeds up the foliage clock, high-altitude regions in Colorado, Wyoming, and Utah peak early—often between mid-September and early October. Pacific Northwest coastal ranges, dominated by evergreen conifers, feature pockets of bigleaf maple and vine maple that reach peak in mid-to-late October.
Comparative Guide to Fall Foliage Seasons Across U.S. Regions
The table below outlines how forest composition, geographic conditions, and typical weather patterns dictate autumn foliage timing across key travel zones in the lower 48 states.
| Region | Peak Timing Window | Dominant Tree Species | Primary Pigments | Weather Drivers for Best Color |
|---|---|---|---|---|
| Northern New England (ME, VT, NH) | Late Sept – Early Oct | Sugar Maple, Red Maple, American Beech, Yellow Birch | Anthocyanins (Red), Carotenoids (Yellow) | Warm, sunny fall days paired with crisp, dry, non-freezing nights. |
| Upper Midwest (Northern MI, WI, MN) | Late Sept – Early Oct | Sugar Maple, Quaking Aspen, Paper Birch, Tamarack | Carotenoids (Yellow/Gold), Anthocyanins (Red) | Adequate late-summer rain followed by sudden cool autumn dry snaps. |
| Mid-Atlantic & Central Appalachians (PA, NY, WV, VA) | Early Oct – Mid Oct | Red Oak, White Oak, Sugar Maple, Tulip Poplar | Carotenoids (Yellow/Bronze), Anthocyanins (Crimson) | Moderate summer moisture; absence of early severe wind or rainstorms. |
| Southern Appalachians (NC, TN, Northern GA) | Mid Oct – Late Oct (Low valleys: Early Nov) | Scarlet Oak, Black Gum, Sourwood, Red Maple | Anthocyanins (Scarlet/Purple), Carotenoids (Yellow) | Gradual cooling trends without sudden sub-zero frost events in September. |
| Rocky Mountains (CO, UT, WY) | Mid Sept – Early Oct | Quaking Aspen, Scrub Oak, Narrowleaf Cottonwood | Carotenoids (Bright Gold/Yellow), Anthocyanins (Red scrub oak) | Clear late-summer skies; cool, dry high-altitude air masses. |
| Pacific Northwest (WA, OR, Northern CA) | Mid Oct – Late Oct | Bigleaf Maple, Vine Maple, Red Alder, Pacific Dogwood | Carotenoids (Yellow/Orange), Anthocyanins (Muted Red) | Moderate humidity without excessive early autumn rainstorms. |
How to Use Historical Foliage Maps to Plan Autumn Leaf-Peeping Trips
While interactive foliage maps provide accurate macro-level predictions, executing a successful leaf-peeping trip requires leveraging ground-truth data, geographical awareness, and strategic planning.
- Step 1: Check Macro Forecasts: Review nationwide models (SmokyMountains.com)
- Step 2: Account for Elevation: High elevations peak 1-3 weeks before valleys
- Step 3: Ground-Truth Data: Cross-reference live webcams & park rangers
- Step 4: Book Flexible Travel: Select destinations with varied terrain options
1. Factor Elevation Into Your Itinerary
Elevation acts as a primary control knob for autumn temperatures. Air temperatures cool by roughly 3.5°F (1.9°C) for every 1,000 feet gained in altitude. As a result, mountain summits and high passes reach peak foliage 1 to 3 weeks earlier than nearby lowland valleys. If an interactive map indicates that a mountain county is "Past Peak," traveling to lower elevations within that same county will often yield prime viewing opportunities.
2. Verify with Live Webcams and Local Forest Rangers
Algorithmic models project expected trends based on weather forecasts, but unpredicted localized weather—such as heavy rain or high winds—can strip trees of leaves rapidly. Before traveling, cross-reference predictive maps with live webcams maintained by state tourism departments or check regional field reports from the U.S. Forest Service.
3. Maintain Travel Flexibility
Because weather anomalies can shift peak colors earlier or later by up to ten days, rigid lodging bookings can result in arriving before colors turn or after leaves have fallen. Build flexibility into your travel itinerary by planning base locations near areas with diverse topography.
For instance, staying in a valley town near a national park lets you drive up into high elevations if the season is early, or explore river basins and lower mountain trails if the season is late.
Frequently Asked Questions About Fall Foliage Prediction Maps
How accurate was the 2017 fall foliage map?
The 2017 predictive model achieved high macro-level accuracy, correctly forecasting regional peak windows within a 3-to-5-day window for most of the continental United States. However, localized microclimates, unexpected high-wind events, or severe rainstorms can accelerate leaf drop in specific valleys, causing local variations from broader county-level predictions.
What causes fall foliage to peak earlier or later than predicted?
Foliage timing is primarily altered by temperature and moisture deviations in late summer and early autumn. Unseasonably warm early-autumn temperatures delay chlorophyll breakdown, pushing peak timing later. Conversely, moderate summer droughts or early, non-killing cold snaps can cause foliage to peak earlier or drop prematurely.
Who created the nationwide interactive fall foliage prediction map?
The interactive nationwide fall foliage prediction map was designed and built by David Angotti and his team at SmokyMountains.com. First launched in 2013, the tool was refined in 2017 to incorporate expanded historical weather datasets, regional tree species profiles, and real-time NOAA predictive inputs.
Does weather during the summer affect fall foliage color intensity?
Yes. A healthy growing season with adequate summer rainfall followed by an autumn characterized by bright, sunny days and cool, crisp nights creates the ideal conditions for vivid color. Severe summer droughts stress trees, causing leaves to turn brown and drop early, while unseasonably warm autumn nights reduce the chemical synthesis of bright red anthocyanin pigments.
How does elevation alter foliage peak timing in mountain ranges?
Higher elevations experience lower average temperatures and earlier cool nights than adjacent valley floors. As a result, trees at high mountain elevations (such as ridgelines above 4,000 feet) enter dormancy and reach peak color significantly earlier—often two to three weeks ahead of nearby low-elevation valleys.
Practical Guidance for Leaf Viewing: Next Steps
To maximize your chances of catching peak foliage during any autumn season:
- Start Monitoring Early: Begin checking updated predictive foliage maps by mid-August to establish a baseline forecast for your target region.
- Select Multi-Elevation Destinations: Choose travel hubs located within short driving distance of significant elevation changes, such as mountain passes, national parks, or river gorges. This ensures accessible foliage viewing regardless of minor timing shifts.
- Cross-Verify Local Conditions: Confirm map forecasts 48 to 72 hours before departure using state park updates, local forestry social feeds, and regional webcam feeds.
- Pack for Rapid Weather Shifts: Autumn weather in high-foliage regions changes rapidly. Dress in layers and maintain an emergency kit in your vehicle, especially when navigating isolated mountain roads during late-season drives.