The term "24 school shootings in 2018" refers to a specific data point often cited in public discourse regarding gun violence in American educational institutions. Establishing this figure requires careful navigation of varying definitions—ranging from shots fired on campus to injuries and fatalities—provided by organizations such as the K-12 School Shooting Database, Everytown for Gun Safety, and the Center for Homeland Defense and Security.
Defining the Parameters of School Shootings
To understand the significance of the 24 incidents reported in 2018, one must first recognize that there is no singular, government-mandated definition of a "school shooting." Researchers and policy analysts often apply different criteria, which leads to discrepancies in public reporting.
Some databases classify a school shooting as any instance where a firearm is brandished, discharged, or a bullet hits school property for any reason, including suicides, accidental discharges, or incidents occurring outside of school hours. Other methodologies are more restrictive, focusing only on active shooter events where the intent is to cause mass casualties within the school building during the academic day.
When researchers arrive at the figure of 24, they are generally utilizing a specific, narrow filter. This often includes incidents where a person was killed or wounded by a firearm on school grounds while school was in session. By narrowing the scope, analysts aim to distinguish between targeted acts of violence and broader categories like community violence that happens to take place near a school zone.
The Role of Data Collection Agencies
The reliance on non-governmental databases is a hallmark of this field. Because the federal government does not maintain a comprehensive, real-time public-facing registry of every individual discharge of a firearm on school property, the task falls to academic institutions and non-profit research groups.
The K-12 School Shooting Database, for example, is a widely referenced source that compiles incidents through news reports, police logs, and public records. Their methodology is highly inclusive, which often results in higher totals than the 24-incident count. When a report specifically cites "24 school shootings," it is almost always referencing a subset of data that excludes non-injury incidents or events that occurred off-hours. This differentiation is critical for policymakers who use this data to allocate funding for mental health services, physical security infrastructure, and law enforcement training.
Comparative Analysis of Incident Reporting
Understanding the landscape of 2018 requires looking at how different entities categorize these events. The following table illustrates the variance in data collection methodology, which explains why the figure of "24" may appear in one report while other sources report significantly higher numbers for the same calendar year.
| Source/Category | Primary Focus | Typical 2018 Methodology |
|---|---|---|
| K-12 School Shooting Database | Any firearm discharge | Includes all incidents, regardless of injury/intent. |
| Everytown for Gun Safety | Targeted mass harm | Focuses on incidents with casualties on school grounds. |
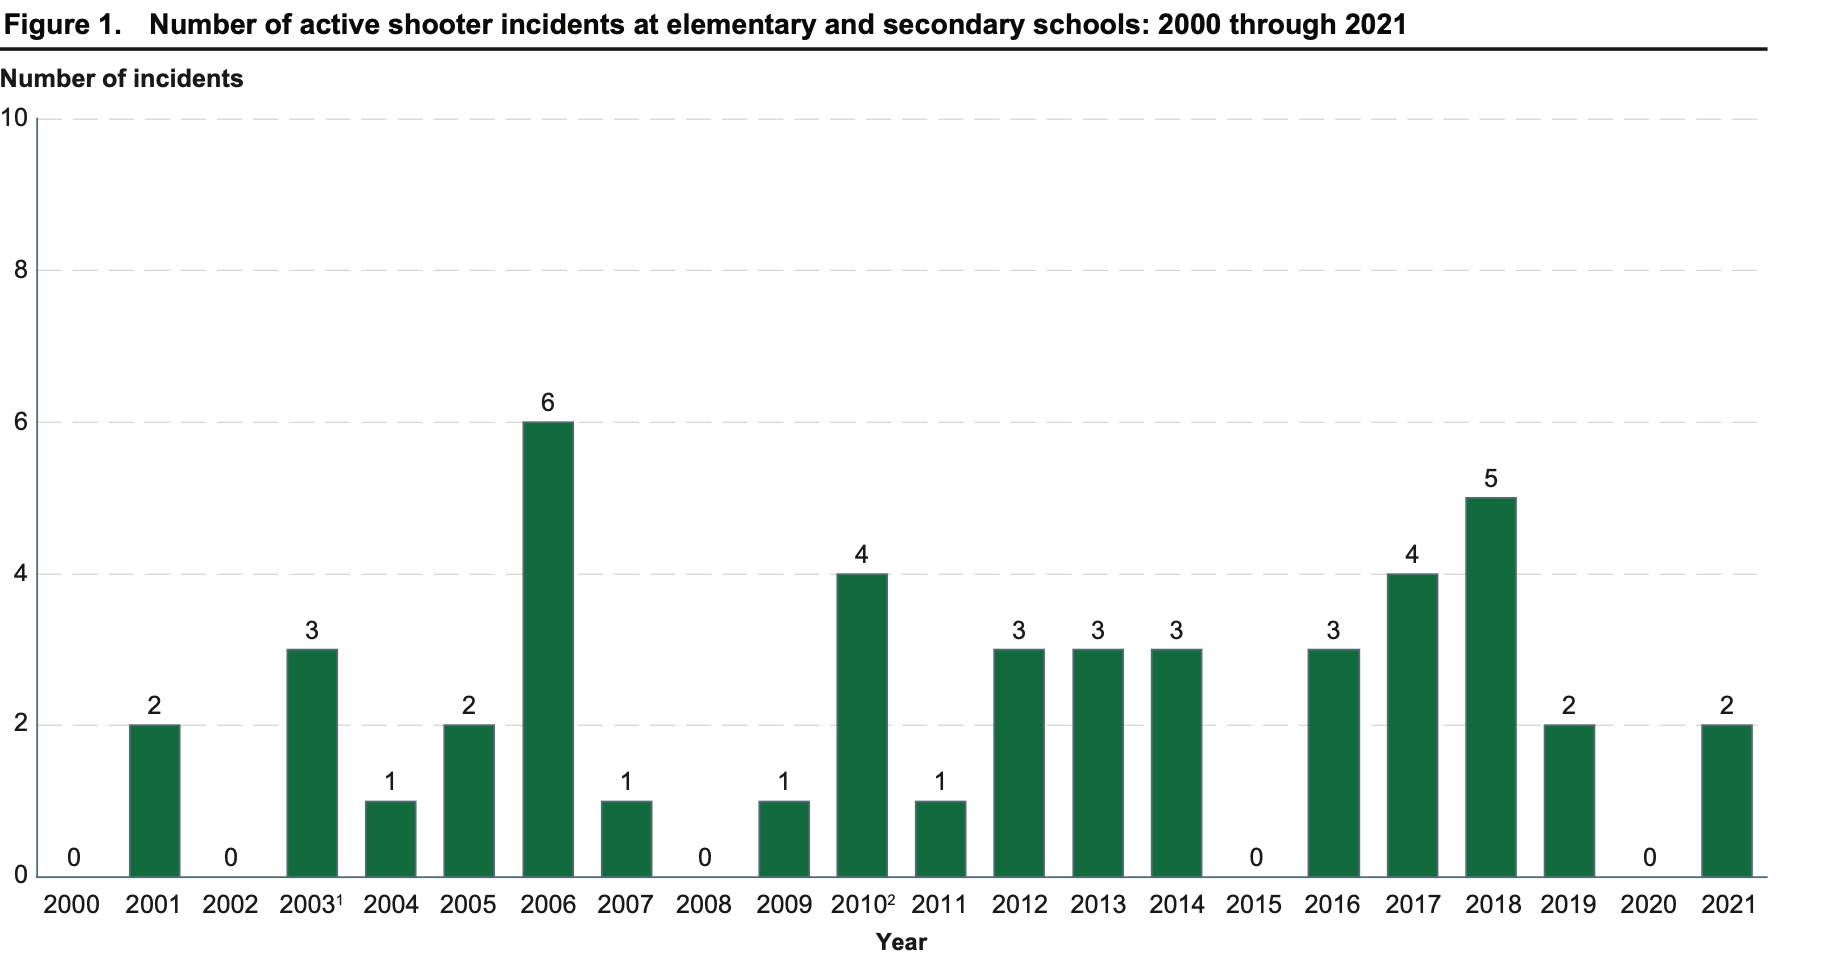
| CHDS (Federal/Academic) | Active shooter focus | Filters for active shooter events during school hours. |
| Narrow Statistical Filters | Incident-specific impact | Targets the "24" count by excluding non-lethal anomalies. |
The variation in these figures does not imply that any source is "incorrect"; rather, it highlights that the definition of the phenomenon is highly dependent on the lens through which one views the security of educational environments.
The Impact of High-Profile Events in 2018
The year 2018 is historically significant in the context of school safety, primarily due to the mass shooting at Marjory Stoneman Douglas High School in Parkland, Florida. This event served as a catalyst for a national shift in how school districts approach physical security and behavioral intervention.
Following the February 2018 tragedy, many states passed "Red Flag" laws and increased appropriations for the School Safety Clearinghouse. The "24 incidents" figure is frequently discussed in the context of the legislative aftermath of these events. Public discourse shifted from merely reacting to incidents as they occurred to a proactive model involving "threat assessment teams." These teams are tasked with evaluating students who may be on a pathway to violence before an incident takes place.
Practical Implications for School Safety Infrastructure
For school administrators and security professionals operating in 2026, the data from 2018 provides a baseline for evaluating the efficacy of current safety measures. Most school districts have moved toward a layered defense strategy, which incorporates the following elements:
- Physical Hardening: The installation of high-strength glass film, electronic access control systems, and automated lockdown mechanisms that can be triggered from a central administrative office.
- Behavioral Intervention: The establishment of multidisciplinary teams—composed of psychologists, school resource officers (SROs), and social workers—to identify and support students who exhibit at-risk behaviors.
- Communication Protocols: Implementing standardized mass notification systems that provide real-time updates to law enforcement, parents, and school staff during an emergency.
- Training and Drills: Moving away from static "lockdown" drills toward more dynamic options-based responses, often termed A.L.I.C.E. (Alert, Lockdown, Inform, Counter, Evacuate) training.
Challenges in Measuring Prevention
A recurring question in school safety research is whether the number of incidents is truly decreasing or if reporting standards have simply become more stringent. When discussing the 24 incidents of 2018, it is important to acknowledge the challenge of measuring "prevented" events.
Thousands of potential threats are neutralized annually through anonymous reporting systems and social media monitoring. Because these incidents are prevented, they do not appear in databases that track completed shootings. Therefore, while the number 24 serves as a benchmark for realized violence, it does not account for the effectiveness of modern intervention strategies that have been refined since 2018.
Frequently Asked Questions
Why do different reports show different numbers of school shootings for the same year? The discrepancy exists because there is no universal legal definition for a "school shooting." Some researchers include any firearm discharge, while others include only events with injuries or deaths. When you see a specific figure like 24, it is usually derived from a report using a very specific set of criteria that excludes minor incidents or non-injury events.
Is the "24 shootings" figure related to a specific legislative study? Often, this figure is cited in reports that evaluate the effectiveness of school security funding. Legislative bodies and independent research firms may filter data to exclude incidents that do not meet the legal definition of an active shooter event to better analyze where state and federal funds should be directed.
How have school safety measures changed since 2018? Post-2018, the focus shifted from purely physical barriers to holistic threat assessment. Schools are now more likely to implement internal reporting systems, mental health monitoring, and improved coordination between local law enforcement and school administration to prevent violence before a firearm is even brought onto campus.
Does the 2018 data include suicides on school property? This depends on the database. Many comprehensive trackers include suicides if they occur on school grounds, as these represent a form of violence affecting the school climate. However, more narrow reports focused on active shooter events explicitly exclude suicides to focus on external or internal threats directed at students and staff.
What is the most accurate way to interpret school safety data? The most accurate approach is to look for reports that clearly define their inclusion criteria (e.g., "only incidents resulting in injury" or "incidents during school hours"). Always check the methodology section of a research report to see what the authors define as a "shooting" before drawing conclusions about trends.
Recommendations for Further Verification
For those interested in the raw data or the specific methodology used to reach the count of 24, the most reliable path is to consult the original peer-reviewed journals or official government reports provided by the National Institute of Justice. Avoid relying solely on secondary news summaries, which may aggregate data from different sources without standardizing the definition of an "incident."
If you are a stakeholder in school safety—such as a board member, administrator, or concerned parent—the best course of action is to focus on local, district-level safety audits. While national statistics provide a birds-eye view of trends, the safety of an individual school is contingent upon the specific protocols, staffing, and community engagement strategies implemented at the local level. Ensure that your district has a clear, accessible plan for threat reporting and that physical security measures are reviewed by certified safety professionals on an annual basis.