In A/B testing, sample size is the number of participants required in each group to detect a specific change in conversion rate with statistical confidence. It is determined by the baseline conversion rate, the minimum detectable effect (MDE), the desired statistical power (usually 80%), and the significance level (usually 5%).
Determining the correct sample size is not merely a checkbox in a marketing workflow; it is the fundamental bridge between a "lucky guess" and a "data-driven decision." As we operate in 2026, the complexity of user behavior and the sheer volume of digital interactions have made the margin for error slimmer than ever. Testing without a calculated sample size often leads to "underpowered" tests, which fail to detect genuine improvements, or "false positives," where a business invests in a change that actually provides no value.
To truly understand A/B testing sample size, one must look past the simple calculators available online and examine the statistical engine that drives these numbers. This guide provides a comprehensive breakdown of the variables involved, the mathematical logic behind them, and the practical steps necessary to ensure your experiments are both rigorous and actionable.
The Critical Role of Sample Size in Experimentation
The primary goal of any A/B test is to determine if a change (Version B) performs better than the current version (Version A). However, because we cannot test the change on every single potential user in the world simultaneously, we use a sample. The sample size acts as a representative subset of your total audience.
If your sample size is too small, the results will be highly susceptible to "noise"—random fluctuations in data that do not reflect a real trend. For example, if you flip a coin three times and get three heads, you wouldn't conclude that the coin is broken. You would correctly assume the sample size is too small to show the expected 50/50 distribution. In A/B testing, a small sample might show a 20% increase in sales simply because two or three high-value customers happened to visit the site during the test window, not because Version B was superior.
Conversely, an excessively large sample size can be a waste of resources. While larger samples provide more precision, they also take longer to collect. In the fast-moving market of 2026, taking six months to run a test that could have been completed in two weeks results in a high "opportunity cost." You lose the time you could have spent implementing the winner and starting the next experiment.
The Four Pillars of Sample Size Calculation
To calculate the required sample size, you must define four specific statistical parameters. These parameters represent the "levers" you can pull to adjust the sensitivity and duration of your test.
1. Baseline Conversion Rate (BCR)
The baseline conversion rate is the current performance of the page or element you are testing. If you are testing a checkout button, and 5% of people who see it currently click it, your BCR is 5%.
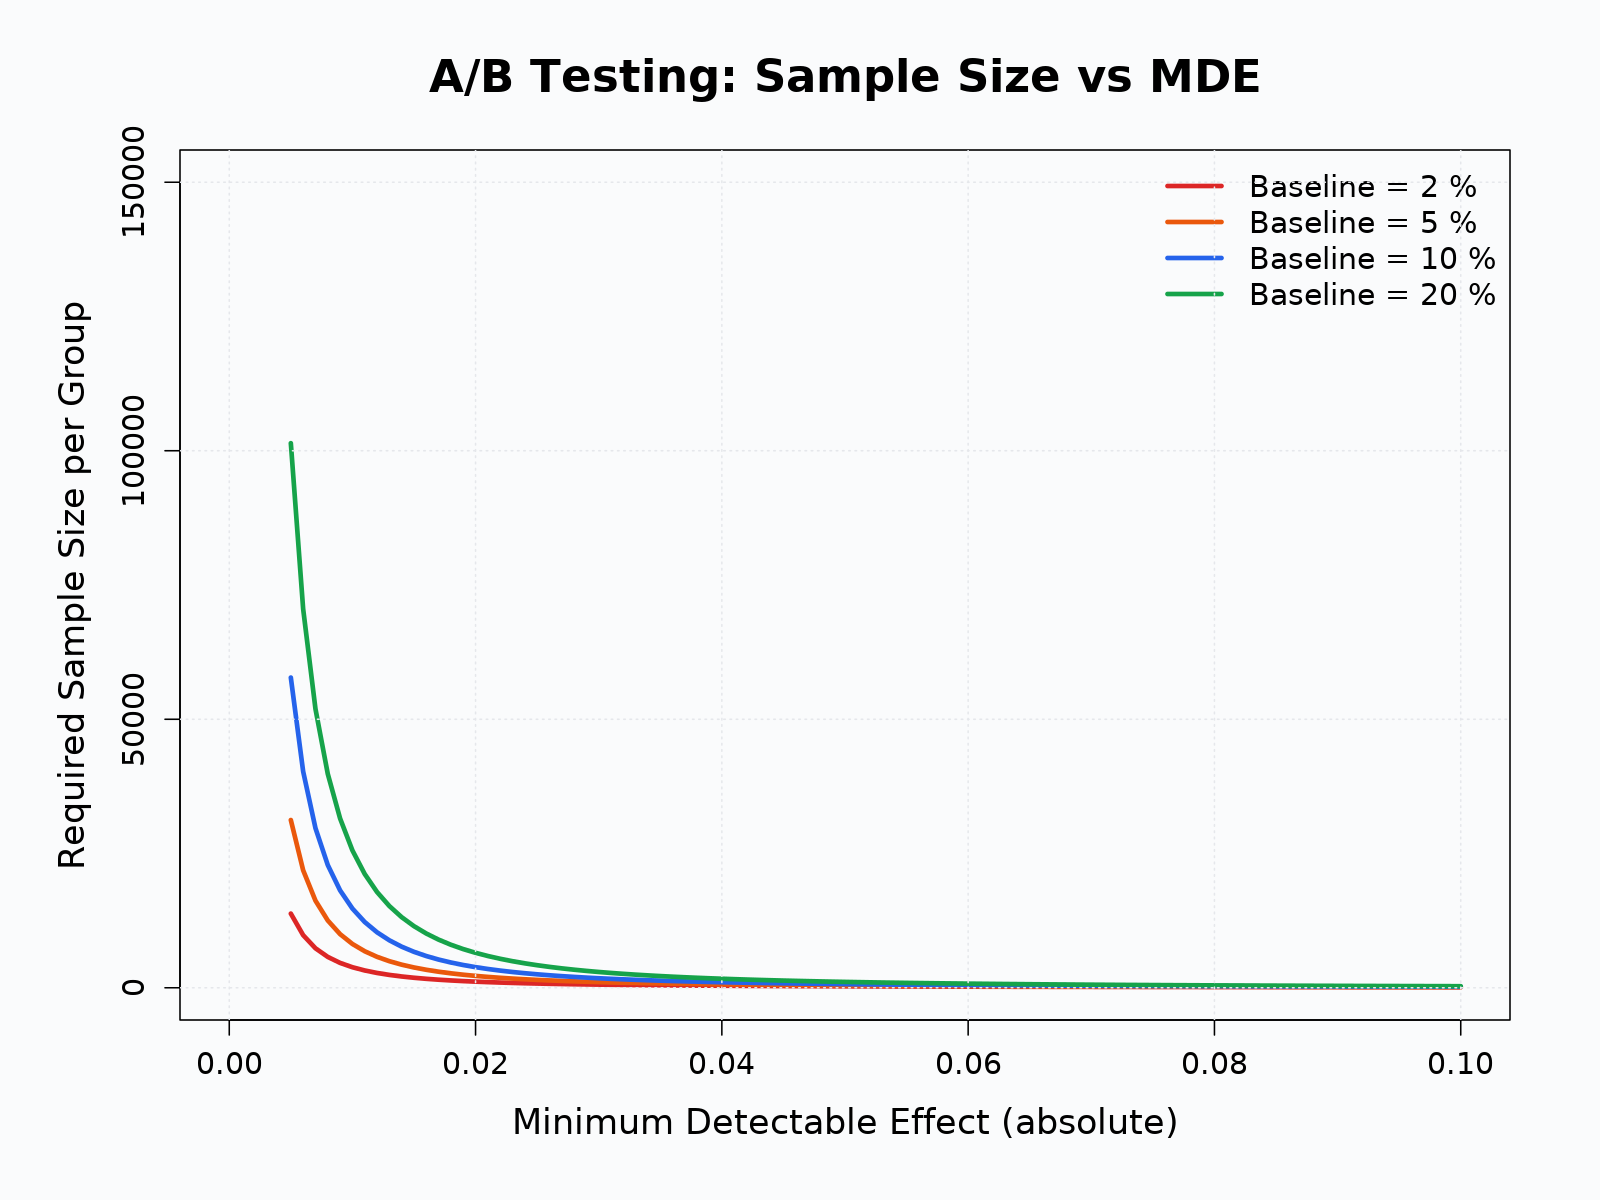
The BCR is crucial because it dictates the amount of "room" available for improvement. Mathematically, it is much easier (requiring a smaller sample) to detect a 10% improvement on a 20% baseline than it is to detect a 10% improvement on a 0.5% baseline. Lower baselines generally require significantly larger sample sizes to achieve statistical significance because the "signal" of a conversion is much rarer.
2. Minimum Detectable Effect (MDE)
The MDE is the smallest change in conversion rate that you care about detecting. It is a measure of the test’s sensitivity. If you set an MDE of 5%, you are telling the calculator that any improvement smaller than 5% is not worth the effort of the test.
There is an inverse relationship between MDE and sample size. If you want to detect a tiny 1% improvement, you will need a massive sample size. If you are only looking for a major 20% "win," you can get away with a much smaller sample. In 2026, experienced teams often set the MDE based on the "economic threshold"—the point at which the cost of implementing the change is justified by the projected increase in revenue.
3. Significance Level (Alpha)
The significance level, often denoted as alpha (α), is the probability of committing a Type I error. A Type I error, or a "false positive," occurs when you conclude that Version B is better than Version A, but the difference was actually due to random chance.
The industry standard for alpha is 0.05 (5%). This means there is a 5% chance that the "winning" result you see is a fluke. If your business is highly risk-averse—for example, if a change to a banking app could potentially disrupt millions of transactions—you might lower your alpha to 0.01 (1%), which would drastically increase the required sample size.
4. Statistical Power (1 - Beta)
Statistical power is the probability of correctly identifying a winner when one actually exists. It is the protection against a Type II error, or a "false negative." A Type II error occurs when Version B is genuinely better, but your test fails to show a statistically significant result.
The standard for statistical power is 0.80 (80%). This means you have an 80% chance of detecting an effect if the MDE you specified is actually present. Increasing power to 90% or 95% provides more certainty but, like alpha, requires more participants.
How Variables Affect Sample Size: A Comparison
The following table illustrates how changes in these parameters influence the number of users you need to recruit for your experiment.
| Variable Change | Impact on Sample Size | Why it Happens |
|---|---|---|
| Lowering MDE (e.g., from 5% to 1%) | Drastic Increase | Detecting smaller differences requires more data to distinguish the "signal" from "noise." |
| Increasing Power (e.g., from 80% to 90%) | Moderate Increase | Higher power reduces the risk of missing a real winner, requiring more evidence. |
| Decreasing Alpha (e.g., from 5% to 1%) | Moderate Increase | Stricter requirements for "proof" mean you need more data to rule out random chance. |
| Lowering BCR (e.g., from 10% to 2%) | Significant Increase | When conversions are rare, you need more total visitors to reach a meaningful count of converted users. |
| Increasing Traffic | No Change to Required Size | Higher traffic doesn't change the math of the sample needed, but it reduces the time to reach it. |
The Mathematical Logic: Why Can't We Just "Wait and See"?
One of the most common mistakes in A/B testing is "peeking" at the results before the required sample size is reached. In 2026, real-time dashboards make this temptation even stronger. However, peeking fundamentally invalidates the significance level (alpha).
This is known as the Multiple Comparisons Problem. If you check a test every day, you are essentially giving the data multiple chances to look "significant" by pure chance. Statistical significance is calculated under the assumption that you will look at the data exactly once—after the predetermined sample size has been reached. If you look early and stop the test because it looks like a winner, you are likely catching a temporary "high" in the data that would have regressed to the mean if the test had continued.
To avoid this, teams use Fixed-Horizon Testing, where the end date is set in stone based on sample size, or Sequential Testing, which uses complex math to allow for early stopping while adjusting the significance thresholds to compensate for the risk.
Step-by-Step: Calculating Your Sample Size
Before launching any experiment in 2026, follow this workflow to ensure your data will be reliable.
- Audit Current Performance: Use your analytics platform to find the current conversion rate for the specific action you are testing. Do not use the site-wide conversion rate; use the rate for the specific funnel step.
- Define the Business Goal: Decide what a "meaningful" win looks like. If a 2% lift won't cover the cost of the developer's time to code the change, set your MDE to 5% or higher.
- Choose Your Confidence Levels: For most marketing tests, the 95% confidence (5% alpha) and 80% power standards are sufficient. For high-stakes product changes, consider 99% confidence.
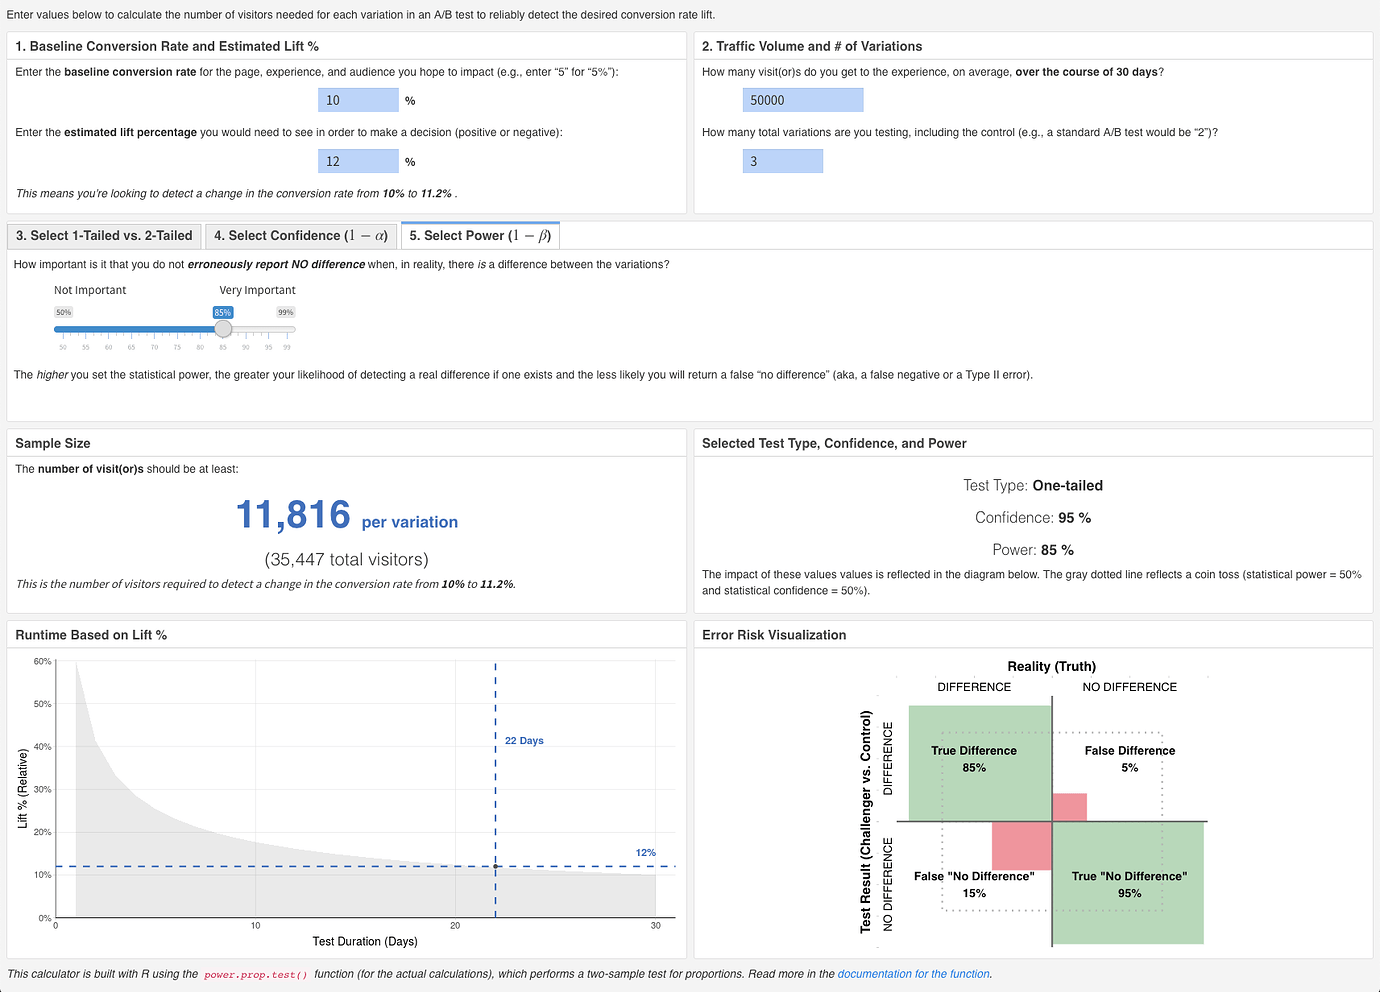
- Use a Statistical Calculator: Input your BCR, MDE, Alpha, and Power into a sample size calculator. These tools use the Power Analysis formula to output the number of visitors needed per variation.
- Calculate Duration: Divide the total required sample size (Version A + Version B) by your average daily traffic. If the calculator says you need 20,000 visitors and you get 1,000 per day, your test must run for at least 20 days.
- Account for Seasonality: Always run tests in full-week increments. Even if you reach your sample size in four days, user behavior on a Monday is different from a Saturday. Running for two or three full weeks ensures you capture a full cycle of human behavior.
Advanced Considerations for 2026
As experimentation matures, two additional factors have become prominent in sample size discussions: Variance and Segmented Testing.
Variance and Data Distribution
For non-binary metrics (like Average Order Value or Revenue Per Visitor), sample size calculation becomes more complex. Unlike a "click" (which is a yes/no 1 or 0), revenue varies wildly between users. One "whale" who spends $5,000 can skew the results of a small test. To account for this, you must know the standard deviation of your data. The higher the variance in your metric, the larger the sample size required to ensure the mean is accurate.
Segmented Testing
If you intend to analyze how a change affects a specific segment (e.g., "Mobile Users in Europe"), your sample size must be calculated based on the traffic for that segment only. A common pitfall is reaching significance for the whole site and then trying to "slice" the data. If the specific segment doesn't have enough participants to meet its own sample size requirement, any conclusions drawn about that segment are statistically invalid.
Common Pitfalls to Avoid
- Underpowering the Test: Running a test with too few people. This often leads to "flat" results where you conclude there was no difference, when in reality, there was a winner you just didn't see.
- Overpowering the Test: Testing for so long that even the most microscopic, meaningless differences become "statistically significant." A 0.001% increase might be significant with a sample of 10 million, but it isn't profitable.
- Ignoring the "Winner's Curse": This happens when a test is stopped early because it looks like a massive win. Often, these "extreme" wins are just statistical anomalies that disappear once the feature is fully rolled out.
- Changing Parameters Mid-Test: If you change the MDE or traffic allocation while the test is running, you must restart the calculation. The math depends on a consistent environment.
Verification and Quality Control
Before concluding a test, always verify that the "SRM" (Sample Ratio Mismatch) is not present. If you set your traffic split to 50/50, but you end up with 10,500 visitors in A and 9,500 in B, something is wrong with your tracking or randomization. Even if the results look significant, an SRM indicates a technical bias that makes the sample size calculation irrelevant.
In 2026, most top-tier experimentation platforms have built-in SRM checkers. If a mismatch is detected, the integrity of the sample is compromised, and the test should usually be discarded and restarted after the technical bug is found.
Frequently Asked Questions
How does traffic volume affect sample size? Traffic volume does not change the number of people required for statistical significance, but it dictates how long it will take to reach that number. If a calculator says you need 5,000 users, that number remains 5,000 whether you get 100 visitors a day or 10,000. Higher traffic simply allows you to complete tests faster and run more experiments per year.
Can I stop a test once it reaches statistical significance? No. You should only stop the test once it has reached the predetermined sample size. "Significance" can fluctuate throughout a test (the "peeking" problem). If you stop the moment the line crosses the 95% threshold, you are likely capturing a false positive. Wait until the full sample is collected to ensure the result is stable.
What is the difference between a one-tailed and two-tailed test in sample size? A two-tailed test checks if Version B is either better or worse than Version A. A one-tailed test only checks if Version B is better. Most A/B testing experts recommend two-tailed tests because it is equally important to know if a change is hurting your conversion rate as it is to know if it is helping. Two-tailed tests require a larger sample size but provide more comprehensive risk protection.
Why is my calculated sample size so large? If your calculated sample size seems impossible to reach, it is usually because your MDE is too small or your baseline conversion rate is very low. To reduce the required sample size, you can either increase the MDE (decide to only look for bigger wins) or test a higher-level metric (like "Add to Cart" instead of "Completed Purchase") that has a higher baseline conversion rate.
Does 2026 AI-driven testing change sample size rules? AI can optimize the allocation of traffic (Multi-Armed Bandit testing), but it does not change the underlying laws of statistics. While AI can help you "exploit" a winner faster by shifting traffic to the better-performing version, you still need a statistically valid sample size to "explore" and confirm that the winner is real before fully committing.
Practical Recommendation
When planning your next A/B test, start by defining your Economic Threshold for the Minimum Detectable Effect. Do not simply use the default settings in a calculator. Ask your stakeholders: "What is the smallest lift that would make this project a success?" Once you have that number, use a power analysis tool to determine your sample size and commit to a Fixed-Horizon approach. Resist the urge to peek at results daily, and ensure your test runs for at least two full business cycles (usually 14 days) to account for weekly variability. For teams with low traffic, prioritize testing "high-impact" changes that have a large MDE, as these require the smallest samples to prove.