The total population of the United States in 1850 was 23,191,876, according to the official Seventh Decennial Census, which included 3,204,313 enslaved individuals. This milestone demographic snapshot captured a rapidly expanding nation experiencing unprecedented territorial acquisition, industrial evolution, and large-scale immigration that permanently altered its social and economic fabric.
Analyzing the 1850 population requires looking far beyond a single grand total. The year 1850 marks a watershed moment in demographic data collection, historical geography, and sociological study. By examining official census returns, geographic distribution, racial and legal demographics, immigration patterns, and economic conditions, researchers can paint a detailed portrait of a nation standing on the precipice of profound internal transformation.
The Methodology and Scope of the 1850 Census
To understand the 1850 population statistics, one must first understand how the data was gathered. Authorized by the Census Act of May 23, 1850, the Seventh Decennial Census introduced a massive leap forward in precision, scope, and administrative rigor compared to its predecessors.
Innovations in Data Collection
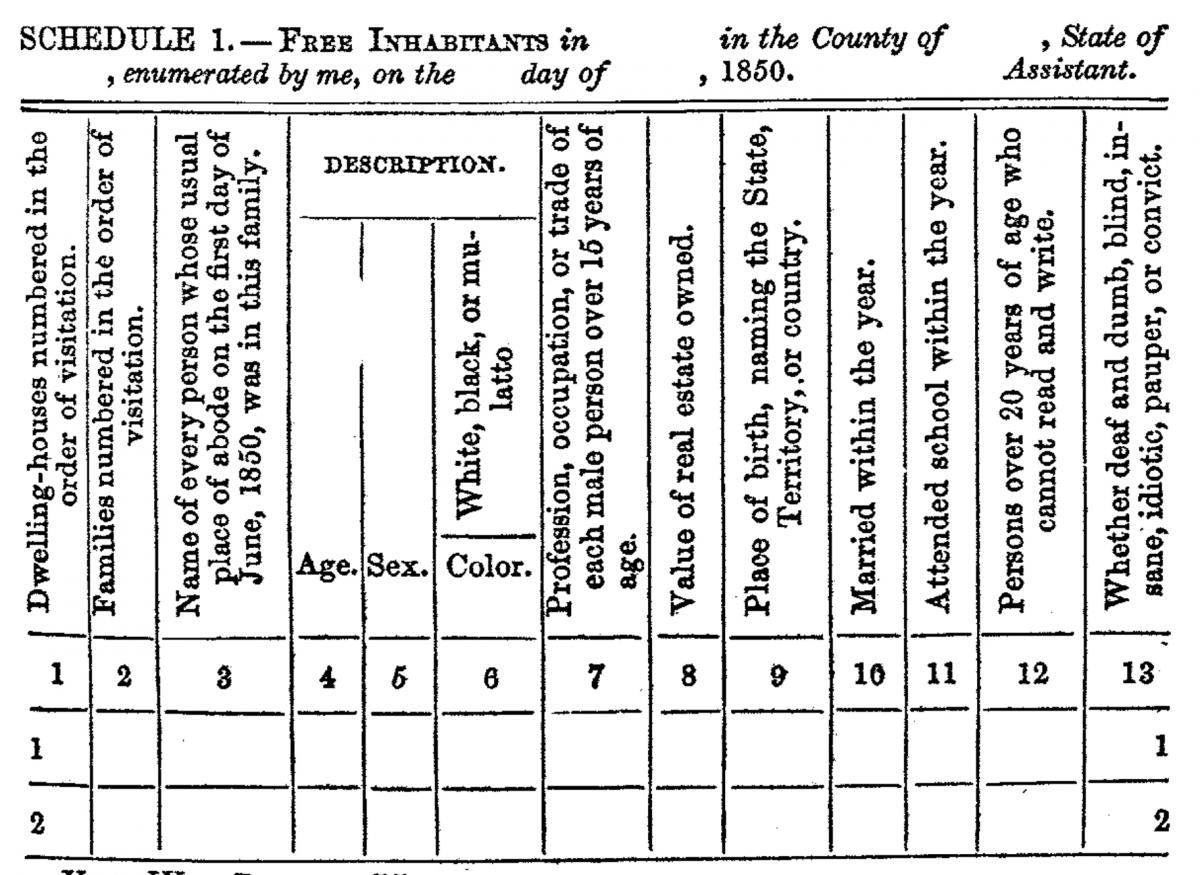
Prior to 1850, federal marshals conducted the census by visiting households and recording aggregate figures for various categories, such as the number of white males under ten or free colored females over forty. The 1850 census changed this approach fundamentally by mandating individual-level enumeration.
For the first time, every free inhabitant was listed by name, providing an unprecedented treasure trove for historians and genealogists. Enumerators recorded specific details for every individual, including:
- Full name
- Age and exact or approximate sex
- Color (race)
- Profession, occupation, or trade of each male over 15 years of age
- Value of real estate owned
- Place of birth (State, Territory, or Country)
- Whether married within the year
- School attendance within the year
- Literacy levels (whether able to read and write for those over 20)
- Whether deaf, dumb, blind, insane, idiotic, pauper, or convict
Scope Limitations and Omissions
Despite its modernization, the 1850 census had strict jurisdictional limits and omissions. Under the constitutional framework of the era, Native Americans living outside of taxation and state jurisdiction—often referred to as "Indians not taxed"—were excluded from the official population totals.
Furthermore, the census utilized separate schedules to capture different segments of society:
- Schedule 1: Free Inhabitants.
- Schedule 2: Slave Inhabitants (listing slave owners by name, but recording enslaved individuals only by age, sex, and color, typically without names).
- Schedule 3: Mortality (listing individuals who died in the twelve months preceding June 1, 1850).
- Schedule 4: Productions of Agriculture.
- Schedule 5: Products of Industry.
- Schedule 6: Social Statistics.
These records provide a multi-dimensional view of the 1850 population, tying demographic counts directly to agricultural output, industrial manufacturing, and mortality rates.
National Totals and Geographic Distribution
The 1850 population of 23,191,876 represented a massive increase from the 17,069,453 recorded in 1840, reflecting a decadal growth rate of approximately 35.9 percent. This rapid expansion was fueled by high birth rates, territorial annexation following the Mexican-American War, and a surge in transatlantic immigration.
Regional Population Shifts
The geographic distribution of the 1850 population highlighted an enduring tension between the Northern states, which were industrializing rapidly, and the Southern states, whose economy relied heavily on plantation agriculture and enslaved labor.
| Region / State Category | Approximate Population (1850) | Percentage of Total Population | Primary Economic Drivers |
|---|---|---|---|
| Northern States (Free States) | ~13.4 million | ~58% | Manufacturing, commerce, small-scale farming, shipping |
| Southern States (Slave States) | ~9.6 million | ~42% | Plantation agriculture (cotton, tobacco, sugar) |
| Enslaved Population (Subtotal) | 3,204,313 | ~13.8% (of national total) | Agricultural labor force in the South |
| Western Territories / Frontier | ~100,000+ | < 1% | Mining, fur trapping, subsistence farming, military outposts |
Urbanization and Westward Expansion
In 1850, the United States remained a predominantly rural nation, with the vast majority of residents living on farms or in small agrarian communities. However, the seeds of urbanization were sprouting. Cities like New York, Philadelphia, Baltimore, and Boston experienced explosive population growth driven by maritime trade and early industrial manufacturing. New York City alone housed over 500,000 residents, establishing its place as the nation's premier metropolis.
Concurrently, the American frontier pushed aggressively westward. The inclusion of California, which was admitted as a state in September 1850 following the explosive California Gold Rush, added thousands of fortune seekers to the national ledger almost overnight. Territories such as Utah, New Mexico, Oregon, and Minnesota also began appearing on federal maps, establishing fragile footholds across the continent.
Demographic Breakdown: Race, Legal Status, and Gender
The 1850 population was legally, socially, and racially stratified. The census figures document a society divided sharply by legal status—free versus enslaved—as well as by racial classifications dictated by contemporary law.
The Enslaved Population
Of the 23,191,876 total residents, 3,204,313 individuals—approximately 13.8 percent of the population—were enslaved. Enslaved individuals were heavily concentrated in the Southern states, where they formed the backbone of the agrarian economy. In states like South Carolina and Mississippi, enslaved people actually constituted a majority or near-majority of the total state population.
The enumeration of enslaved people under Schedule 2 omitted personal names, reflecting their legal status as property under the laws of the slaveholding states. Despite this dehumanizing administrative practice, demographic data indicates that the enslaved population was young, with a high proportion of children and adolescents, and experienced high birth rates despite horrific living and working conditions.
The Free Black Population
The 1850 census recorded 434,495 free people of color living across the United States. This group occupied a precarious and difficult social space. While approximately half lived in the Southern states—often working as skilled artisans, farm laborers, or domestic workers under severe legal restrictions—the other half lived in Northern states.
Even in the North, free Black Americans faced pervasive disenfranchisement, segregation, and economic discrimination. The passage of the Fugitive Slave Act of 1850 further imperiled free Black residents nationwide, as the law created powerful financial incentives for slave catchers to kidnap legally free individuals and transport them into bondage in the South.
Immigration and the Foreign-Born Population
The late 1840s and 1850 marked the beginning of the first great wave of mass immigration to the United States. Devastated by the Great Famine (An Gorta Mór), hundreds of thousands of Irish citizens fled starvation and British misrule, arriving on American shores in a desperate search for survival. Simultaneously, political upheaval, crop failures, and economic stagnation across German states prompted massive German emigration.
Consequently, the 1850 population included over 2.2 million foreign-born residents, representing nearly 10 percent of the total population. Irish and German immigrants constituted the vast majority of this foreign-born cohort.
- Irish immigrants tended to settle in Northeastern port cities, taking grueling labor jobs building canals, laying railroad tracks, and working in early textile mills.
- German immigrants frequently possessed agricultural skills or modest capital, allowing many to move inland toward the Midwest (forming strong communities in cities like Cincinnati, St. Louis, and Milwaukee) or establish productive family farms.
Economic Structure and Occupational Demographics
Schedule 5 and Schedule 1 of the 1850 census provide a fascinating look into the daily work of the American populace. For the first time, the federal government systematically tracked the primary occupations of free adult males.
The Dominance of Agriculture
Agriculture remained the dominant occupation by an overwhelming margin. Well over half of the American workforce was directly engaged in farming. Subsistence farming still existed in remote regions, but commercial agriculture was expanding rapidly, fueled by the cotton gin in the South and mechanized reapers and steel plows in the Midwest.
The Rise of Early Industrialization
While agriculture dominated, manufacturing and industrial production were gaining momentum. The 1850 census documented the early stages of the Industrial Revolution, characterized by:
- Textile mills concentrated in New England (particularly Massachusetts and Rhode Island).
- Iron foundries and manufacturing plants in Pennsylvania and New York.
- The rapid expansion of the railroad network, which required immense inputs of coal, timber, and iron, while simultaneously creating thousands of jobs for laborers and mechanics.
Master craftsmen, blacksmiths, carpenters, and shoemakers still formed the bedrock of local town economies, but large-scale factory production was beginning to displace traditional artisan workshops, changing the nature of labor and setting the stage for the rise of an urban industrial working class.
Social Conditions, Health, and Mortality in 1850
Life expectancy in 1850 was low by modern standards, largely due to high infant mortality rates, frequent epidemics of infectious diseases, and primitive medical knowledge.
The Mortality Schedule Insights
The 1850 Mortality Schedule recorded deaths that occurred in the twelve months leading up to June 1, 1850. It revealed that infectious diseases were the primary arbiters of life and death. Illnesses such as:
- Cholera (exacerbated by poor urban sanitation and contaminated water supplies)
- Tuberculosis (often referred to as consumption)
- Yellow fever (particularly devastating in Southern port cities like New Orleans)
- Scarlet fever, measles, and dysentery (which disproportionately struck young children)
As a result, a massive percentage of deaths recorded in 1850 occurred among children under the age of five. Medical treatments of the era often relied on bloodletting, purging, and unregulated herbal or chemical remedies, as germ theory had not yet been discovered or accepted by the medical establishment.
Literacy and Education
Educational attainment varied dramatically across regions. The 1850 census asked respondents whether they could read and write.
- In the Northern states, the Common School Movement championed by reformers like Horace Mann had established a robust foundation for public primary education, resulting in high literacy rates among the native-born white population.
- In the Southern states, formal public school systems were much less developed. Planters often relied on private tutors for their children, while the vast majority of poor white children had limited access to formal schooling.
- Enslaved individuals were systematically denied access to education. Nearly every Southern state passed strict anti-literacy laws making it a criminal offense to teach an enslaved person—and in many cases, free Black individuals—to read or write.
Comparative Analysis of U.S. Census Data (1790–1850)
To contextualize the 1850 population, it is helpful to review the trajectory of American demographic growth from the first federal census in 1790 through the mid-nineteenth century.
| Census Year | Total Population | Enslaved Population | Free Black Population | Key Historical Context |
|---|---|---|---|---|
| 1790 | 3,929,214 | 697,681 | 59,557 | Post-Revolutionary era; ratification of the Constitution. |
| 1820 | 9,638,453 | 1,538,022 | 233,398 | Era of Good Feelings; Missouri Compromise. |
| 1830 | 12,866,020 | 2,009,043 | 319,599 | Rise of Jacksonian democracy; Indian Removal Act. |
| 1840 | 17,069,453 | 2,487,355 | 386,293 | Economic depression (Panic of 1837); early railroad boom. |
| 1850 | 23,191,876 | 3,204,313 | 434,495 | Compromise of 1850; mass Irish and German immigration. |
This table demonstrates the relentless, compounding growth of the United States. In just sixty years, the population multiplied nearly sixfold, transforming a fragile coastal republic into a transcontinental nation.
Frequently Asked Questions
What was the total U.S. population in 1850?
The total U.S. population in 1850 was 23,191,876, according to the official Seventh Decennial Census. This figure included 3,204,313 enslaved individuals and 434,495 free people of color.
Why is the 1850 census important for historians and genealogists?
The 1850 census is the first federal census that listed the name of every free individual, rather than just the head of the household. This innovation provides specific ages, birthplaces, occupations, and family relationships, making it an essential baseline for genealogical and historical research.
How many enslaved people lived in the United States in 1850?
There were 3,204,313 enslaved individuals in the United States in 1850, making up approximately 13.8 percent of the total national population. They were concentrated primarily in the Southern states working in agriculture.
Which immigrant groups dominated the 1850 population?
Irish and German immigrants made up the vast majority of the foreign-born population in 1850. The Irish migration was heavily driven by the Great Famine, while German immigrants arrived due to economic pressures and failed European revolutions in 1848.
Were Native Americans included in the 1850 population count?
No. Native Americans living on tribal lands or outside of state tax jurisdiction were excluded from the official 1850 census totals under the constitutional framework of the period.
What was the most populous city in the United States in 1850?
New York City was the most populous city in the United States in 1850, housing over 500,000 residents within its municipal boundaries and serving as the nation's primary commercial and immigration hub.
Conclusion and Next Actions
Examining the 1850 population reveals a society poised at a dangerous and dynamic crossroads. The demographic pressures of rapid territorial expansion, deepening sectional divides over slavery, and an influx of diverse European immigrants created an explosive political environment that culminated in the American Civil War just a decade later.
For researchers, historians, and genealogists investigating this era, the next logical steps involve exploring original archival documents. Researchers should consult the digitized schedules of the 1850 Federal Census available through the National Archives or genealogical repositories like Ancestry and FamilySearch. Cross-referencing Schedule 1 (Free Inhabitants) with Schedule 2 (Slave Inhabitants) and Schedule 5 (Products of Industry) provides a complete, nuanced understanding of how individual families lived, worked, and survived in mid-nineteenth-century America.