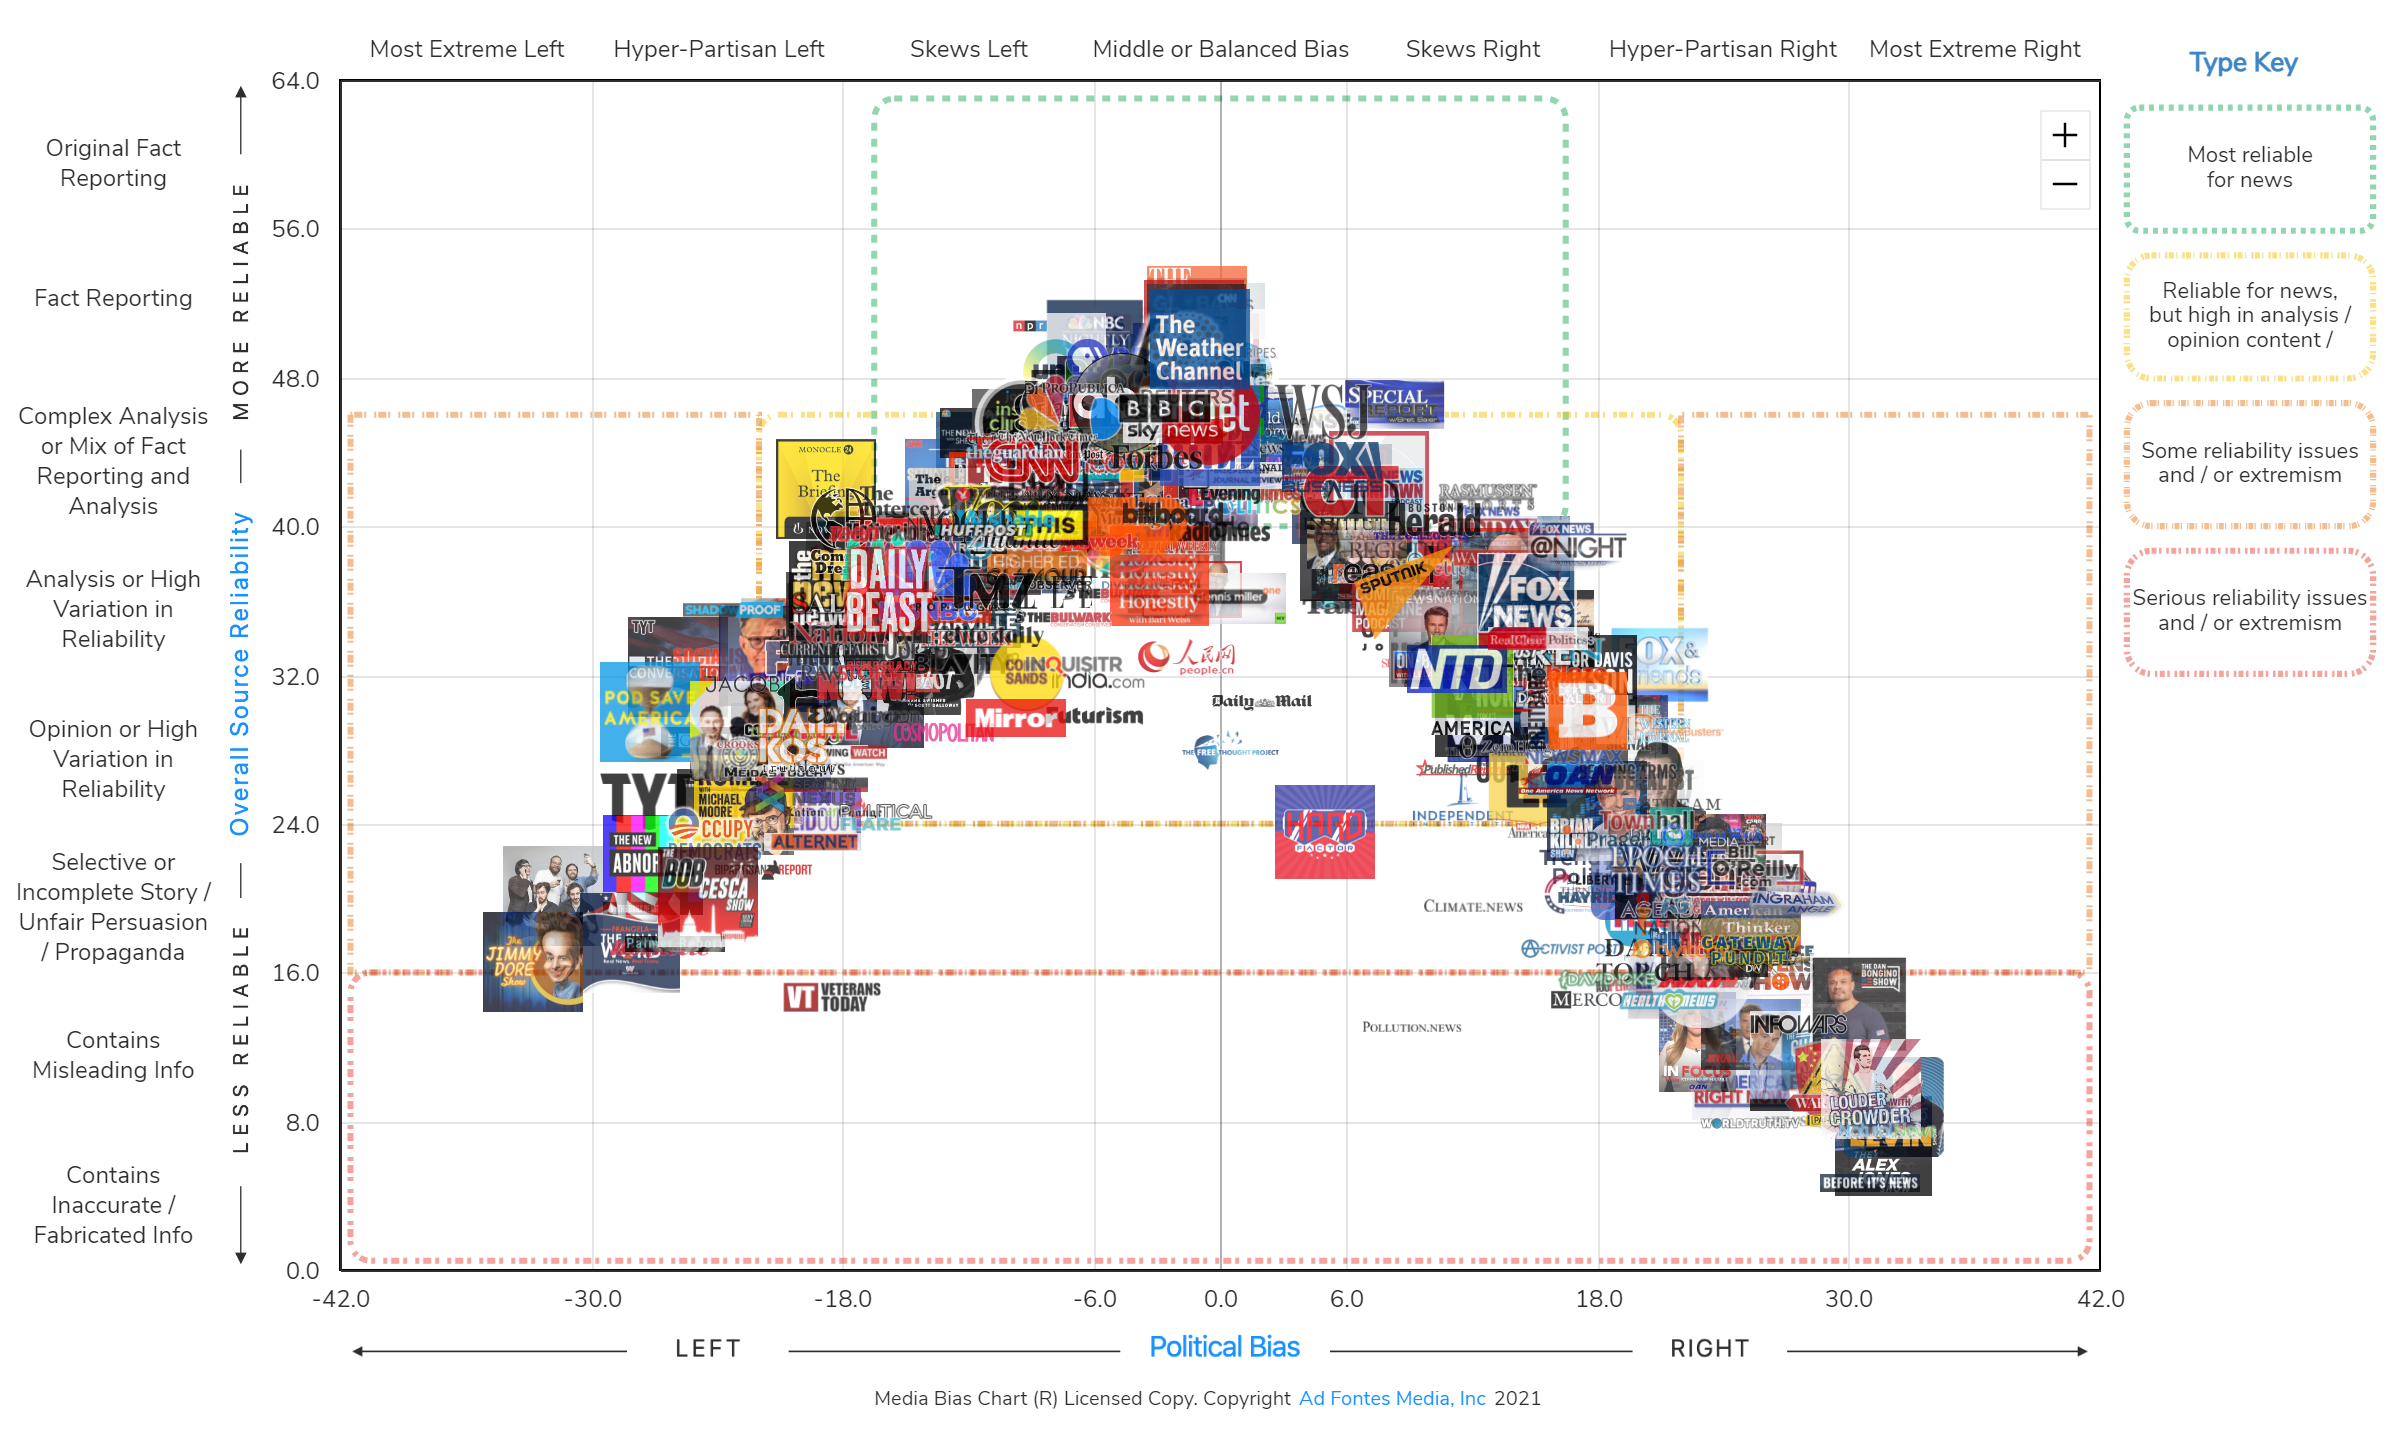
The Ad Fontes Media Chart, specifically the Interactive Media Bias Chart, is a data-driven tool designed to categorize news outlets based on two primary dimensions: factual reliability and political bias. By mapping sources on a Cartesian coordinate system, it allows users to distinguish between high-quality investigative journalism, opinion-based commentary, and low-reliability propaganda.
What is the Ad Fontes Media Chart?
The Ad Fontes Media Chart is the flagship product of Ad Fontes Media, an organization founded by patent attorney Vanessa Otero. The name "Ad Fontes" is Latin for "to the sources," reflecting the organization's mission to bring transparency to the news media landscape. In an era where information overload and "fake news" allegations are rampant, this chart serves as a visual compass for media literacy.
The chart organizes hundreds of news sources—ranging from legacy newspapers like The New York Times to digital-only outlets and podcasts—along a vertical axis (Reliability) and a horizontal axis (Bias). As of 2026, the chart has evolved from a single static image into a complex, interactive database that tracks the shifting editorial standards of the global media ecosystem.
The primary goal of the chart is not to tell people what to think, but to show them the nature of the content they are consuming. By providing a standardized rubric for evaluation, Ad Fontes Media helps educators, researchers, and casual readers identify "middle-of-the-road" reporting that prioritizes facts over partisan framing.
The Two-Axis Methodology: How the Chart Works
To understand the Ad Fontes Media Chart, one must understand the two metrics that define an outlet's position. Unlike many simple "left vs. right" labels, Ad Fontes recognizes that a source can be highly biased yet still factually accurate, or centrist yet poorly researched.
The Vertical Axis: Reliability
The vertical axis measures the quality of the information provided. It ranges from 0 to 64. Sources at the top of the chart are characterized by original fact-reporting and rigorous editorial standards, while those at the bottom frequently disseminate misinformation or deceptive propaganda.
- Scores 40–64 (High Reliability): These sources focus on original investigative reporting and fact-based news. They have transparent correction policies and high evidentiary standards.
- Scores 24–40 (Mixed Reliability): This middle tier often contains "Analysis" or "Opinion" content. While these sources generally stick to facts, they use them to support a specific viewpoint or narrative.
- Scores 0–24 (Low Reliability): Sources in this range are often characterized by selective storytelling, misleading headlines, or outright fabrications. This category includes state-sponsored propaganda and "junk science" sites.
The Horizontal Axis: Bias
The horizontal axis measures political leaning, ranging from -42 (Extreme Left) to +42 (Extreme Right). A score of 0 represents a "Middle or Balanced" position.
- Negative Scores (-42 to -6): Indicates a leaning toward progressive, liberal, or Democratic Party perspectives.
- Near Zero (-6 to +6): Indicates a neutral, centrist, or balanced approach where multiple viewpoints are presented without a clear ideological preference.
- Positive Scores (+6 to +42): Indicates a leaning toward conservative, libertarian, or Republican Party perspectives.
The Rating Process: Human-in-the-Loop Analysis
One of the most frequent questions regarding the Ad Fontes Media Chart is how the scores are actually determined. In 2026, while many companies rely solely on automated AI to detect bias, Ad Fontes Media maintains a "human-in-the-loop" (HITL) methodology to ensure nuance and context.
The Analyst Panels
Ad Fontes employs a diverse team of analysts from across the political spectrum. Each piece of content—whether it is an article, a video clip, or a podcast episode—is typically rated by a "pod" of three analysts: one who leans left, one who leans right, and one who is a centrist.
These analysts use a detailed rubric to score content based on several factors:
- Expression: Is the language inflammatory or neutral?
- Veracity: Are the claims supported by evidence?
- Context: Does the report omit crucial information to skew the reader's perception?
- Prominence: How central is the bias to the overall message?
Weighted Averaging
The scores from these analysts are averaged to create a composite score for the specific article. When thousands of articles from a single outlet are rated over time, they form a "cloud" of data points. The position of a logo on the Media Bias Chart represents the weighted average (the centroid) of all those individual data points. This prevents a single outlier article from unfairly tarnishing or boosting a news outlet's overall reputation.
The 2026 Media Landscape: Beyond Traditional Articles
By 2026, the Ad Fontes Media Chart has significantly expanded its scope to include non-traditional media formats. The rise of independent creators on platforms like YouTube, TikTok, and decentralized social media has necessitated new ways of measuring influence and accuracy.
Video and Podcast Integration
Recognizing that many people now receive their news through audio-visual formats, Ad Fontes has developed specialized rubrics for podcasts and cable news broadcasts. This involves analyzing not just the transcript of the speech, but also tone, visual cues, and the use of graphics. For example, a host's sarcastic tone can shift a "fact-based" segment into the "opinion" category, even if the underlying data mentioned is correct.
AI and Synthetic Media Monitoring
In 2026, the proliferation of AI-generated news sites has become a major challenge. Ad Fontes now utilizes proprietary AI tools to screen vast quantities of digital content for "low-effort" or synthetic patterns. However, the final "Reliability" and "Bias" scores for major influencers and outlets still require human verification to account for sarcasm, cultural context, and complex political nuances that AI often misses.
Comparing Ad Fontes to Other Media Watchdogs
While Ad Fontes is a leader in the field, it is not the only organization tracking media bias. Users often compare it to AllSides and Media Bias/Fact Check (MBFC). Each uses a slightly different approach.
| Feature | Ad Fontes Media | AllSides | Media Bias/Fact Check |
|---|---|---|---|
| Primary Visual | Two-axis Cartesian Chart | Simple linear scale (Left/Center/Right) | Categorical labels and "Truth-o-meter" |
| Methodology | Multi-partisan human analyst pods | Crowdsourced "blind" tests and editorial review | Editorial review by a small team |
| Granularity | High (Numeric scores for bias/reliability) | Moderate (Five categories) | High (Detailed reports for each site) |
| Focus | Content-level analysis (individual articles) | Source-level perception | Source-level history and funding |
| Interactive Tools | Searchable database and map | Side-by-side news comparisons | Searchable index of thousands of sites |
How to Use the Interactive Media Bias Chart Effectively
The Interactive Media Bias Chart is the most powerful version of the tool, allowing users to filter news sources by name, topic, or date. Here is how to utilize it for maximum benefit:
- Search Your Favorites: Enter the news outlets you consume most frequently. Look at where they land on the vertical axis. If they are below the 40-point mark, you are consuming more "Analysis/Opinion" than "Fact Reporting."
- Look for the "Green Box": In the Ad Fontes visualization, there is often a highlighted area at the top-center. Sources within this "Green Box" are generally considered the most reliable for unbiased, fact-driven news.
- Analyze the Spread: Some outlets have a "tight" cluster of articles, meaning their quality is consistent. Others have a wide "spread," meaning they may feature both high-quality reporting and highly biased opinion pieces under the same brand.
- Diversify Your Feed: If you notice your news diet is skewed heavily to one side of the horizontal axis, use the chart to find a source with a similar reliability score on the opposite side. Reading how different outlets cover the same event is a core tenet of media literacy.
Common Criticisms and Limitations
No tool is perfect, and the Ad Fontes Media Chart has faced its share of scrutiny. Critics often argue that "bias" is inherently subjective and that the "center" is a moving target.
The "Centrist Bias" Argument
Some media critics argue that by placing "neutral" sources at the top, the chart implicitly suggests that the "truth" always lies in the middle. They argue that if one side of a political debate is factually incorrect, a "reliable" news source should call that out, which might make them appear biased to the other side. Ad Fontes counters this by separating "Reliability" from "Bias"—a source can be highly biased and highly reliable if they accurately report facts that support a specific ideology.
Sample Size Concerns
With thousands of news outlets globally, Ad Fontes cannot rate every single article published. Smaller, local news outlets or niche blogs may have lower sample sizes, leading to less precise placements. Users should always check the "n" (number of articles rated) for a specific outlet within the interactive database to gauge the robustness of the score.
Institutional and Educational Applications
By 2026, the Ad Fontes Media Chart has become a staple in educational settings. High schools and universities use it as a foundational tool for teaching "information fluency."
- Classroom Integration: Teachers use the chart to show students how to identify "clickbait" and how to verify claims by moving up the reliability axis to more primary sources.
- Corporate Training: Businesses use the data to monitor the media environment in which their brand is mentioned, helping them understand the leanings of journalists who cover their industry.
- Library Resources: Many public and academic libraries provide access to the Pro version of the Interactive Media Bias Chart to help patrons evaluate sources for research papers and civic participation.
Frequently Asked Questions
Is the Ad Fontes Media Chart politically biased?
Ad Fontes Media goes to great lengths to minimize institutional bias by using balanced teams of analysts (left, center, and right) to rate every piece of content. The chart itself is a reflection of the data collected from these multi-partisan panels. While no system is perfectly objective, the use of diverse viewpoints in the rating process is designed to cancel out individual analyst bias.
How often is the chart updated?
The static version of the chart is typically updated monthly or quarterly. However, the Interactive Media Bias Chart is updated daily as new articles and episodes are analyzed by the rating teams. In 2026, real-time updates are common for major breaking news events where media coverage shifts rapidly.
Who funds Ad Fontes Media?
Ad Fontes Media is a public benefit corporation. Its revenue comes from a variety of sources, including individual subscriptions to its interactive tools, licensing fees for educational and commercial use, and transparency reports for advertisers. They do not accept funding from political parties or government entities, which helps maintain their independence.
Can I suggest a news source for rating?
Yes, the Ad Fontes platform allows users to submit requests for specific outlets or podcasts to be added to the queue for analysis. Popularity and current relevance usually dictate which sources are prioritized for new ratings.
Why is my favorite news source rated lower than I expected?
A lower reliability rating often occurs because an outlet prioritizes "Analysis" or "Opinion" over "Hard News." An outlet can be reputable and popular but still land in the middle of the chart if its primary output is commentary on news rather than original investigative reporting.
Summary and Next Steps
The Ad Fontes Media Chart is an essential utility for anyone navigating the complex information environment of 2026. By separating the quality of information from the lean of information, it provides a nuanced view of the media that simple labels cannot capture.
To improve your media literacy, consider the following actions:
- Visit the Ad Fontes Media website to explore the latest version of the Interactive Media Bias Chart.
- Audit your own news consumption by looking up the top five sources you read or watch.
- Practice lateral reading: When you see a controversial story on a low-reliability/high-bias site, use the chart to find a high-reliability source to verify the underlying facts.
By consciously choosing to consume media from the top of the chart, you contribute to a more informed and less polarized society.