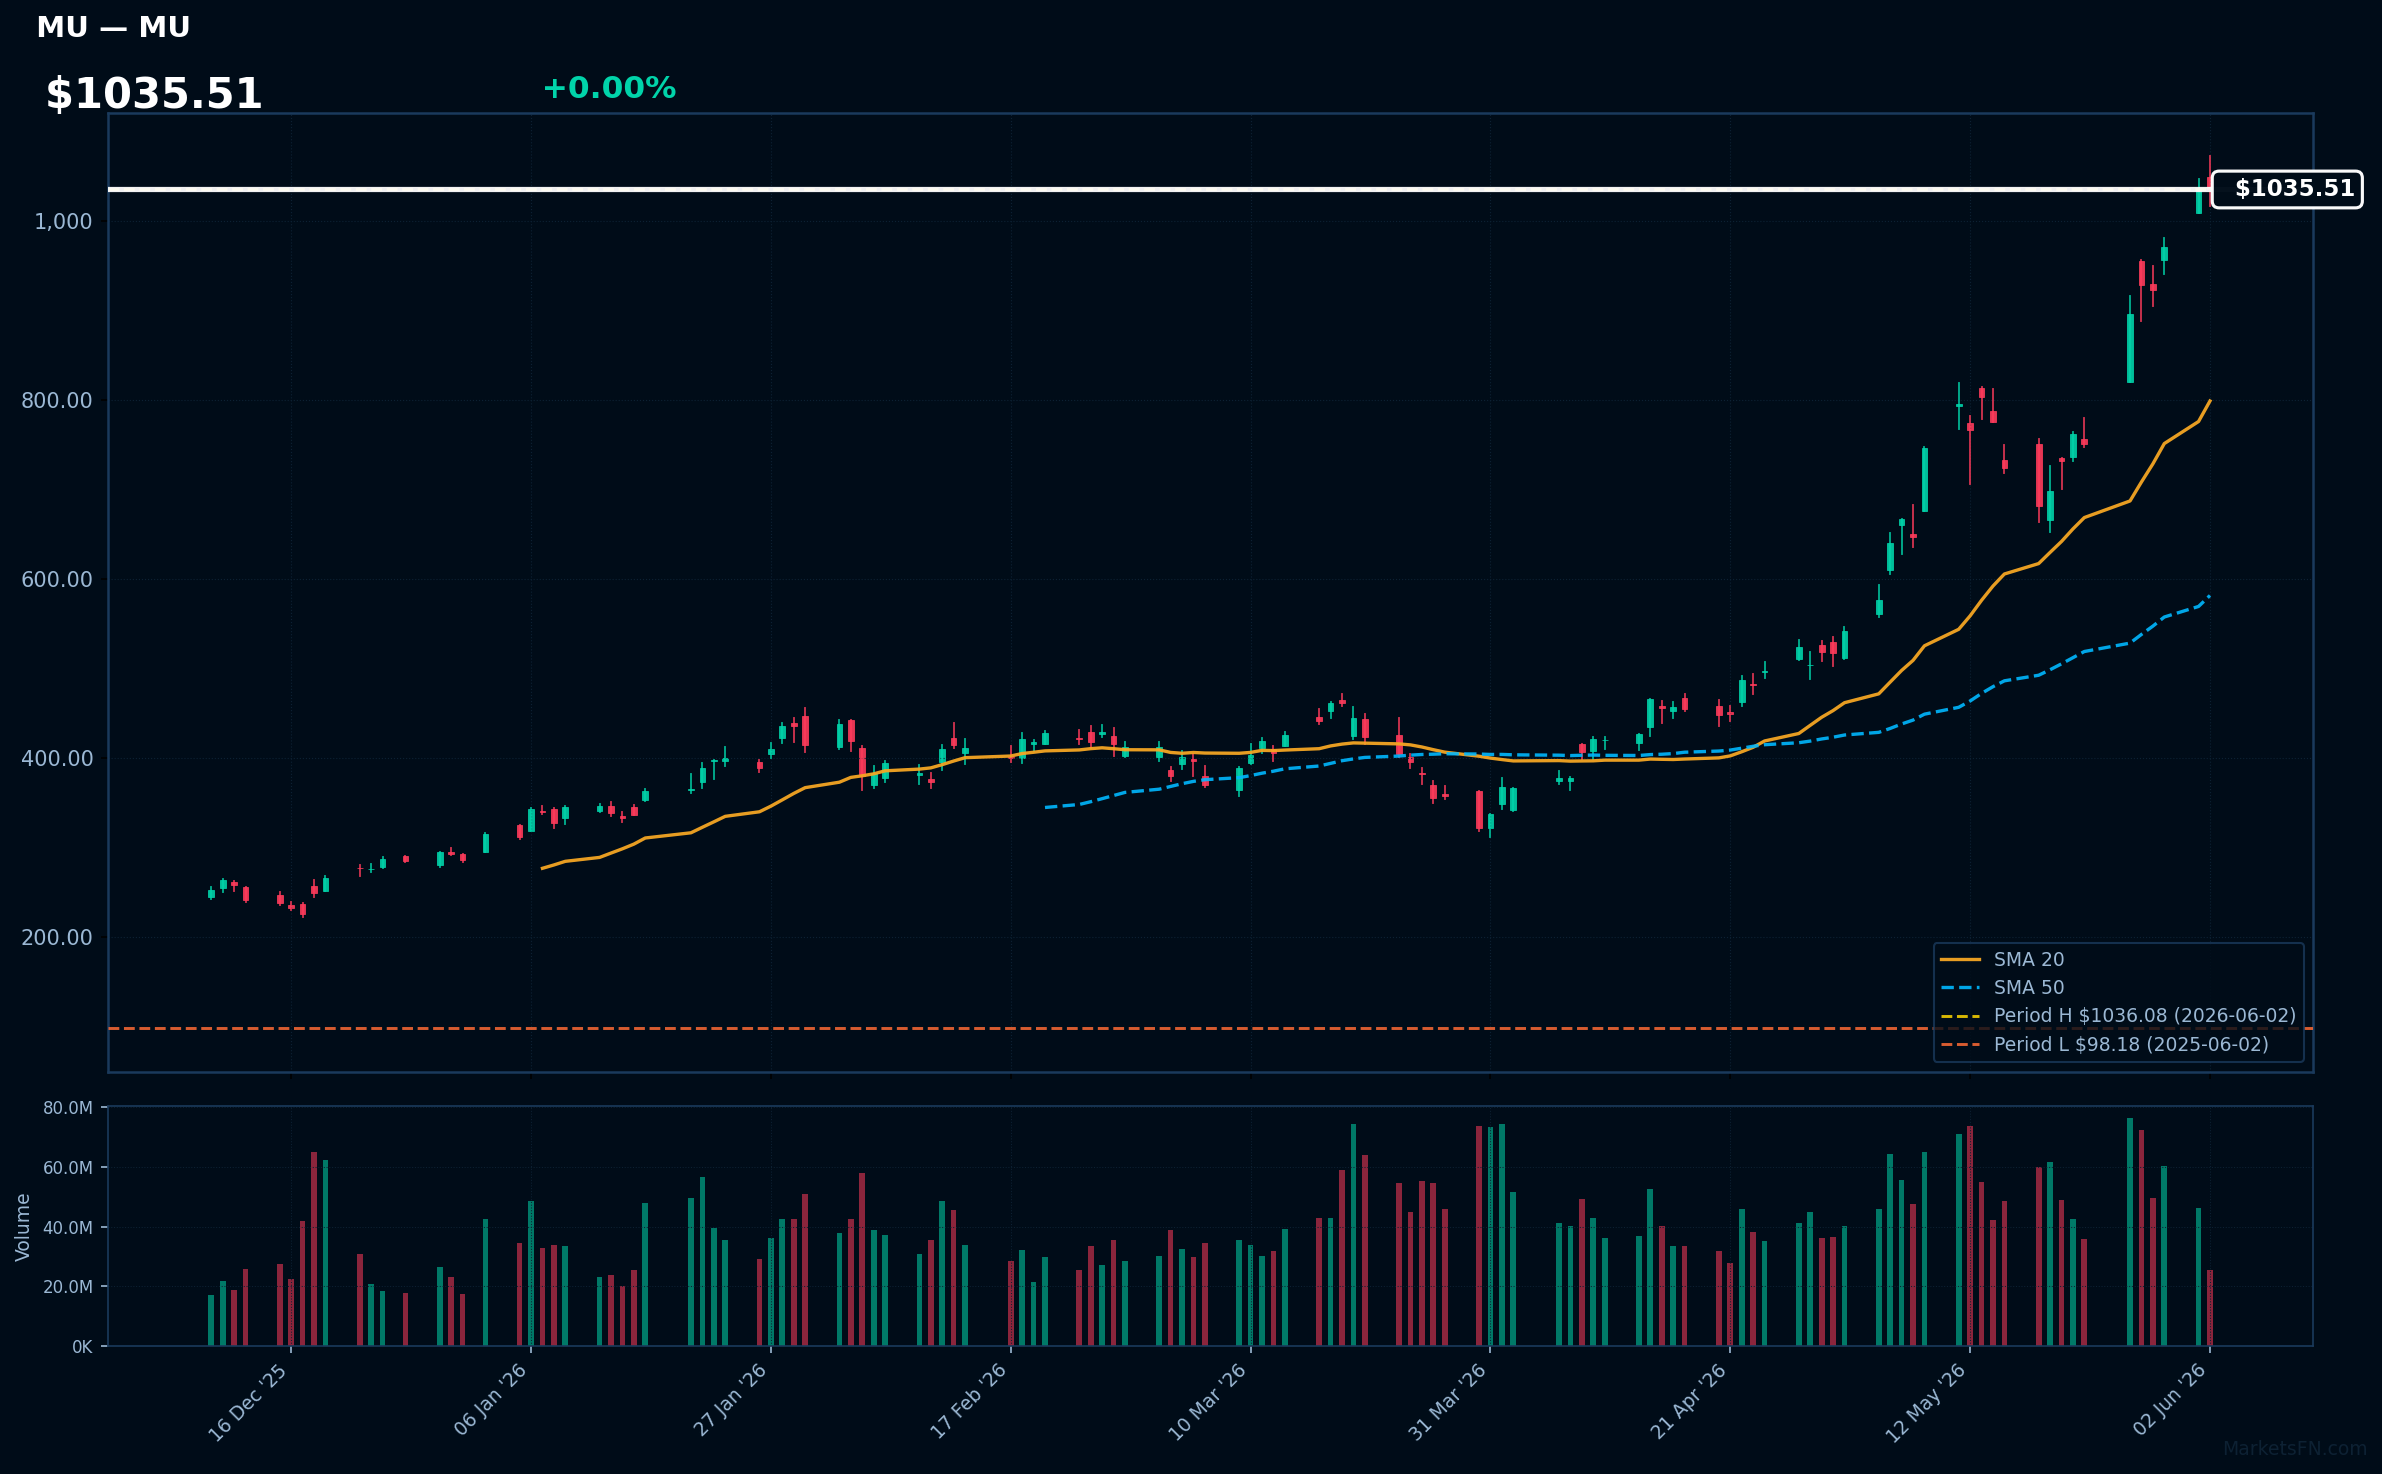
The 52-week high and low represents the highest and lowest price at which a security, such as a stock or exchange-traded fund (ETF), has traded during the preceding 52-week period. This metric serves as a critical technical indicator for investors to assess a stock’s current value relative to its historical performance over a rolling one-year window.
What is the 52-Week High and Low?
The 52-week high and low is a data point found in virtually every financial quote or brokerage platform. It provides a snapshot of a security's price volatility and range over the last year. While it might seem like a simple statistic, it is a "rolling" window, meaning the range is updated daily. As a new trading day begins, the oldest day from the previous 52-week period is dropped, and the current day’s price action is added.
For example, if we are looking at a stock on January 1, 2026, the 52-week range covers the period from early January 2025 to the present. The high is the absolute peak reached during those 12 months, and the low is the absolute floor. Most financial data providers use the intraday high and low rather than the daily closing prices to determine these values. This distinction is important because a stock might spike to a new high during a volatile morning session but finish the day lower; the intraday peak still counts as the 52-week high.
This metric is essential because it offers a sense of perspective. A stock trading at $50 might seem expensive or cheap in isolation, but knowing that its 52-week range is $45 to $150 provides immediate context that the stock is currently trading near its annual lows, potentially indicating a significant downtrend or a value opportunity.
The Psychology of the 52-Week Range
The 52-week high and low are heavily influenced by anchoring bias, a psychological phenomenon where investors fixate on specific price points. These "round numbers" or historical peaks and valleys become mental barriers.
When a stock approaches its 52-week high, many investors who bought at lower prices may choose to sell to lock in profits, creating a natural level of "resistance." Conversely, when a stock hits a 52-week low, it may attract value investors who believe the stock is "on sale," or it may trigger panic selling among those who fear the decline will continue.
Institutional investors and algorithmic trading systems also monitor these levels. Large-scale buy or sell orders are often triggered when a stock breaks through these historical barriers. In 2026, as high-frequency trading (HFT) continues to dominate market volume, these technical levels act as catalysts for rapid price movements, often referred to as "breakouts" or "breakdowns."
Why Investors Track 52-Week Ranges
Investors use this metric for several distinct strategic purposes. Understanding these use cases helps in deciding whether a stock is a viable candidate for a portfolio.
Trend Identification
The 52-week range is one of the most effective ways to identify the primary trend of a security. A stock that is consistently trading near its 52-week high is in a clear uptrend, suggesting strong demand and positive underlying fundamentals. A stock languishing near its 52-week low is in a downtrend, signaling that the market is skeptical of its future prospects or that the industry is facing headwinds.
Valuation Context
While the 52-week range is a technical indicator, it is often used alongside fundamental analysis. If a company reports record-breaking earnings in early 2026 but its stock remains near its 52-week low, there is a divergence. This could indicate that the market has already "priced in" the good news or that there are hidden risks that the earnings report did not address.
Support and Resistance Levels
In technical analysis, the 52-week high acts as a major resistance level. If a stock can break above this price with high trading volume, it is often seen as a signal that the stock has more room to run. On the flip side, the 52-week low acts as a support level. If the price drops below this floor, it may signal a "technical breakdown," leading to further declines as stop-loss orders are triggered.
Strategies for Trading the 52-Week High
Many successful investors, including momentum traders, specifically target stocks hitting new 52-week highs. This may seem counterintuitive to the "buy low, sell high" mantra, but academic research into the "52-week high effect" suggests that stocks reaching new highs often continue to outperform the market in the short-to-medium term.
The Breakout Strategy
A breakout occurs when the stock price moves above its 52-week high. This move suggests that all the "overhead supply" (investors waiting to sell at the previous peak) has been absorbed, and new buyers are willing to pay even higher prices. Traders often look for a 2-3% move above the high accompanied by a surge in volume to confirm the validity of the breakout.
Momentum and Relative Strength
Stocks hitting 52-week highs often possess high Relative Strength (RS). In 2026, many growth sectors, particularly in advanced technology and renewable infrastructure, have shown that price momentum can sustain itself for months. By buying stocks at their 52-week highs, investors are "betting on the winner," assuming that the factors driving the price up remain in play.
Risk Management
The primary risk of buying at a 52-week high is the "bull trap." This occurs when a stock briefly breaks to a new high but then sharply reverses. To mitigate this, traders use tight stop-loss orders just below the previous resistance level.
Strategies for Trading the 52-Week Low
Trading near the 52-week low is generally considered more dangerous and is often referred to as "catching a falling knife." However, for value investors, these stocks represent potential bargains.
Contrarian Investing
Contrarian investors look for stocks that have been unfairly punished by the market. If a stock is at a 52-week low due to a temporary setback—such as a broad market correction or a one-time legal settlement—it may be a candidate for a "mean reversion" trade, where the price eventually returns to its historical average.
Tax-Loss Harvesting
Toward the end of the year, many stocks hitting 52-week lows face additional selling pressure due to tax-loss harvesting. Investors sell their losing positions to offset capital gains for tax purposes. This can drive prices down artificially, creating a "January Effect" where these stocks bounce back in the new year as the selling pressure subsides.
Identifying Value Traps
The greatest risk at the 52-week low is the value trap. A stock might be at a 52-week low because its business model is failing, its debt is unsustainable, or a competitor has rendered its products obsolete. In these cases, the 52-week low is not a floor; it is just a stop on the way to zero.
Adjusting for Dividends and Stock Splits
It is vital to understand that 52-week high and low data must be adjusted for corporate actions. Failure to do so would result in highly misleading data.
- Stock Splits: If a stock trading at $200 with a 52-week high of $220 undergoes a 2-for-1 stock split, the price drops to $100. If the data provider does not adjust the history, the 52-week high would still appear as $220, making the stock look like it crashed by over 50%. Adjusted data would move the 52-week high to $110.
- Dividends: Some platforms offer "total return" 52-week ranges, which account for the value of dividends paid out. Most standard charts, however, use "price return," which only tracks the nominal share price.
- Spin-offs: When a company spins off a division into a new public entity, the parent company's stock price usually drops by the value of the new entity. This requires a historical adjustment to maintain the integrity of the 52-week range.
Comparing 52-Week High and Low Metrics
| Metric | Context | Investor Sentiment | Typical Strategy |
|---|---|---|---|
| At/Near 52-Week High | Strong momentum, positive news, industry leader. | Extreme optimism or "Greed." | Breakout trading, momentum chasing. |
| At/Near 52-Week Low | Downtrend, negative news, industry laggard. | Fear, pessimism, or apathy. | Value investing, contrarian buying. |
| Breaking Above High | New price discovery, no overhead resistance. | Bullish confirmation. | Buy on high volume. |
| Breaking Below Low | Technical breakdown, loss of support. | Bearish confirmation. | Sell or short sell. |
| Mid-Range | Consolidation or lack of clear direction. | Indecision or stability. | Wait for trend confirmation. |
Limitations of the 52-Week Metric
While useful, the 52-week high and low should never be used as a standalone indicator for several reasons:
- Lagging Nature: The 52-week range tells you what has happened, not necessarily what will happen. By the time a stock hits a 52-week high, you may have missed a significant portion of the move.
- Ignores Fundamental Shifts: A stock might be at a 52-week high while its earnings are plummeting, making it more expensive than ever on a Price-to-Earnings (P/E) basis.
- Volatility Distortions: In highly volatile markets, a 52-week range can be extremely wide (e.g., $10 to $100). In such cases, the "high" and "low" are so far apart that they lose their utility as immediate support or resistance levels.
- No Consideration for Time: A stock could have hit its 52-week high 11 months ago and has been declining ever since. The "high" is still the same, but the context of that high is very different from a stock that hit a new high yesterday.
Using the 52-Week High/Low Ratio
The 52-week high/low ratio is a broader market breadth indicator. It measures the number of stocks reaching new 52-week highs versus those reaching new 52-week lows on a specific exchange, such as the New York Stock Exchange (NYSE) or NASDAQ.
- Market Strength: When significantly more stocks are hitting new highs than new lows, the market is in a healthy, broad-based bull run.
- Market Weakness: If the major indices (like the S&P 500) are rising, but the number of stocks hitting new 52-week highs is shrinking, it suggests "thin" market leadership. This divergence is often a warning sign of an impending correction.
Practical Steps for Investors in 2026
As we navigate the market landscape of 2026, where algorithmic precision and rapid information flow are paramount, investors should follow these steps when utilizing 52-week data:
- Verify the Data Source: Ensure your brokerage uses "split-adjusted" prices.
- Check Volume: A new 52-week high on low trading volume is often a "fake-out." Look for institutional participation evidenced by high volume.
- Analyze Sector Performance: Is the stock hitting a new high because the whole sector is up, or is it an outlier? Outliers often have stronger idiosyncratic reasons for their move.
- Set Alerts: Most modern trading platforms allow you to set price alerts for when a stock comes within 1% or 2% of its 52-week high or low. This allows you to react to the technical setup without staring at charts all day.
- Consult Financial Authorities: For official data on security listings and historical performance, refer to the U.S. Securities and Exchange Commission (SEC) or the Financial Industry Regulatory Authority (FINRA).
Frequently Asked Questions
Is it a good idea to buy a stock at its 52-week high?
Buying at a 52-week high can be a successful strategy if the stock is supported by strong earnings growth and high trading volume. This is known as momentum trading. However, it requires strict risk management, as the stock is "extended" and could be prone to a short-term pullback.
Does a 52-week low mean a stock is cheap?
Not necessarily. A stock at its 52-week low is "cheaper" than it was a year ago, but it may still be overvalued if the company's earnings have declined faster than its stock price. Always check the valuation multiples (like P/E or Price-to-Sales) alongside the price range.
How often is the 52-week high and low updated?
It is updated every trading day. The 52-week window is a "rolling" period of the last 252 trading days (which roughly equates to one calendar year).
Why do some sites show different 52-week highs for the same stock?
Differences usually arise from whether the site uses the intraday high or the closing high. Additionally, some sites may update for stock splits and dividends at different times, leading to temporary discrepancies in the data.
What is the "New Highs-New Lows" Index?
This is a market breadth indicator that subtracts the number of stocks at 52-week lows from the number of stocks at 52-week highs. A positive number indicates a bullish market environment, while a negative number indicates a bearish one.
Final Recommendation
The 52-week high and low is a powerful, yet simple, tool for orienting yourself in the market. To use it effectively in 2026, combine it with other technical indicators like the 200-day moving average and fundamental metrics like earnings per share (EPS) growth. Never buy a stock solely because it is "low" or sell it solely because it is "high." Instead, use these levels as a starting point for deeper research into why the market is pricing the security at those extremes.