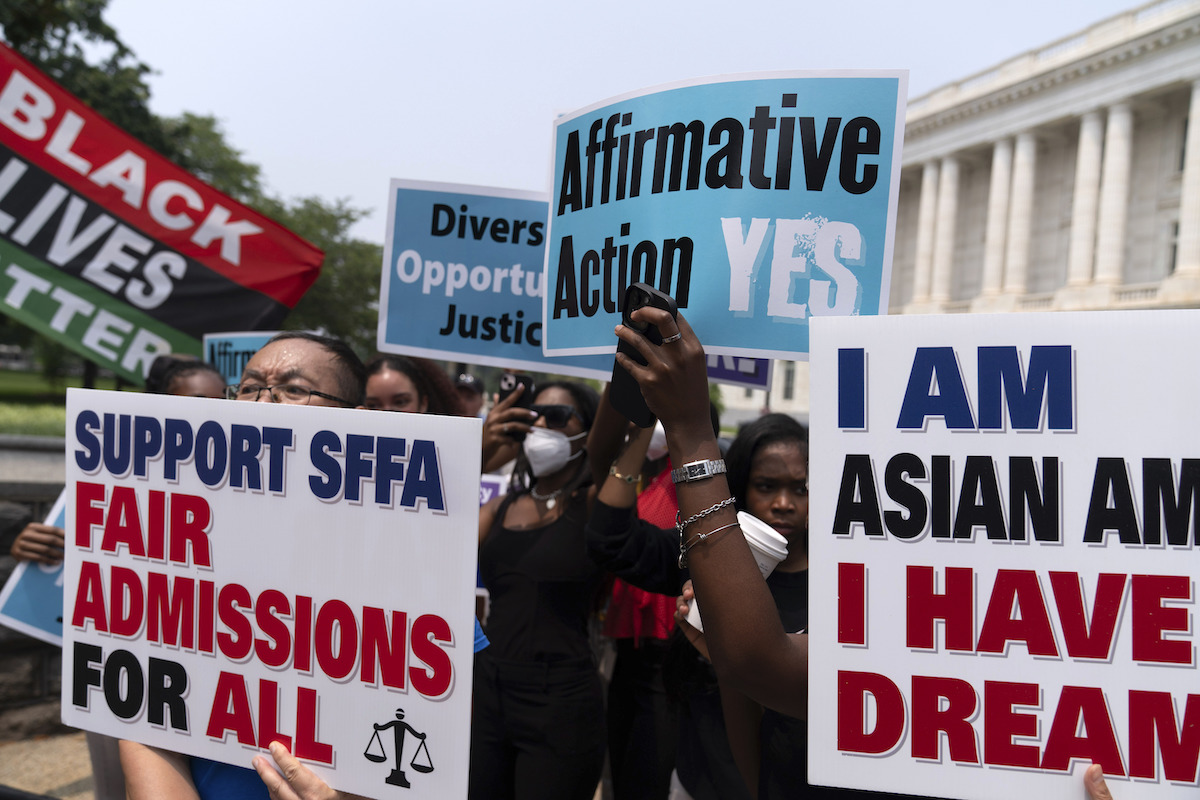
Affirmative action statistics measure how race-conscious policies, outreach programs, and federal regulations influence representation in higher education and the workplace. Following the landmark 2023 Supreme Court decision in Students for Fair Admissions v. Harvard, demographic metrics reveal significant shifts in selective college admissions, state-level policy outcomes, federal contractor compliance, and public sentiment.
The Legal and Demographic Evolution of Affirmative Action
To understand modern affirmative action statistics, it is necessary to examine the dual tracks of policy implementation in the United States: higher education admissions and workplace equal employment opportunity programs.
In higher education, race-conscious admissions were permitted for decades under a series of Supreme Court precedents, including Regents of the University of California v. Bakke (1978), Grutter v. Bollinger (2003), and Fisher v. University of Texas (2016). These rulings established that while quota systems were unconstitutional under the Equal Protection Clause of the Fourteenth Amendment and Title VI of the Civil Rights Act of 1964, universities could consider race as one individualized factor among many to achieve the educational benefits of a diverse student body.
Affirmative Action Dual Legal Tracks
| Higher Education Admissions | Workplace & Federal Contracts |
|---|---|
| • Governed by Title VI & 14th Amend.• Strictly regulated holistic review• Race-conscious admissions effectively ended by SCOTUS in 2023 (SFFA v. Harvard). | • Governed by Title VII & Executive Order 11246• Prohibits quotas and strict racial preferences• Mandates non-discrimination & placement goal outreach. |
In employment, federal affirmative action operates under a distinct regulatory regime. Executive Order 11246, signed by President Lyndon B. Johnson in 1965 and administered by the U.S. Department of Labor’s Office of Federal Contract Compliance Programs (OFCCP), requires non-exempt federal contractors and subcontractors to take affirmative steps to ensure equal opportunity in recruitment, hiring, and promotion. Unlike university admissions, federal employment regulations explicitly prohibit quotas and direct race-based preferences; instead, they require contractors to establish placement goals based on availability analyses when underutilization of women or minorities is identified.
Disclaimer: Policy directives and legal interpretations regarding race-conscious programs evolve rapidly. This article provides statistical and historical data for educational purposes and does not constitute formal legal counsel.
Higher Education Statistics: Demographic Shifts After SFFA v. Harvard
On June 29, 2023, the Supreme Court issued a joint ruling in Students for Fair Admissions, Inc. v. President and Fellows of Harvard College and SFFA v. University of North Carolina, holding that race-conscious university admissions programs violated the Equal Protection Clause. The decision effectively ended the explicit consideration of race as an independent factor in college admissions nationwide.
Data published by selective institutions for post-ruling incoming classes demonstrates immediate, tangible structural changes in student body demographics. While individual institutions experienced varying degrees of change based on their applicant pools and revised admissions strategies, several overarching trends emerged across elite private institutions and public flagship universities.
Case Studies: Demographics Before and After the Ruling
Selective universities that historically utilized race-conscious holistic reviews published detailed demographic breakdowns following the ruling.
- Massachusetts Institute of Technology (MIT): Among the most pronounced demographic shifts occurred at MIT. For the Class of 2027 (the final cohort admitted under race-conscious admissions), Black, Hispanic, Native American, and Pacific Islander students comprised 25% of the undergraduate class, with Black enrollment at 15% and Hispanic enrollment at 16%. In the Class of 2028 (the first admitted post-ruling), combined representation from these historically underrepresented groups dropped to 16%, with Black student enrollment falling to 5% and Hispanic enrollment to 11%. Conversely, Asian American student enrollment increased from 40% to 47%, while White student enrollment remained relatively steady at 37%.
- Harvard University: Harvard’s enrollment statistics reflected subtle yet clear reallocation patterns. Black student enrollment fell from 18% in the Class of 2027 to 14% in the Class of 2028. Asian American enrollment remained unchanged at 37%, while White enrollment experienced a minor increase, and the percentage of students who chose not to disclose their race rose significantly.
- University of North Carolina at Chapel Hill: As the public university defendant in the SFFA ruling, UNC Chapel Hill reported a decline in underrepresented minority enrollment. Black enrollment in the incoming freshman class declined from 10.5% in 2023 to 7.8% post-ruling, while Hispanic enrollment dipped slightly from 10.8% to 10.1%. Asian American representation grew from 16.8% to 19.0%.
- Amherst College: At Amherst College, a private liberal arts institution, Black student enrollment dropped from 11% to 3%, and Hispanic student enrollment dropped from 19% to 14%. Simultaneously, the proportion of low-income students receiving Pell Grants saw shifts as the college implemented expanded financial aid and socioeconomic recruitment strategies to offset racial demographic declines.
Post-SFFA Demographic Trends (Selective Private & Public Institutions)
| Institution | Group | Pre-Ruling (%) | Post-Ruling (%) |
|---|---|---|---|
| MIT | Black Students | 15% | 5% |
| MIT | Hispanic Students | 16% | 11% |
| MIT | Asian American Students | 40% | 47% |
| Harvard | Black Students | 18% | 14% |
| Harvard | Asian American Students | 37% | 37% |
| UNC Chapel Hill | Black Students | 10.5% | 7.8% |
| UNC Chapel Hill | Asian American Students | 16.8% | 19.0% |
| Amherst College | Black Students | 11% | 3% |
State-Level Affirmative Action Ban Data (1996–2023)
The nationwide SCOTUS decision in 2023 was preceded by state-level bans on affirmative action in public higher education across nine states: California (1996), Washington (1998), Florida (1999), Michigan (2006), Nebraska (2008), Arizona (2010), New Hampshire (2012), Oklahoma (2012), and Idaho (2020). Historical data from these jurisdictions provided legal scholars and university administrators with predictive models for the post-2023 national landscape.
Long-Term Outcomes from California’s Proposition 209
California passed Proposition 209 in 1996, prohibiting state governmental institutions—including the University of California (UC) system—from considering race, sex, or ethnicity in public employment, contracting, and education.
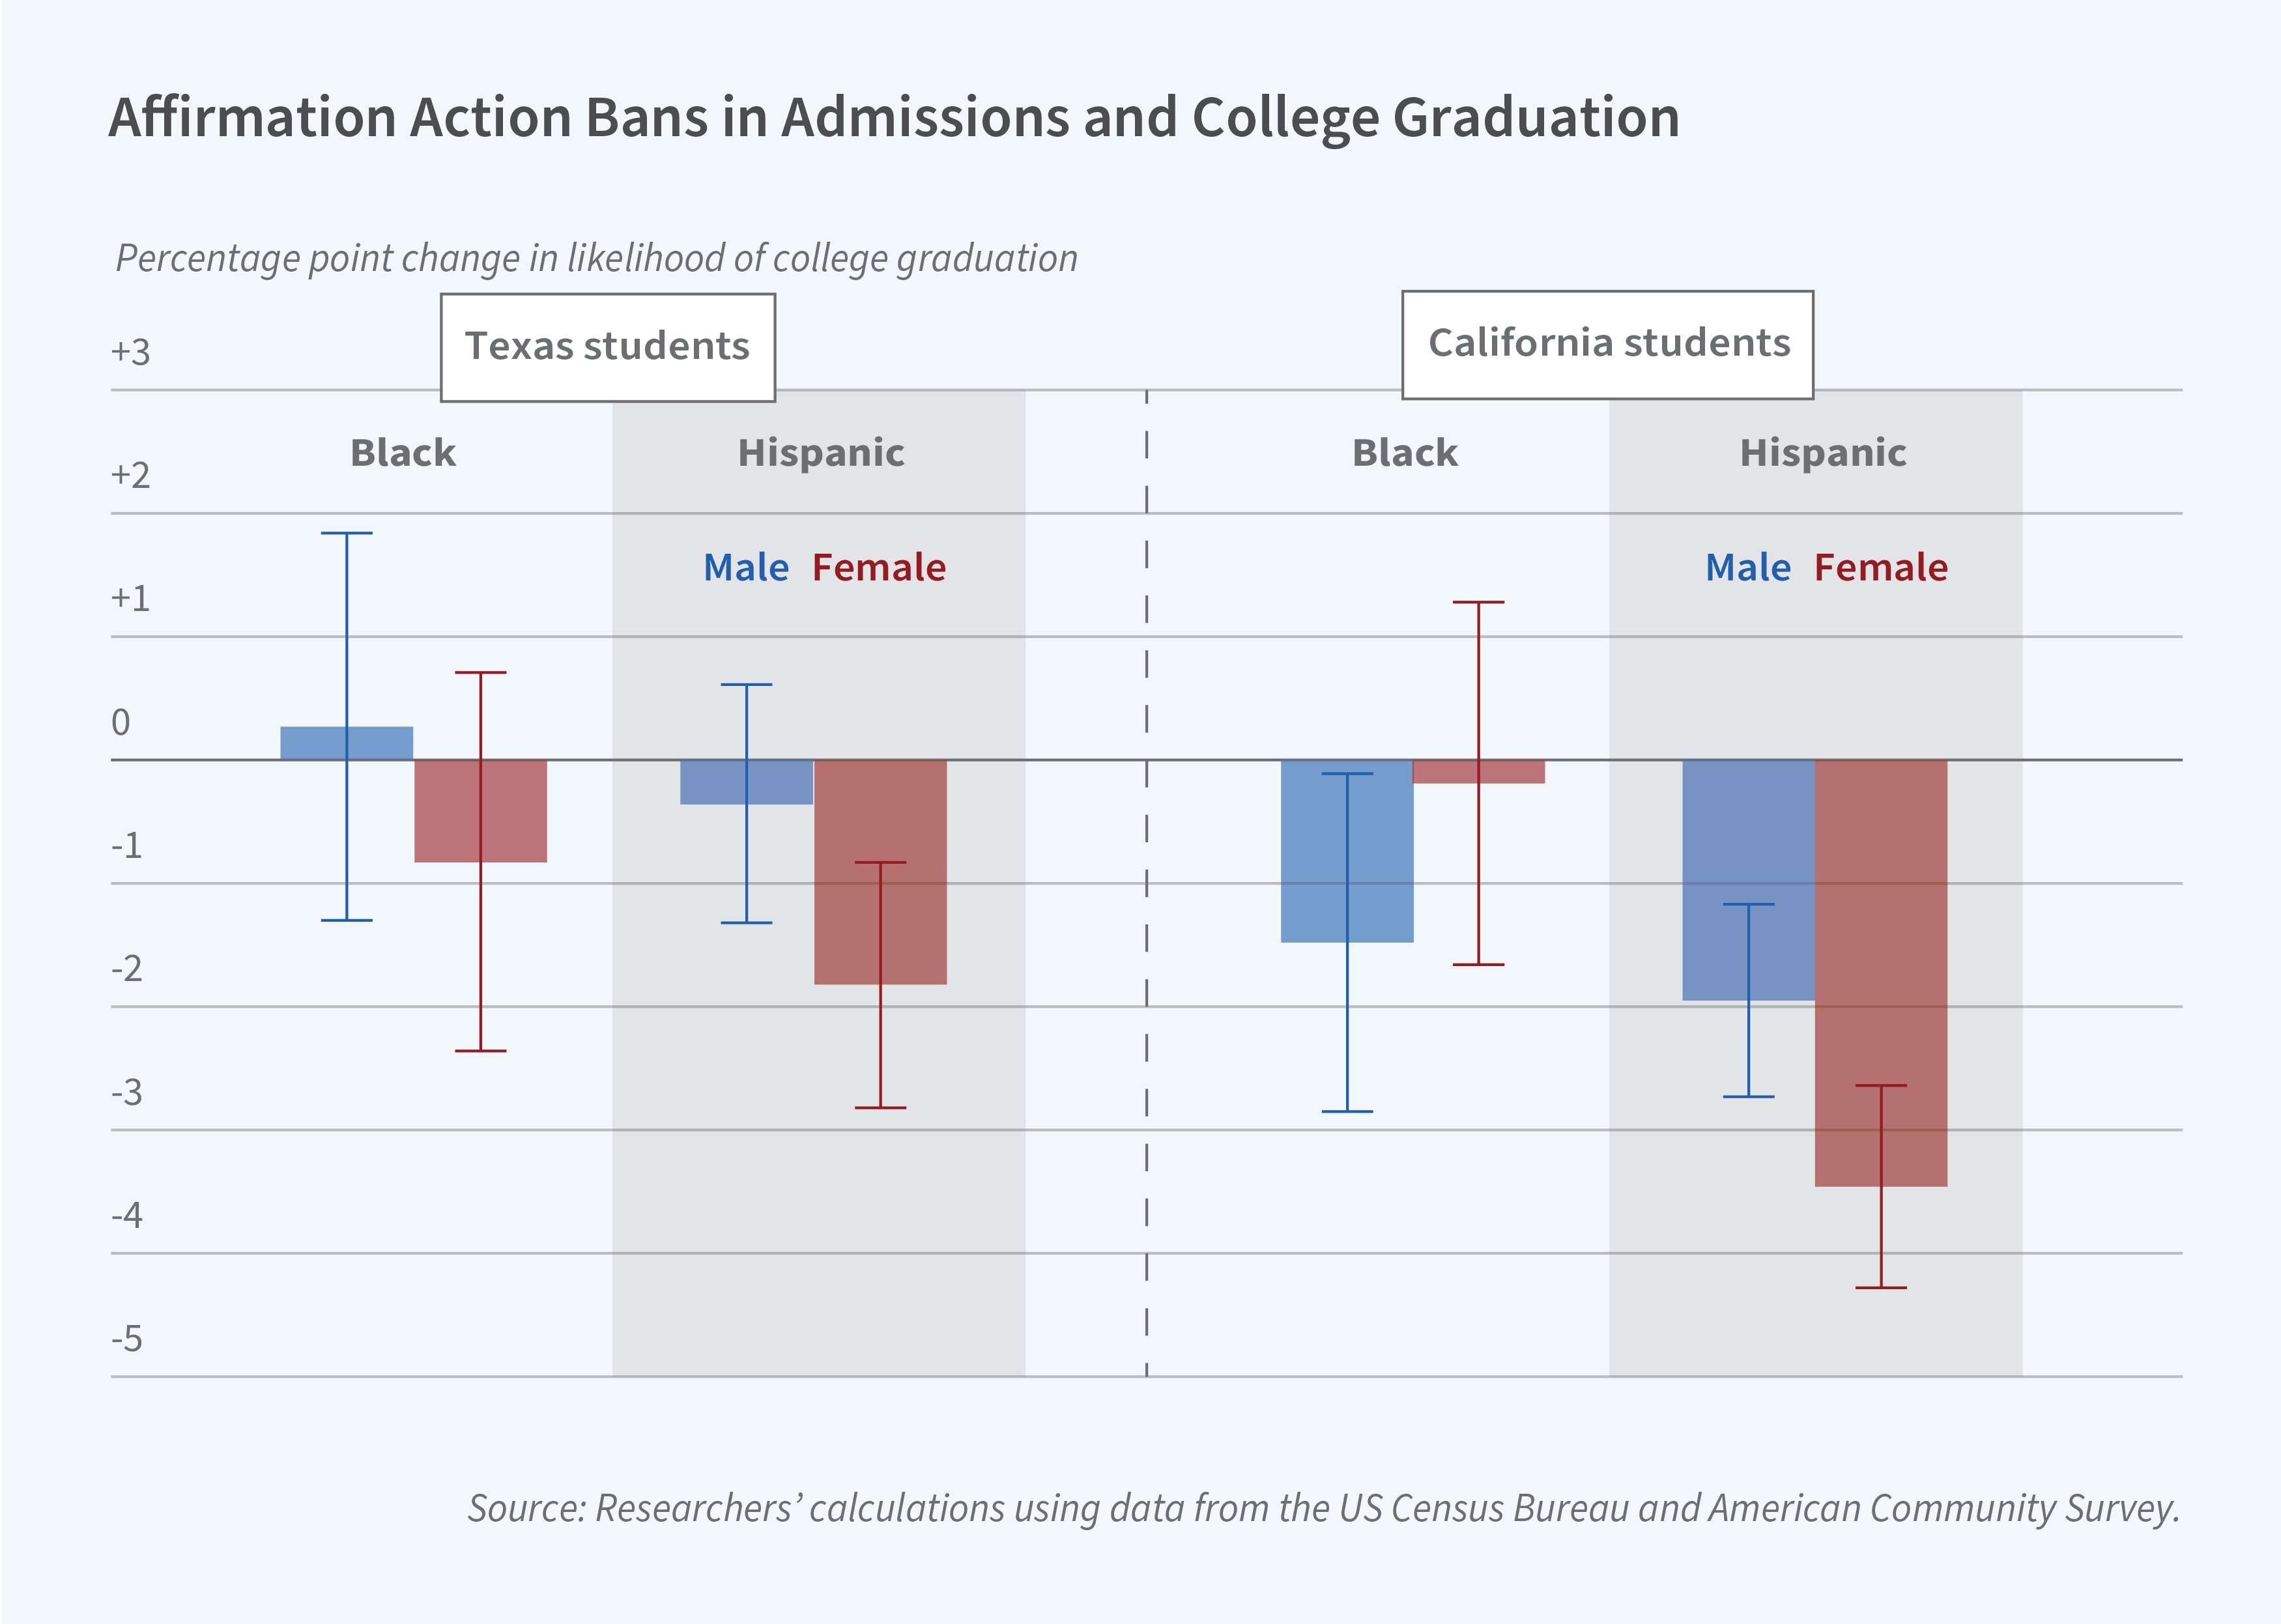
A comprehensive study published by economist Zachary Bleemer in the Quarterly Journal of Economics analyzed the long-term impacts of Proposition 209 on affected students over a 20-year timeframe using administrative data from the University of California Office of the President.
- Immediate Admissions Drop: Following implementation in 1998, underrepresented minority (URM) enrollment at UC Berkeley and UCLA plummeted by more than 50%. At UC Berkeley, Black freshman enrollment fell from 7.3% in 1995 to 3.2% in 1998.
- Cascade Effect to Regional Campuses: URM applicants who were denied admission to elite flagship campuses shifted to less selective institutions within the UC system (such as UC Santa Cruz and UC Riverside) or to the California State University (CSU) system.
- Degree Completion and Earnings: The study revealed that Proposition 209 led to persistent wage declines for underrepresented minority applicants. Affected Black and Hispanic students who missed admission to top-tier campuses earned approximately 5% lower annual wages throughout their late twenties and early thirties compared to similar cohorts before the ban.
- Inefficacy of Non-Race Socioeconomic Alternatives: Despite spending hundreds of millions of dollars on alternative outreach, holistic socioeconomic admissions, and guaranteed admission programs (such as the "Eligibility in the Local Context" top-percentile policy), the UC system required over two decades to restore pre-1998 URM representation metrics to levels reflective of the state's high school graduate demographic profile.
Impact of California Prop 209 on URM Enrollment
- UC Berkeley Black Freshman Enrollment:
- Pre-Ban (1995): 7.3%
- Post-Ban (1998): 3.2%
- Long-Term Economic Impact (Bleemer Study):
- 5% average annual wage decline for affected URM candidates over a 20-year period.
- Cascading enrollment from elite flagship campuses to regional universities.
Comparative Data: Demographic Shifts Across Higher Education
The following table summarizes demographic distributions across select higher education institutions before and after major affirmative action policy changes. Data is compiled from institutional common data sets, public university reporting disclosures, and legal filings.
| Institution / System | Metric Period | Asian American Enrollment (%) | Black Student Enrollment (%) | Hispanic Student Enrollment (%) | White Student Enrollment (%) |
|---|---|---|---|---|---|
| MIT | Pre-SFFA (Class of 2027) | 40% | 15% | 16% | 38% |
| MIT | Post-SFFA (Class of 2028) | 47% | 5% | 11% | 37% |
| Harvard University | Pre-SFFA (Class of 2027) | 37% | 18% | 14% | 30% |
| Harvard University | Post-SFFA (Class of 2028) | 37% | 14% | 11% | 32% |
| UNC Chapel Hill | Pre-SFFA (Class of 2027) | 16.8% | 10.5% | 10.8% | 57.0% |
| UNC Chapel Hill | Post-SFFA (Class of 2028) | 19.0% | 7.8% | 10.1% | 57.8% |
| UC Berkeley | Pre-Prop 209 (1995) | 34.6% | 7.3% | 15.4% | 37.2% |
| UC Berkeley | Post-Prop 209 (1998) | 42.1% | 3.2% | 10.6% | 34.0% |
| UC Berkeley | Modern Recovery (2023) | 39.2% | 3.4% | 22.3% | 24.1% |
Sources: Institutional Office of Planning & Analysis datasets; National Center for Education Statistics (NCES); Bleemer, Z. (2022).
Workplace Affirmative Action and Federal Contractor Statistics
Workplace affirmative action statistics operate under federal statutory frameworks separate from university admissions. While Title VII of the Civil Rights Act of 1964 prohibits race-based employment decisions by private employers, federal contractors face specific outreach and analytical mandates.
OFCCP Enforcement and Compliance Data
The U.S. Department of Labor’s Office of Federal Contract Compliance Programs (OFCCP) enforces non-discrimination and affirmative action mandates across more than 200,000 federal contractor establishments, covering an estimated 20% of the U.S. civilian workforce.
According to published federal enforcement records:
- Corporate Scheduling Announcement Lists (CSAL): The OFCCP conducts thousands of compliance reviews annually to evaluate contractor compensation, hiring, and promotion patterns.
- Financial Remedies: In recent fiscal years, OFCCP enforcement evaluations have resulted in $20 million to $30 million annually in back-pay financial settlements and interest awarded to job applicants and employees affected by systemic hiring or pay disparities.
- Placement Goals vs. Quotas: Under 41 CFR Part 60-2 (Regulations governing Affirmative Action Programs), federal contractors establish "placement goals" if the percentage of women or minorities in a specific job group is lower than their availability in the reasonable recruitment area. Federal regulations explicitly prohibit using placement goals as rigid quotas or set-asides.
| OFCCP Federal Contractor Jurisdiction | Metric / Value |
|---|---|
| Workforce Coverage | ~20% of the U.S. Civilian Workforce |
| Regulated Entities | 200,000+ Federal Contractor Establishments |
| Primary Regulation | Executive Order 11246 / 41 CFR Part 60-2 |
| Annual Enforcement | $20M–$30M in financial remedies & back-pay restitution secured for hiring/pay disparities |
Corporate Diversity and Equal Employment Opportunity (EEO-1) Metrics
Private enterprises with 100 or more employees (and federal contractors with 50 or more employees) submit annual EEO-1 Component 1 Reports to the U.S. Equal Employment Opportunity Commission (EEOC).
Data collected by the EEOC across private sector employers highlights structural patterns in management representation:
- Executive and Senior Management: EEOC aggregated EEO-1 data indicates that White professionals continue to hold a disproportionate share of executive, senior official, and management positions (approximately 75% to 78%), while Black workers hold around 4% to 5% of executive roles, despite representing over 13% of the total workforce.
- Corporate Diversity Initiatives: In response to legal challenges and shifting corporate strategies following the 2023 SCOTUS decision, corporate legal departments have increasingly audited internal Diversity, Equity, and Inclusion (DEI) programs to ensure compliance with Title VII. Programs involving race-restricted fellowships, diversity-linked executive compensation, or supplier diversity quotas have faced legal re-evaluation to avoid exposure to reverse-discrimination lawsuits.
Public Opinion Polling Data on Affirmative Action
Public opinion regarding affirmative action varies significantly depending on survey phrasing, demographic background, and whether the policy applies to college admissions or workplace recruitment.
Data collected by the Pew Research Center and Gallup provides insight into public perceptions prior to and following the 2023 Supreme Court ruling:
College Admissions Polling
- Pew Research Center (2023): Prior to the SFFA ruling, a survey of U.S. adults found that 50% believed taking race and ethnicity into account in college admissions made the process less fair, compared to 14% who said it made it more fair, and 33% who felt it had no impact.
- Racial Breakdown on Admissions: Views on admissions practices differ across demographic lines. A majority of White adults (57%) and Asian adults (53%) stated that race should not factor into admissions decisions. Conversely, Black adults expressed higher levels of support for race-conscious admissions, with 47% stating race should be considered a factor, compared to 29% of Hispanic adults.
Public Sentiment: Should Race Be a Factor in College Admissions? (Pew Research Center National Survey Data)
- Makes Admissions Less Fair: 50%
- Makes Admissions More Fair: 14%
- Has No Impact / Unsure: 33%
Workplace Diversity Polling
- Support for Employment Outreach: While public support for race-conscious college admissions remains constrained, public polling indicates broader approval for workplace diversity efforts focused on non-preference outreach. Surveys conducted by Pew and Gallup show that over 60% of Americans support corporate initiatives aimed at increasing racial and ethnic diversity in candidate recruitment pools, provided that final hiring decisions are based strictly on merit and qualifications.
Practical Actionable Guidance for Administrators and Employers
In response to the current regulatory and legal environment, institutions of higher education and private employers must align their programs with established statutory boundaries.
Strategic Compliance Framework
- Higher Education
- Expand Socioeconomic Factors: Utilize Income, Zip Code, First-Gen Student Indicators.
- Enhance Direct Pipeline: Develop transfer pathways from community colleges.
- Maintain Race-Blind Reviews: Conduct strict legal audits on application processes.
- Employers & Contractors
- Audit Title VII Exposure: Eliminate explicit quotas or race-exclusive programs.
- Focus on Broad Outreach: Expand recruitment networks without race-based preferences.
- Ensure OFCCP Compliance: Maintain placement goals based strictly on availability data.
For University Admissions Offices
- Utilize Socioeconomic Indicators: Replace race-conscious admissions metrics with geographic, socioeconomic, and income-based disadvantage markers (e.g., area deprivation indices, family net worth, high school resource availability).
- Strengthen Transfer Pipelines: Partner with community colleges and regional public institutions to build guaranteed transfer pathways, expanding access for lower-income applicants without violating equal protection mandates.
- Conduct Rigorous Process Audits: Ensure that application review software, scoring rubrics, and interviewer evaluations explicitly exclude race or demographic checkboxes from evaluator view.
For Employers and Federal Contractors
- Conduct Title VII Compliance Reviews: Audit internal recruitment, fellowship, and promotion programs. Remove explicit demographic quotas, set-asides, or race-restricted candidate slates that expose the organization to Title VII litigation.
- Focus on Broad-Based Pipeline Outreach: Expand recruitment efforts to historically underrepresented regions, community institutions, and professional associations without restricting applicants based on race or gender.
- Maintain Compliant OFCCP Programs: Federal contractors must continue to compile mandated Affirmative Action Plans (AAPs) under Executive Order 11246. Ensure that placement goals are calculated strictly through statistical availability analyses and operated as outreach targets rather than hard hiring preferences.
Frequently Asked Questions
Did the 2023 Supreme Court decision ban affirmative action in workplace hiring?
No. The Supreme Court's ruling in SFFA v. Harvard applied specifically to higher education admissions under the Equal Protection Clause of the Fourteenth Amendment and Title VI of the Civil Rights Act of 1964. Workplace employment is governed separately by Title VII of the Civil Rights Act and Executive Order 11246. However, Title VII already strictly prohibits using race as a decision-making factor in hiring, promotion, or termination.
How does federal contractor affirmative action differ from university admissions?
University affirmative action historically allowed admissions officers to use race as an individualized "plus factor" in holistic evaluations. In contrast, federal contractor affirmative action under Executive Order 11246 explicitly prohibits quotas, set-asides, and direct racial preferences. Instead, it mandates that federal contractors analyze workforce demographic data, identify areas of underutilization relative to local labor availability, and engage in broad non-discriminatory outreach.
What is the difference between legacy preferences and affirmative action in college statistics?
Legacy preferences refer to admissions policies that give weight to applicants with family members who attended or donated to the institution. Statistics indicate that legacy preferences disproportionately benefit White and higher-income applicants. Following the end of race-conscious affirmative action, several institutions (such as Johns Hopkins, MIT, and Amherst) eliminated legacy preferences to ensure a more competitive baseline for low-income and first-generation applicants.
How do socioeconomic-based admissions affect demographic diversity?
Data from state-level bans demonstrates that while socioeconomic-based admissions (using factors like family income, zip code, and first-generation status) increase socioeconomic diversity, they do not fully replicate the racial demographic levels produced by direct race-conscious admissions. Combining socioeconomic factors with targeted, non-race-exclusive geographic outreach yields higher levels of racial diversity than income metrics alone.
What are placement goals in federal affirmative action plans?
Placement goals are targets established by federal contractors under OFCCP regulations when the percentage of women or minorities in a specific job group is lower than their availability in the relevant recruitment market. Under federal law, placement goals are not quotas; contractors are not required to hire specific individuals or reserve positions based on demographic traits.
Final Recommendation
To navigate post-affirmative action regulatory environments effectively, higher education officials and workplace compliance officers must adopt evidence-based strategies. Educational institutions should invest in robust, race-neutral pipeline initiatives—such as income-tiered financial aid models, geographic outreach, and community college transfer programs. Employers and federal contractors should conduct comprehensive internal audits to eliminate vulnerable, race-restricted hiring criteria while maintaining compliant, broad-based recruitment programs under OFCCP guidelines and Title VII statutory rules.