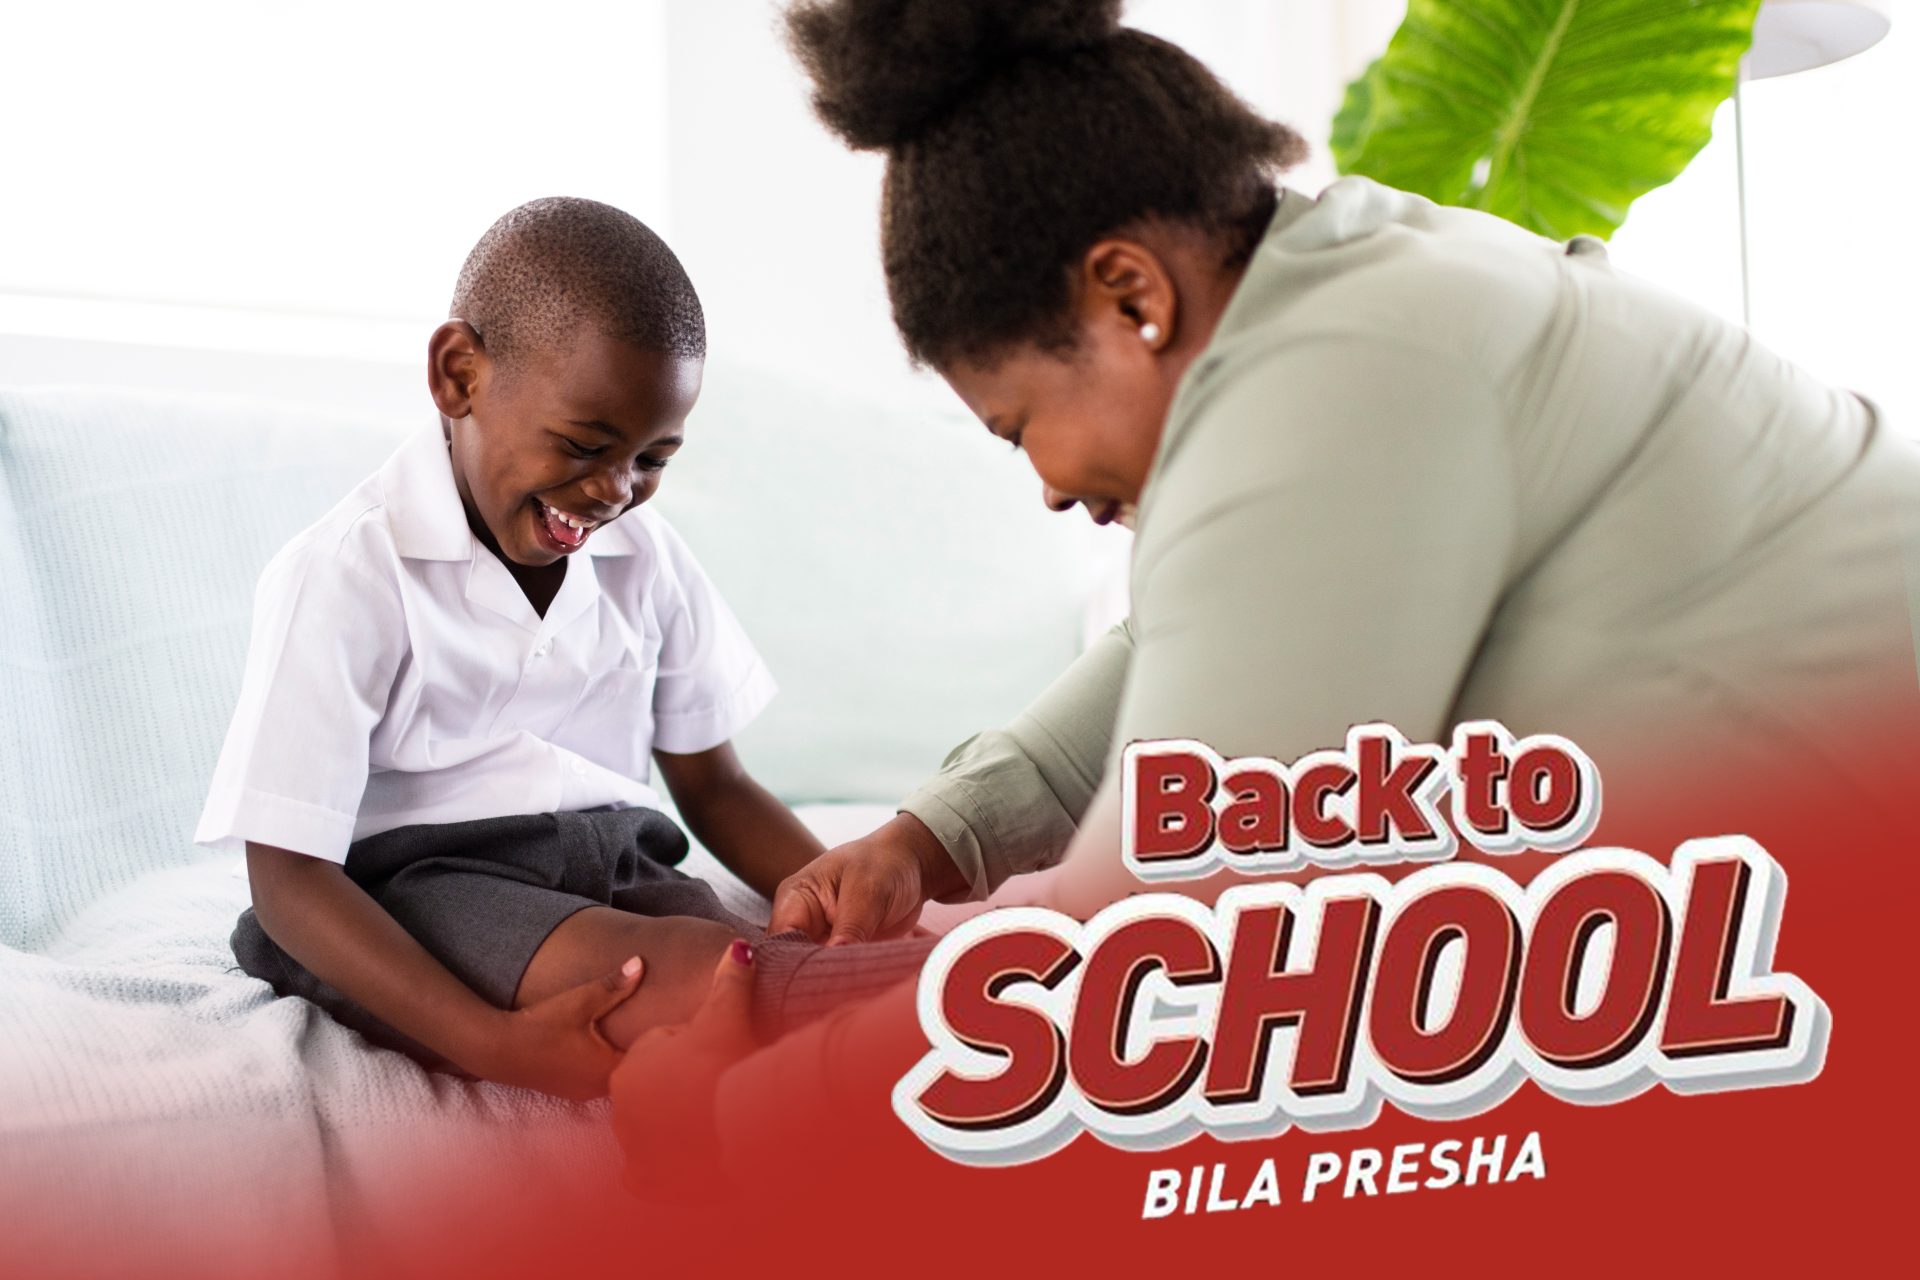
In 2019, the back-to-school season reached a significant economic milestone, with total spending for K-12 and college combined hitting approximately $80.7 billion. This period was characterized by high consumer confidence, a surge in electronics integration for younger students, and a shift toward early-season shopping driven by major mid-summer promotional events.
The Economic Landscape of 2019: A Foundation for Record Spending
To understand the 2019 back-to-school (BTS) spending patterns, one must first look at the macroeconomic environment of that year. From the perspective of 2026, 2019 stands as a benchmark for "traditional" retail behavior before the global shifts of the early 2020s. The U.S. economy in 2019 was marked by a low unemployment rate—hovering around 3.7%—and steady GDP growth. These factors contributed to high consumer sentiment, making households more willing to invest in premium products rather than sticking strictly to "budget" items.
The National Retail Federation (NRF) reported that families were prepared to spend more per child than in many previous years. This wasn't merely a result of inflation; it was a reflection of the evolving requirements of the American classroom. In 2019, the line between "optional" technology and "required" school supplies began to blur significantly, even for elementary school students.
K-12 Spending Breakdown: The $26.2 Billion Market
The K-12 segment (Kindergarten through 12th Grade) accounted for roughly $26.2 billion of the total BTS expenditure. On average, a household with children in this age bracket spent approximately $696.70. This spending was distributed across four primary categories: clothing, electronics, shoes, and traditional school supplies.
Electronics and Computer Equipment
For the first time in several years, electronics saw a massive uptick in the K-12 sector. Families spent an average of $203.44 on electronics alone. This shift was driven by the "1:1 technology initiative" adopted by many school districts, where students were expected to have their own laptops, tablets, or Chromebooks. Unlike previous years where a computer might be a shared household asset, 2019 saw a move toward individual student devices.
Clothing and Accessories
Clothing remained the largest single category for K-12 spending, with an average of $239.82 per household. While uniforms are a factor for some, the broader trend was toward "athleisure" and brand-name footwear. Retailers noted that parents were increasingly influenced by their children’s social media exposure, leading to a preference for specific brands over generic alternatives.
Shoes and Traditional Supplies
Footwear spending averaged $135.96, while traditional school supplies (notebooks, pencils, backpacks) accounted for roughly $117.49. Interestingly, while the volume of traditional supplies purchased remained steady, the "premiumization" of these items—such as ergonomic backpacks and high-end planners—kept the dollar amounts high.
The Back-to-College Powerhouse: $54.5 Billion in Spending
While K-12 gets much of the media attention, the college market is the true heavyweight of the season. In 2019, back-to-college spending reached $54.5 billion, with the average household spending approximately $976.87. This sector is driven by more than just pens and paper; it involves the complete furnishing of new living spaces and high-end professional technology.
Dorm and Apartment Furnishings
The "dorm pride" trend was in full swing in 2019. Students and parents spent an average of $81.75 on furniture and decor. Retailers like Target and Bed Bath & Beyond optimized their inventories for "small space living," offering everything from modular storage to specialized lighting. This category is highly sensitive to aesthetic trends, with social media platforms like Pinterest and Instagram dictating the "must-have" look for the semester.
High-End Electronics for Higher Education
College students are power users of technology. In 2019, the average spend on electronics for college students was $234.69. This included not only laptops but also graphing calculators, tablets for note-taking, and peripheral devices like noise-canceling headphones, which became a staple for studying in communal environments.
Personal Care and Food Supplies
A unique aspect of the college spending overview is the inclusion of "bulk" purchases for personal care and pantry staples. Families often used the BTS season to stock up on toiletries and non-perishable food, contributing an average of $78.70 and $102.98 respectively to the total.
Spending Comparison: 2019 K-12 vs. College
The following table illustrates the average household expenditure across major categories during the 2019 season.
| Category | K-12 Average Spend | College Average Spend |
|---|---|---|
| Electronics/Hardware | $203.44 | $234.69 |
| Clothing & Accessories | $239.82 | $148.54 |
| Shoes | $135.96 | $82.52 |
| School/Dorm Supplies | $117.49 | $81.75 |
| Personal Care/Food | N/A | $181.68 |
| Total (Average Household) | $696.70 | $976.87 |
Note: Data based on NRF and Prosper Insights & Analytics 2019 surveys.
Shopping Channels: Where the Money Was Spent
The 2019 season was a pivotal moment for "omnichannel" retail. Consumers no longer relied on a single store; they blended physical and digital experiences to find the best deals.
- Department Stores (53%): Remains the most popular destination for K-12 shoppers due to the ability to "one-stop shop" for clothing and supplies.
- Online Retailers (49%): Online shopping continued its upward trajectory. The 2019 Amazon Prime Day (held in July) acted as the unofficial kickoff for the BTS season, forcing competitors like Walmart and Target to launch their own digital sales.
- Discount Stores (44%): Essential for bulk purchases of basic supplies like folders and paper.
- Clothing Stores (38%): Preferred for specific brand requirements and "try-on" experiences for growing children.
- Office Supply Stores (30%): Specifically targeted for specialized tech and ergonomic furniture.
Timing and Consumer Psychology: The "Early Bird" Shift
In 2019, the "Last Minute" shopper was becoming a rarity. According to consumer data, 22% of shoppers started at least two months before the start of school. This shift was largely influenced by retailers moving their promotional calendars forward. By early July, back-to-school displays were already prominent.
The psychology behind this was twofold. First, parents wanted to spread the financial burden over several pay periods. Second, there was a growing fear of "stock-outs" on popular tech items and specific clothing sizes. Retailers capitalized on this by offering "Buy Online, Pick Up In Store" (BOPIS) options, which saw a 30% increase in utilization compared to 2018.
The Impact of Trade and Tariffs
A significant technical detail of the 2019 spending season was the looming threat of tariffs on Chinese imports. As the trade environment grew uncertain, many retailers front-loaded their inventory to avoid potential price hikes that were expected later in the year.
While some consumers expressed concern that prices for backpacks and electronics would skyrocket, most major retailers absorbed the initial costs to maintain competitive pricing during the peak BTS window. However, this pressure led to a decrease in "deep discount" promotions, as margins were already squeezed.
Sustainable and Socially Conscious Spending
2019 marked a noticeable rise in the "conscious consumer." A segment of the population began prioritizing sustainable materials, such as recycled plastic backpacks or PVC-free binders. While still a niche market compared to the mass-market discount sector, brand loyalty in 2019 started to correlate with a company's perceived social or environmental responsibility. Brands that offered "buy one, give one" programs for underprivileged students saw higher engagement rates among Gen Z and Millennial parents.
Common Mistakes in 2019 BTS Budgeting
Despite the high spending, many households struggled with budget overruns. Several factors contributed to this:
- Underestimating Tech Accessories: Parents often budgeted for a laptop but forgot the costs of protective cases, software subscriptions, and extended warranties.
- The "Duplicate" Trap: Without a proper inventory of the previous year’s supplies, many families bought items they already had in storage.
- Ignoring the College "Hidden Costs": For college students, the cost of specialized textbooks and lab fees often exceeded the initial "back-to-school" budget, leading to financial strain in late September.
Strategic Retail Responses
Retailers in 2019 utilized big data more aggressively than in previous years. By analyzing previous purchase histories, stores sent personalized digital coupons to parents exactly when they were predicted to start shopping. Loyalty programs were also revamped; for example, Target’s "Circle" program provided early access to BTS deals, which helped retain customers who might have otherwise migrated to Amazon.
The integration of social media "influencers"—particularly those in the "studygram" or "teachergram" niches—played a vital role in moving specific products. When a popular educator recommended a specific brand of felt-tip pens or a planner, those items frequently sold out within days.
Frequently Asked Questions
What was the total combined spending for the 2019 back-to-school season?
The total projected spending was approximately $80.7 billion. This was split between $26.2 billion for K-12 students and $54.5 billion for college students. The high total was a result of strong consumer confidence and an increased need for high-cost electronics.
Why did K-12 spending on electronics increase so much in 2019?
The increase was primarily due to the widespread adoption of digital learning tools in schools. Many districts required students to have individual laptops or tablets. Additionally, the move toward "blended learning" necessitated better home computing setups, including high-speed routers and peripherals.
How did Amazon Prime Day affect 2019 back-to-school shopping?
Amazon Prime Day 2019, held in July, served as a major catalyst for early spending. It forced other major retailers like Target and Walmart to launch their own sales events simultaneously, effectively shifting the peak shopping window from August to mid-July.
What was the average spending per household for college students in 2019?
The average household with a college student spent approximately $976.87. This higher figure, compared to K-12, accounts for large expenses such as dorm room furniture, professional-grade technology, and bulk purchases of food and personal care items.
Did tariffs on Chinese goods increase prices in 2019?
While there was significant concern about tariffs, most retailers managed to keep prices stable during the BTS season by front-loading their inventory or absorbing the costs to remain competitive. However, the threat of tariffs did lead to fewer deep-discount sales events in certain categories like electronics and apparel.
What was the most popular shopping destination in 2019?
Department stores remained the top destination, used by 53% of K-12 shoppers. Online shopping followed closely at 49%, reflecting a strong preference for omnichannel shopping where consumers compare prices online before buying in-store or having items delivered.
Practical Recommendation for Historical Data Analysis
For researchers or retail strategists analyzing the 2019 data from the vantage point of 2026, it is essential to view 2019 as the "peak" of traditional brick-and-mortar and e-commerce synergy. When comparing this data to subsequent years, one should account for the permanent shift toward digital-first shopping that accelerated shortly after this period. The 2019 season provides a "clean" look at consumer behavior driven purely by economic strength and technological integration, without the external variables of global supply chain disruptions seen in later years. To apply these insights today, focus on the "early start" trend and the "premiumization" of essential goods, as these behaviors have only intensified in the current 2026 market.