The Russell 1000 Index serves as a foundational benchmark for the U.S. large-cap equity market, representing approximately 90% of the total market capitalization of the U.S. equity universe. Comparing the Russell 1000 involves analyzing its constituent composition, performance methodologies, and historical tracking characteristics against other major indices like the S&P 500 or the Russell 2000 to determine its suitability for institutional benchmarking or passive investment strategies.
The Architecture of the Russell 1000 Index
To effectively compare the Russell 1000 index, one must first understand how it is constructed. Maintained by FTSE Russell, the index is a subset of the Russell 3000 Index. It is specifically designed to capture the performance of the 1,000 largest companies in the United States based on market capitalization. Unlike indices that are committee-driven, the Russell 1000 is rule-based, meaning that the inclusion or exclusion of a company is determined strictly by its market cap ranking at the time of the annual reconstitution.
The annual reconstitution is a critical event that takes place each June. During this time, the entire U.S. equity market is assessed, and the index is recalibrated to reflect the current landscape of large-cap stocks. This process ensures that the index remains representative of the shifting weight of market leaders. For investors and analysts, understanding this frequency is paramount; it means that the index is not static and that "drift" within the index is corrected on a predictable schedule.
Comparative Framework: Russell 1000 vs. S&P 500
The most frequent comparison requested by market participants is between the Russell 1000 and the S&P 500. While both indices are widely used as benchmarks for U.S. large-cap stocks, their methodologies diverge in ways that can lead to tracking differences.
The S&P 500 is a committee-managed index. While it is heavily weighted toward market capitalization, a committee selects the stocks based on specific criteria, including liquidity, financial viability, and sector balance. In contrast, the Russell 1000 is purely quantitative. This results in the Russell 1000 often holding a slightly broader range of companies—specifically, it usually holds around 1,000 securities compared to the 500 held by the S&P.
Investors often find that the performance of the two indices is highly correlated, often moving in tandem due to the dominance of mega-cap stocks in both. However, the Russell 1000’s inclusion of the "smaller" large-caps (those ranked 501 to 1,000) provides a marginally different exposure profile. When conducting a comparison, you must look at:
- Weighting Concentration: The degree to which the top 10 companies influence the index's overall performance.
- Sector Representation: How the mechanical selection of the Russell 1000 compares to the committee-influenced sector balance of the S&P 500.
- Tracking Error: The historical variance between index returns when both are used as benchmarks for large-cap domestic funds.
Comparative Framework: Russell 1000 vs. Russell 2000
A common error in financial analysis is confusing the Russell 1000 with the Russell 2000. While they are siblings within the Russell 3000 Index, they serve vastly different analytical purposes. The Russell 1000 represents the "Large-Cap" segment, whereas the Russell 2000 serves as the primary benchmark for the "Small-Cap" segment.
Comparing these two indices is essential for understanding market rotation. During periods of economic expansion, small-cap stocks (Russell 2000) may outperform large-cap stocks (Russell 1000) due to higher growth potential. Conversely, during periods of market volatility or economic contraction, large-cap stocks often provide a "flight to quality" and relative stability. A professional-grade comparison should analyze the relative performance of these two indices to gauge investor sentiment regarding risk appetite.
Comparative Metrics Table
The following table summarizes the primary differences between common U.S. equity benchmarks to assist in identifying the correct tool for your specific objective.
| Index | Primary Focus | Selection Method | Representative Market |
|---|---|---|---|
| Russell 1000 | Large-Cap | Purely Quantitative | ~90% of US Market |
| S&P 500 | Large-Cap | Committee-Based | ~80% of US Market |
| Russell 2000 | Small-Cap | Purely Quantitative | ~10% of US Market |
| Russell 3000 | Broad Market | Purely Quantitative | ~98% of US Market |
Practical Considerations for Institutional Benchmarking
When choosing between these indices for benchmarking or investment purposes, the "cost" of the index is not a fee paid to a publisher, but rather the operational cost of tracking. Passive funds attempting to replicate the Russell 1000 must manage the turnover generated during the annual reconstitution. Because the Russell 1000 is rule-based, the turnover is somewhat predictable. This predictability can be a significant advantage for fund managers, as it allows them to prepare for the addition or deletion of securities in advance, potentially reducing transaction costs compared to committee-based indices where changes may be announced with less notice.
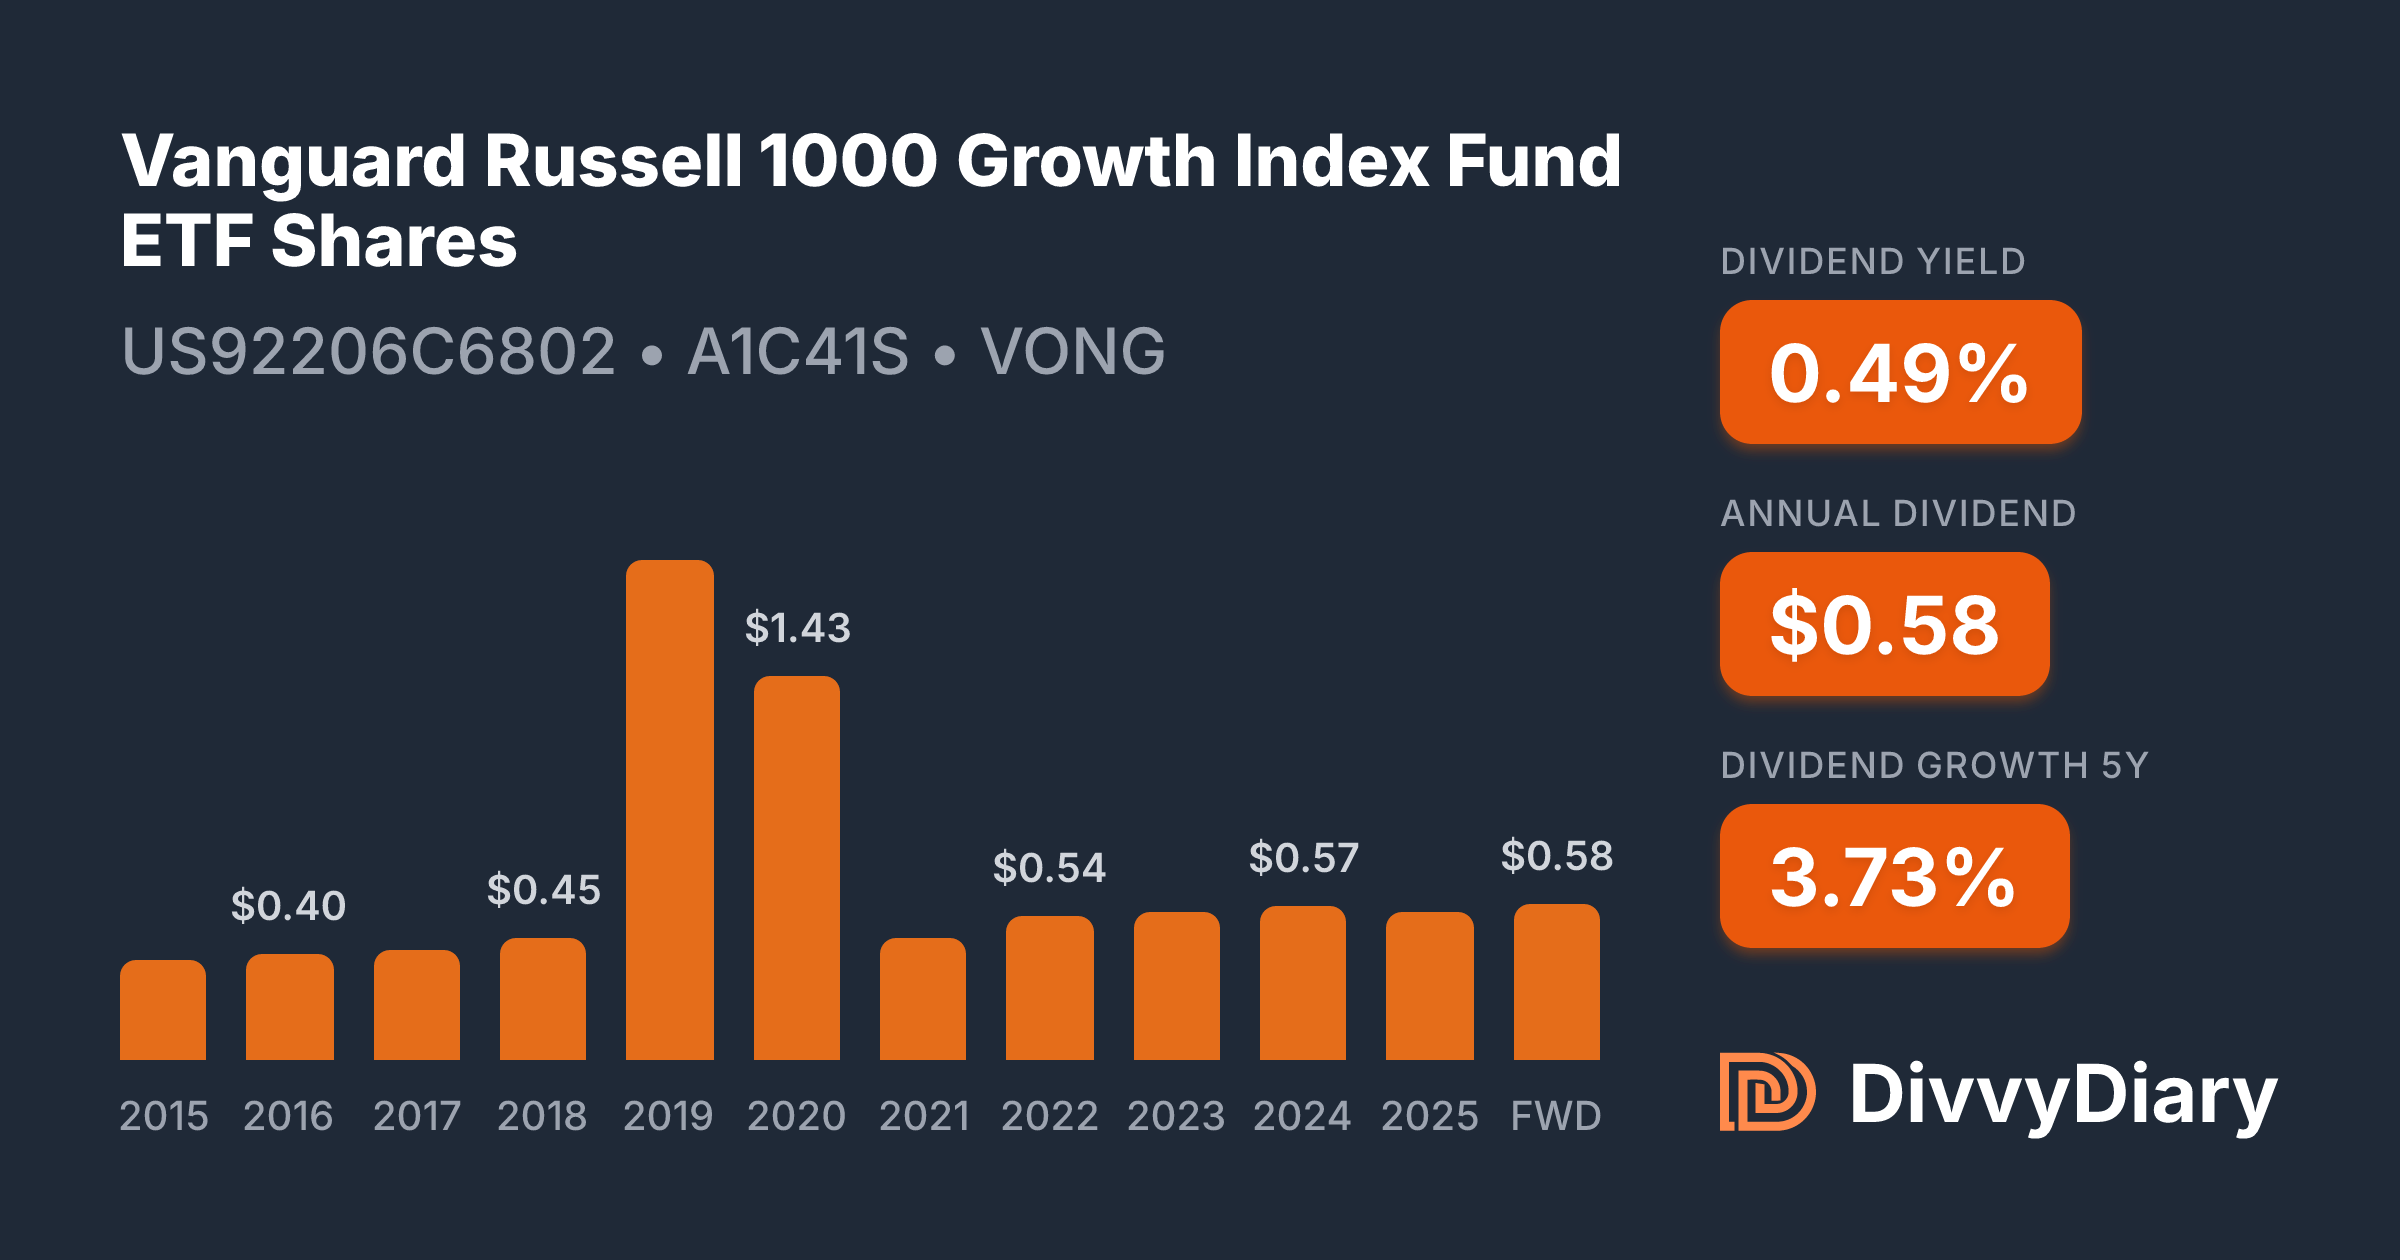
Furthermore, investors must consider the "Growth" and "Value" sub-indices. FTSE Russell splits the Russell 1000 into the Russell 1000 Growth and Russell 1000 Value indices. Comparing the relative performance of these sub-indices is a standard practice for assessing whether the market is currently favoring companies with high price-to-book ratios and forecasted growth or those with lower valuations and higher dividend yields.
Identifying and Mitigating Tracking Error
For those utilizing the Russell 1000 as a benchmark for a portfolio, "Tracking Error" is the most critical metric. This refers to the standard deviation of the difference between the returns of the investment portfolio and the index.
- Reconstitution Impact: Large institutional portfolios may struggle to perfectly replicate the index exactly on the day of reconstitution. Differences in execution price can lead to drift.
- Corporate Actions: Stock splits, mergers, and acquisitions change the makeup of the index. An effective comparison includes analyzing how the portfolio manager accounts for these events versus how the index provider handles them in the official calculations.
- Dividend Reinvestment: The comparison must account for whether you are using the "Price Return" index or the "Total Return" index (which includes dividends). Comparing the two without consistency will yield fundamentally flawed conclusions.
Frequently Asked Questions
Why does the Russell 1000 often outperform or underperform the S&P 500? The performance difference is primarily due to the "tail" of the Russell 1000. Because it includes the 501st to 1,000th largest companies, it has more exposure to mid-sized firms than the S&P 500. When mid-cap stocks perform well, the Russell 1000 often shows a slight divergence from the S&P 500.
Is the Russell 1000 a better benchmark than the S&P 500 for US stocks? Neither is objectively "better." The S&P 500 is arguably the most recognized proxy for the U.S. economy, but the Russell 1000 offers a more systematic, rule-based approach that some institutional investors prefer for its transparency and lack of committee subjectivity.
How often does the Russell 1000 change its composition? The composition changes significantly once per year during the June reconstitution. Throughout the rest of the year, changes are limited to corporate actions like spin-offs or bankruptcy-related deletions, which are handled according to FTSE Russell’s published index methodology.
What is the impact of index drift on my comparative analysis? Index drift occurs when the market capitalization of stocks changes between reconstitution periods. Your analysis should account for the fact that the index weights are constant between annual rebalancing events, meaning the index may become more concentrated in specific sectors as a few companies grow faster than others.
Where can I verify the current constituents of the Russell 1000? Official constituent lists are provided by FTSE Russell. Always ensure you are accessing the official data source, as third-party financial sites may display delayed or incomplete information.
Next Actions for Portfolio Managers
If your goal is to utilize the Russell 1000 for performance benchmarking, your immediate next step should be to acquire the current "Index Factsheet" from the FTSE Russell website. This document provides the most accurate and up-to-date information on sector weightings, top ten holdings, and index characteristics.
Once you have the factsheet, perform a side-by-side analysis of your existing portfolio’s sector exposure against the index. If your goal is to minimize tracking error, identify which sectors in your portfolio are over-represented compared to the Russell 1000 and evaluate whether this variance is intentional (as an active strategy) or accidental. For those seeking passive replication, focus your research on the liquidity of the underlying components to ensure that your rebalancing trades can be executed at or near the index’s closing prices during reconstitution periods.