The 2016 presidential election results by precinct provide the most granular view of American political geography, revealing a complex tapestry of voting behavior often hidden by state-level data. By analyzing approximately 175,000 individual precincts, these maps—most notably the interactive visualization produced by The New York Times—show how localized shifts in the "Blue Wall" and urban-rural divides decided the outcome.
The 2016 election between Donald Trump and Hillary Clinton remains one of the most studied political events in American history. While standard electoral college maps show a nation divided into red and blue blocks, the reality at the street level is far more nuanced. In 2026, as political scientists and data analysts look back on the decade following that pivotal vote, the precinct-level map stands as the essential tool for understanding the demographic and geographic realignments that continue to shape modern politics.
The Significance of Precinct-Level Data in 2016
A precinct is the smallest unit of election administration in the United States. While there are only 50 states and roughly 3,100 counties, there are nearly 175,000 precincts. Mapping results at this level is a massive undertaking because the data is not centralized; it must be gathered from thousands of local election boards, county clerks, and state archives.
When we view the 2016 results by precinct, the "sea of red" that dominates county-level maps begins to show "islands" and "archipelagos" of blue, even in the most conservative states. Conversely, it reveals pockets of conservative strength within deep-blue urban centers. This level of detail is crucial for several reasons:
- Population Density vs. Geography: Standard maps prioritize land area, making sparsely populated Republican-leaning counties appear more influential than dense Democratic-leaning cities. Precinct maps allow for a more honest assessment of how people, rather than acres, are distributed.
- Neighborhood Polarization: It shows how political identity can change drastically within a single city, often following lines of socioeconomic status, race, and education.
- Voter Mobilization: For campaigns, precinct data is the "gold standard" for determining where to knock on doors or buy local advertisements.
Understanding the "Extremely Detailed Map" of the 2016 Election
The most famous iteration of this data is often referred to as the "Extremely Detailed Map," originally published by The New York Times Upshot in 2018 and maintained as a historical record. This map was the result of a massive data collection effort led by Ryne Rohla, then a doctoral student at Washington State University, in collaboration with Decision Desk HQ.
The Technical Achievement of the Visualization
Creating a single map that shows 2016 presidential results by precinct required cleaning and standardizing data from disparate formats—some digital, some paper, and some incomplete. The technical challenge was ensuring that precinct boundaries (GIS shapes) matched the reported vote totals. Because precinct lines are frequently redrawn, the 2016 boundaries had to be meticulously reconstructed to provide an accurate historical snapshot.
The interactive nature of this map allows users to zoom in to their own street. At the highest zoom levels, one can see how a single highway or a neighborhood park can act as a political boundary. This granularity revealed that the 2016 election was not just a battle of regions, but a battle of neighborhoods.
Key Regional Insights Revealed by the Map
When analyzing the 2016 precinct map, several key trends emerge that were nearly invisible on the state-level maps seen on election night. These trends provide the "why" behind Donald Trump's Electoral College victory despite Hillary Clinton's popular vote lead.
The Crumbling of the "Blue Wall"
In states like Michigan, Wisconsin, and Pennsylvania, the precinct map shows a devastating erosion of Democratic support in mid-sized industrial towns and rural areas. While Clinton maintained strong margins in Detroit, Milwaukee, and Philadelphia, the map reveals a "hollowing out" of support in the surrounding suburbs and the "Rust Belt" precincts that had historically voted for Barack Obama.
For example, in Lackawanna County, Pennsylvania (home to Scranton), the precinct-level view shows significant "flipping" in working-class neighborhoods that had been reliably Democratic for decades. These micro-shifts, when aggregated, resulted in the narrow margins that flipped entire states.
The Urban-Rural Divergence
The 2016 precinct map illustrates the starkest urban-rural divide in modern history. The map shows "islands" of blue in a "sea" of red. However, the precinct data shows that even within "red" rural areas, college towns and county seats often remained "blue dots." Similarly, in "blue" cities, the map highlights the conservative pockets in wealthier enclaves or specific ethnic neighborhoods that shifted toward the Republican platform.
Sun Belt Shifts
While Trump won the Rust Belt, the precinct map also showed the beginnings of a shift in the Sun Belt. In states like Arizona, Georgia, and Texas, the 2016 precinct data showed Clinton making significant gains in suburban precincts that had previously been Republican strongholds. These shifts served as the precursor to the results of 2020 and 2024, proving that the 2016 map was not just a record of a single election, but a roadmap for future political realignment.
Comparative Analysis: Precincts vs. Counties
To understand why the precinct map is so much more valuable than a county map, we must look at the "masking effect" of larger geographic units.
| Geographic Unit | Total Units (Approx.) | Primary Insight | Common Misconception |
|---|---|---|---|
| National | 1 | Overall popular sentiment and winner. | Suggests a unified national will. |
| State | 50 | Electoral College impact and legislative power. | Implies states are "all red" or "all blue." |
| County | 3,142 | Regional economic and cultural trends. | Masks significant diversity within large counties (e.g., Cook, LA). |
| Precinct | 175,000 | Hyper-local voting behavior and demographic shifts. | Requires massive data processing; can be overwhelming. |
The table above demonstrates that as the scale of the map becomes smaller (more detailed), the nuance of the American electorate increases. The precinct map is the only tool that can accurately show how a "blue" county like Cook County, Illinois, actually contains dozens of "red" precincts on its fringes.
Methodological Challenges in Mapping 2016 Results
While the 2016 precinct map is an invaluable resource, it is important to understand its limitations and the hurdles faced by the researchers who created it.
Missing Data and "Absentee" Precincts
In many states, mail-in ballots or absentee votes are not counted at the precinct level. Instead, they are aggregated at the county or state level. This means that in states with high mail-in voting, the precinct map might only represent "day-of" voters, which can skew the results. Researchers must use statistical methods to "back-allocate" these votes to precincts to create a complete picture, a process that involves a degree of estimation.
Geographies of Non-Voting
A precinct map shows who did vote, but it often fails to visualize who did not. In many urban precincts that Clinton won by large margins, the map hides the fact that voter turnout was significantly lower than in 2012. Conversely, in the rural precincts Trump won, turnout was often record-breaking. A truly comprehensive map of the 2016 election must be viewed in tandem with turnout data to understand the full story of the "missing" voters.
The "Purple" Problem
Most precinct maps use a binary red/blue color scheme (choropleth maps). This can create a false sense of total dominance. In reality, many "red" precincts were won with 51% of the vote, and many "blue" ones were equally close. Advanced versions of the 2016 map use "purple" shading or "dot-density" techniques to show the actual margin of victory, providing a more accurate representation of a politically competitive neighborhood.
The Legacy of the 2016 Precinct Map in 2026
A decade after the 2016 election, this map remains a primary source for redistricting battles and campaign strategy. The data revealed in these 175,000 precincts formed the basis for "gerrymandering" litigation, as both parties used the 2016 results to draw maps that maximized their advantage.
Furthermore, the 2016 precinct map changed how the media reports on elections. The "Big Board" style of reporting, which focuses on counties, has been supplemented by "deep dives" into specific precincts in swing states like Maricopa County, Arizona, or Fulton County, Georgia. The 2016 map proved that elections are won or lost in the "interstitial spaces"—the suburbs and exurbs that are only visible when you zoom in past the county level.
Practical Applications for Researchers
For those looking to utilize this data in 2026, several repositories maintain the 2016 precinct files:
- Harvard Dataverse: Hosts various iterations of the precinct-level data for academic use.
- MIT Election Data and Science Lab: Provides cleaned datasets for the 2016 election and subsequent cycles.
- OpenElections: A volunteer-driven project that works to provide a free, open-source set of election results at the precinct level.
Frequently Asked Questions
How many precincts were there in the 2016 election?
There were approximately 175,000 precincts across the United States in 2016. The exact number varies slightly between different data sources because some jurisdictions combine precincts for certain elections or fail to report data for very small precincts with few voters.
Why does the 2016 map look mostly red if Clinton won the popular vote?
The map looks mostly red because Republican voters are more geographically dispersed across rural areas, which cover a larger landmass. Democratic voters are concentrated in high-density urban areas, which take up very little space on a map. This is often described as the "Land Doesn't Vote" phenomenon.
Is there one single official 2016 precinct map?
There is no single "official" federal map, as elections are managed at the state and local levels. However, the map produced by The New York Times (The Upshot) in collaboration with Ryne Rohla is widely considered the definitive public-facing visualization of the 2,016 precinct results.
How accurate are precinct-level maps?
They are highly accurate for "day-of" voting but can be less precise regarding mail-in and provisional ballots, which are often reported at a higher geographic level (like the county). Researchers use various "allocation" methods to assign those votes back to precincts, but these are statistical estimates rather than raw counts.
Can I find my own house on the 2016 precinct map?
Yes, using interactive versions like the NYT "Extremely Detailed Map," you can zoom in to the street level to see exactly how your specific neighborhood or precinct voted in the 2016 presidential contest.
Strategic Recommendation for Data Analysis
When using the 2016 presidential results by precinct for any serious political or sociological research, it is vital to cross-reference the results with demographic census data. A precinct map tells you what happened, but it doesn't tell you who did it. By layering the 2016 precinct results over 2010 or 2020 Census Bureau data (such as income, education level, and race), you can identify the specific drivers of the 2016 realignment.
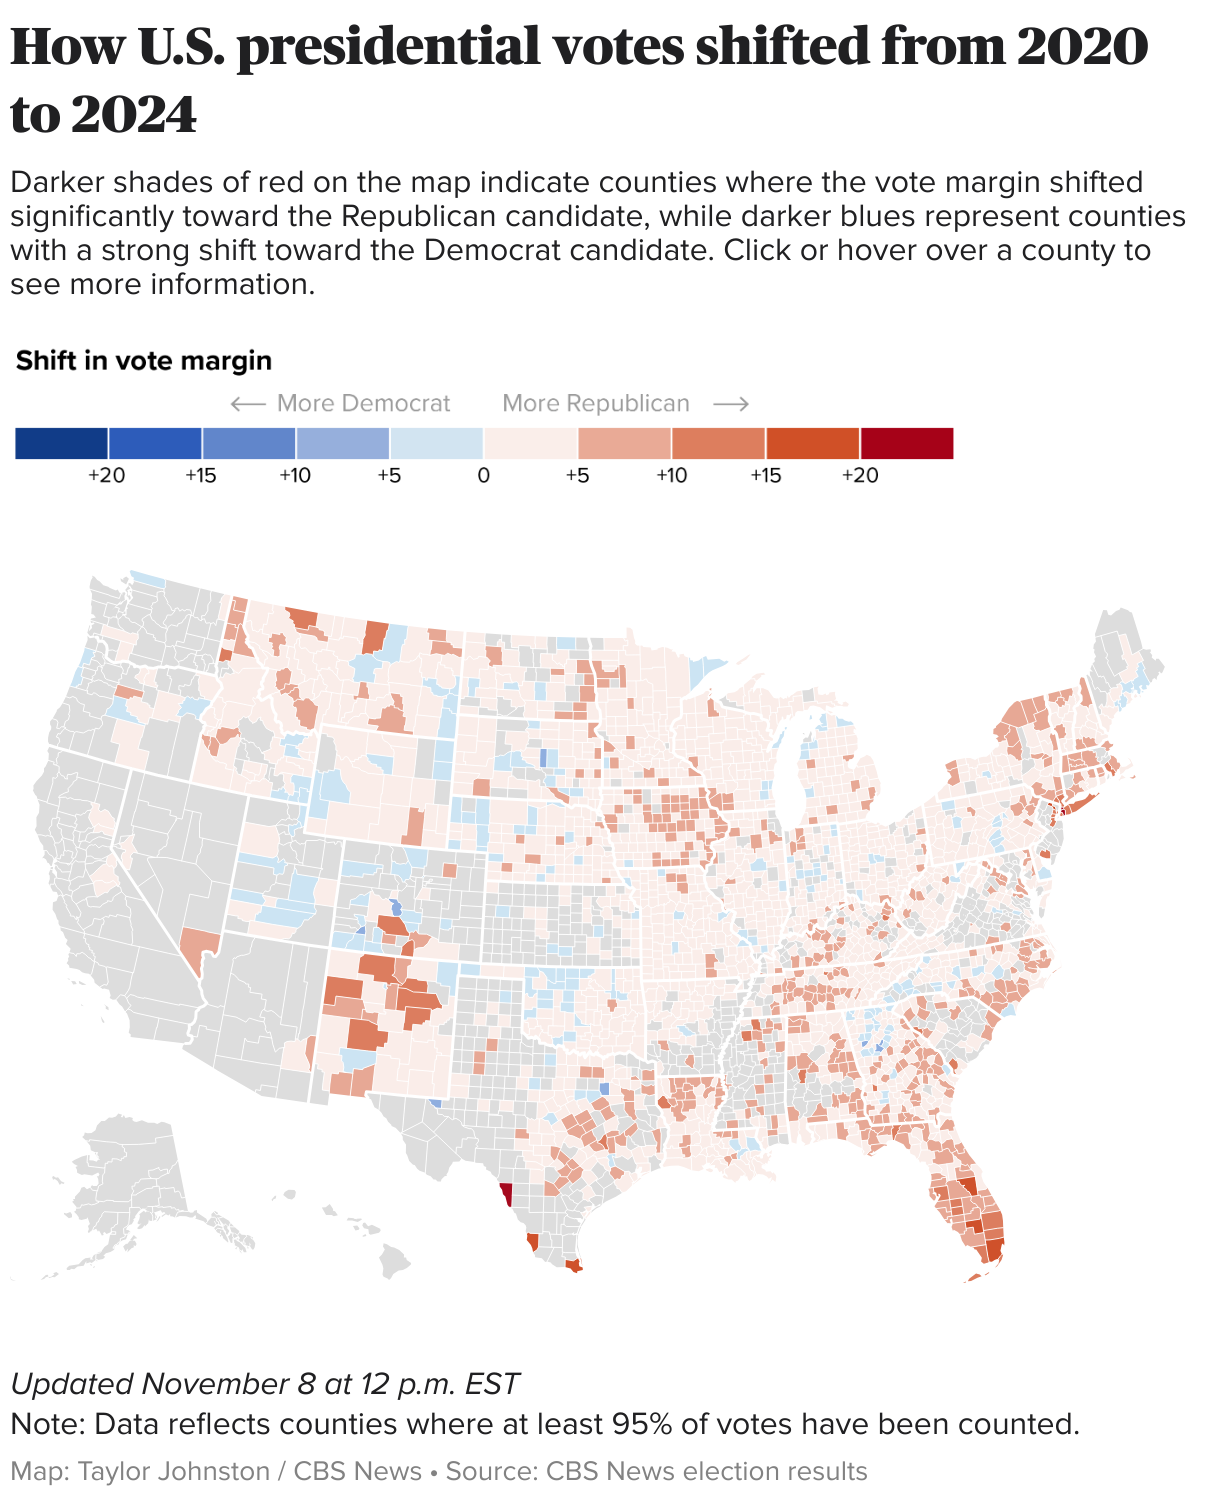
For those interested in current trends, comparing the 2016 precinct map directly against the 2020 and 2024 maps provides the most accurate view of "swing" neighborhoods—the specific areas where voters are most likely to switch parties. These "purple" precincts are the true battlegrounds of American democracy and remain the focus of every major political campaign in 2026.