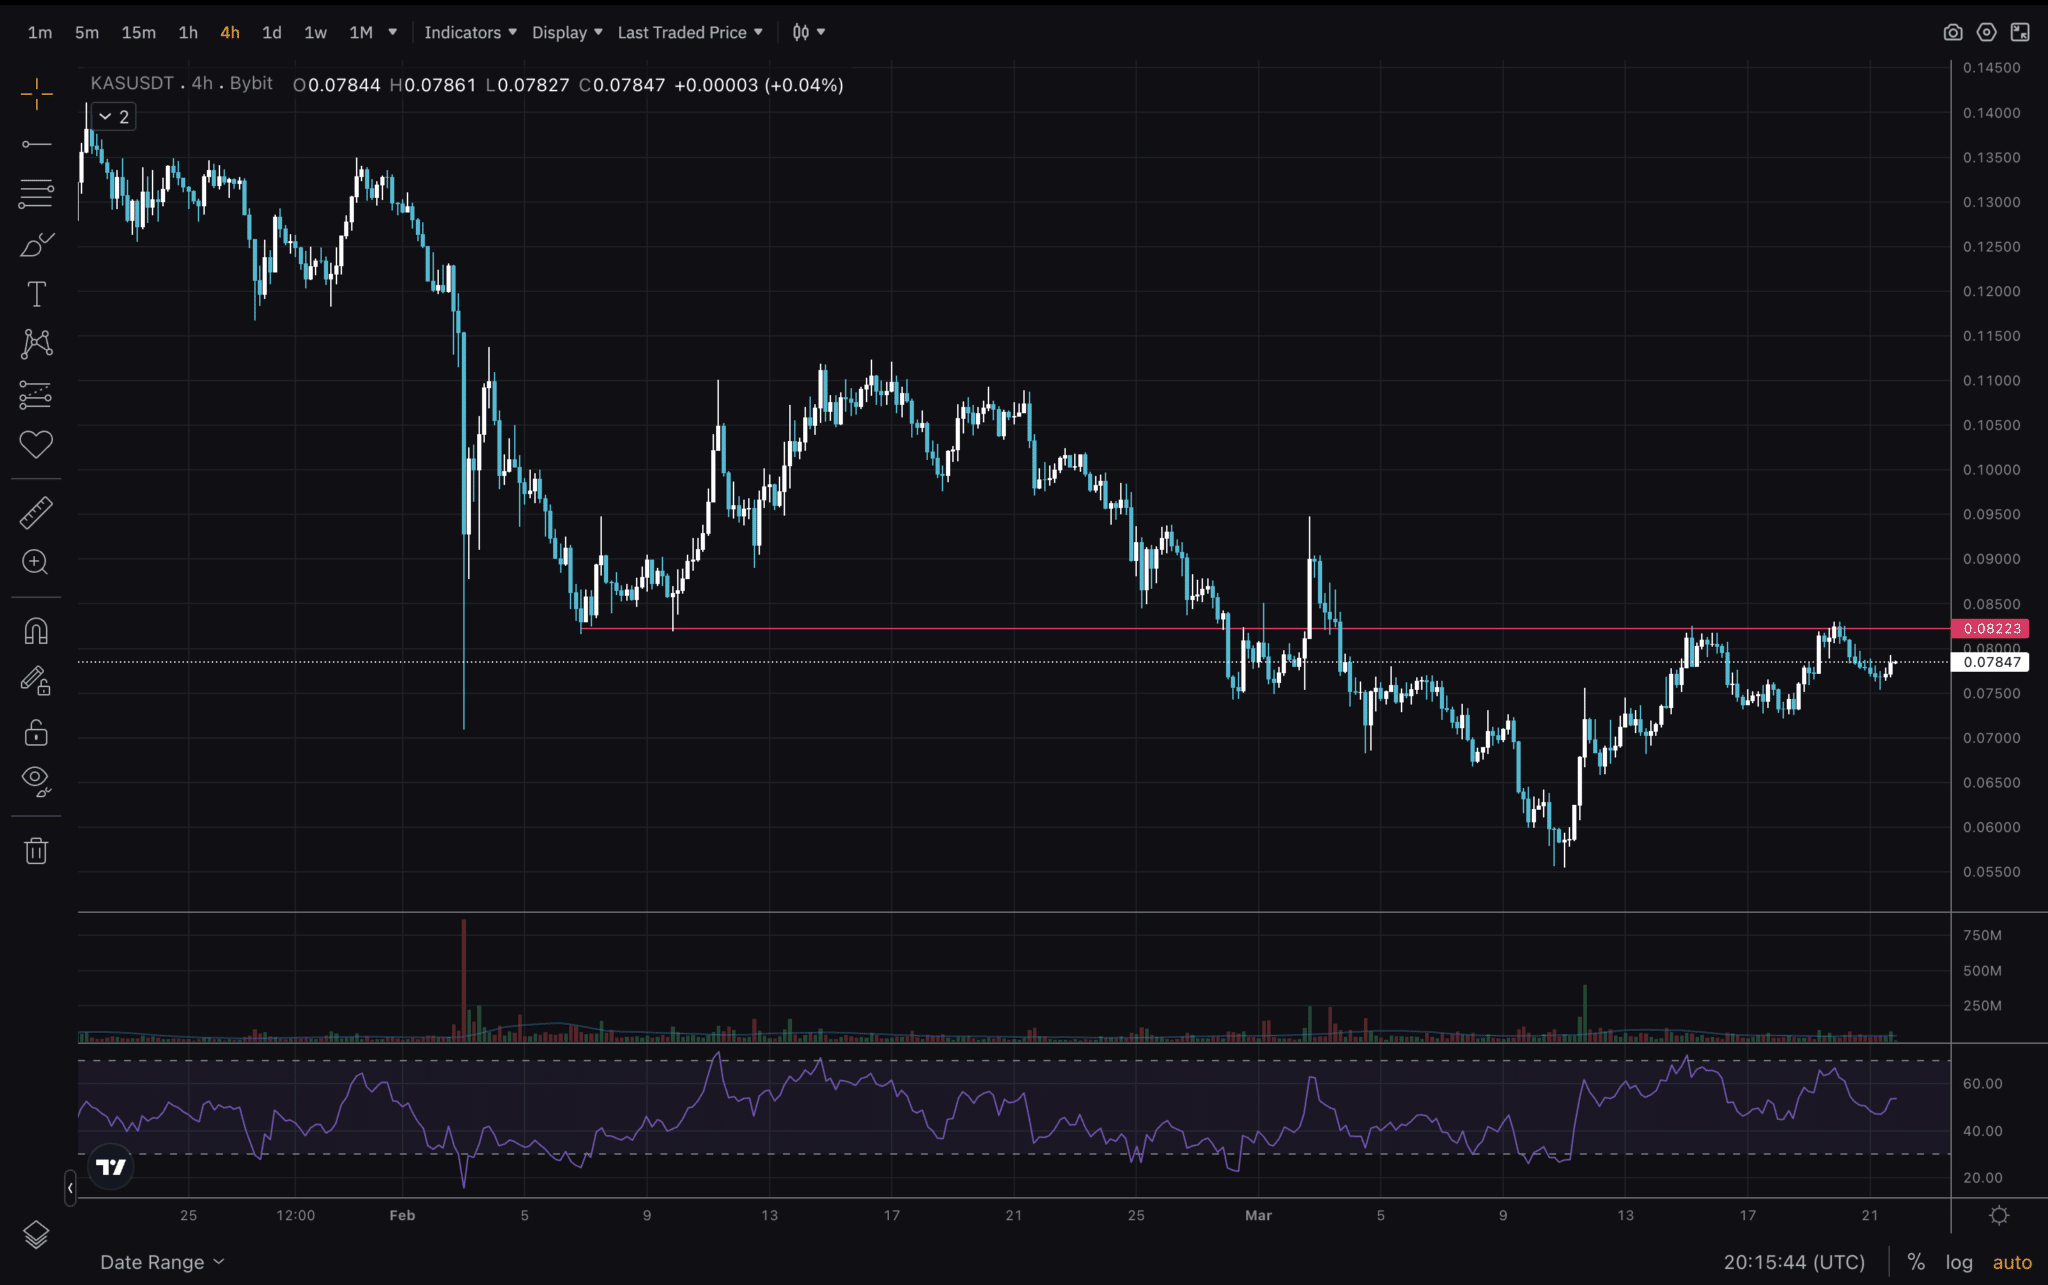
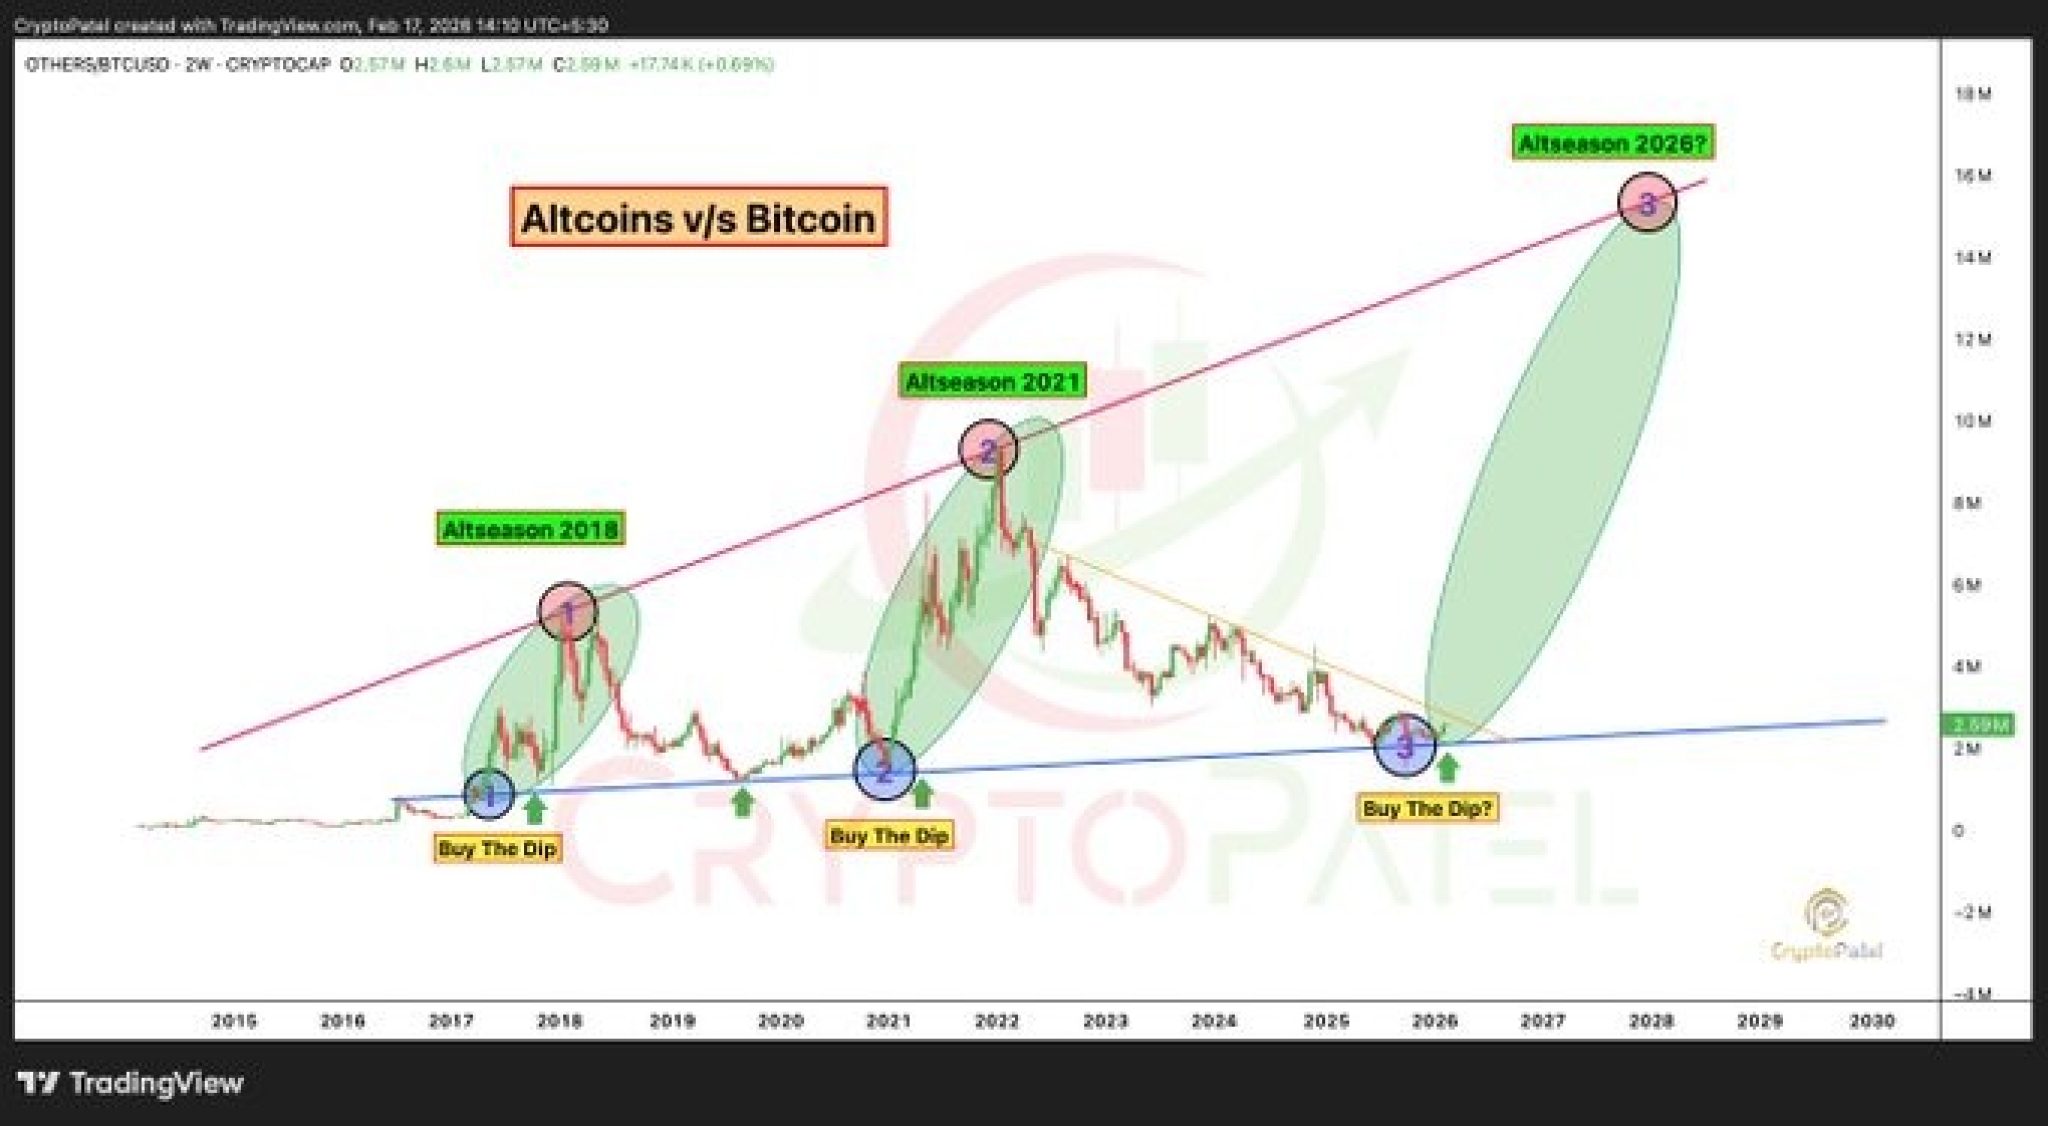
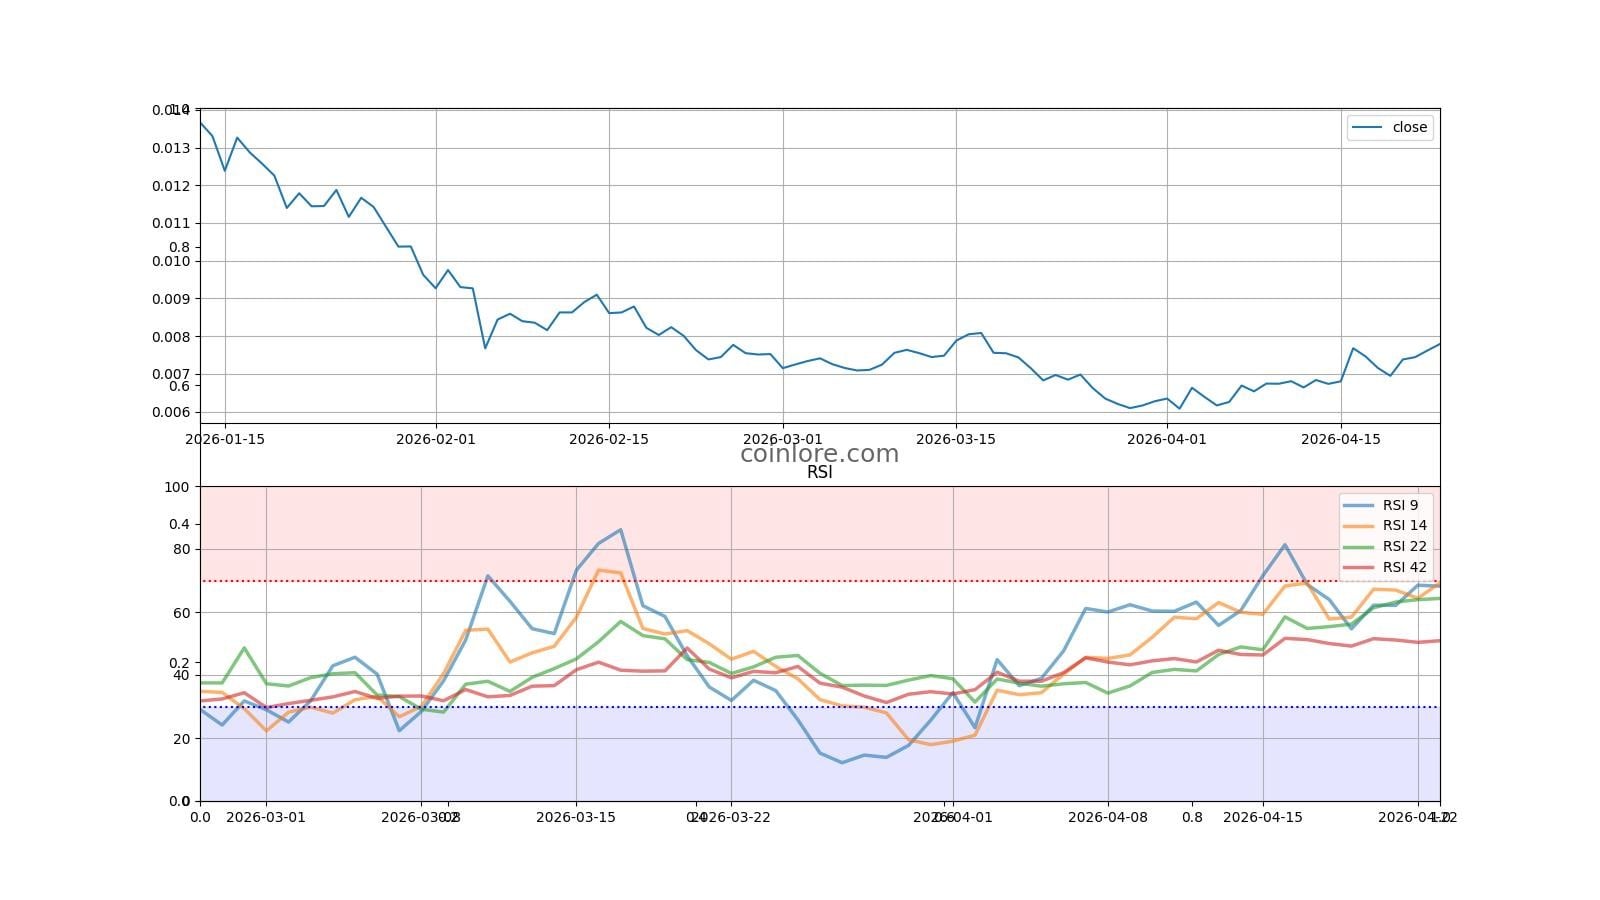
Reading an altcoin chart involves interpreting price movements over time using candlestick patterns, volume indicators, and technical tools. It allows traders to identify trends, support/resistance levels, and potential entry or exit points for cryptocurrencies other than Bitcoin. By mastering these visual data points, you can navigate the volatile altcoin market with greater precision and professional risk management.
Understanding the Visual Language of Altcoin Charts
To the uninitiated, an altcoin chart looks like a chaotic series of red and green lines. However, for a seasoned trader in 2026, these charts are a visual representation of human psychology, supply, and demand. The primary goal of "reading" a chart is to filter out the "noise" of short-term volatility to find a high-probability "signal."
The Candlestick Anatomy
Most altcoin charts use Japanese Candlesticks. Unlike a simple line chart that only shows the closing price, a candlestick provides four critical pieces of data for a specific period:
- Open: The price at which the period began.
- Close: The price at which the period ended.
- High: The highest price reached during the period.
- Low: The lowest price reached during the period.
The "body" of the candle represents the range between the open and close. If the close is higher than the open, the candle is typically green (bullish). If it is lower, the candle is red (bearish). The thin lines sticking out of the top and bottom are called wicks or shadows. These are vital for altcoins because they represent price rejection. A long upper wick suggests that sellers pushed the price back down, while a long lower wick suggests buyers stepped in to support the price.
Timeframes and Their Strategic Importance
Choosing the right timeframe is the first decision a trader makes. In 2026, with the high frequency of automated trading, timeframes are generally categorized into three tiers:
- Short-term (1m, 5m, 15m): Used by scalpers. These charts are incredibly noisy and are used to catch small price fluctuations.
- Medium-term (1h, 4h): The "bread and butter" for day traders and swing traders. The 4-hour chart is often considered the most reliable for identifying local trend shifts.
- Long-term (1D, 1W, 1M): Used by "HODLers" and macro investors. A trend on a weekly chart is much more significant than a trend on a 15-minute chart.
Essential Technical Indicators for Altcoin Analysis
Technical indicators are mathematical calculations based on price and volume. They help confirm trends and predict potential reversals. While there are hundreds of indicators available on platforms like TradingView, focusing on a few core tools is more effective than cluttering your workspace.
Relative Strength Index (RSI)
The RSI is an "oscillator" that measures the speed and change of price movements. It ranges from 0 to 100.
- Overbought (>70): Suggests the altcoin may be primed for a correction or "cool down."
- Oversold (<30): Suggests the altcoin may be undervalued in the short term and could see a bounce. In the context of altcoins, RSI can stay overbought for a long time during a parabolic run, so it should never be used in isolation.
Moving Averages (MA and EMA)
Moving averages smooth out price data to create a single flowing line, making it easier to identify the trend direction.
- SMA (Simple Moving Average): Calculates the average price over a set number of periods.
- EMA (Exponential Moving Average): Gives more weight to recent prices, making it more responsive to new information. Traders often watch for the Golden Cross (when a short-term MA crosses above a long-term MA) as a bullish signal, and the Death Cross (short-term crossing below long-term) as a bearish signal.
Moving Average Convergence Divergence (MACD)
The MACD shows the relationship between two moving averages of an asset’s price. It consists of the MACD line, the signal line, and a histogram. When the MACD line crosses above the signal line, it is a bullish indicator. Conversely, a cross below the signal line suggests bearish momentum. The histogram identifies the strength of the move; if the bars are getting taller, the momentum is accelerating.
Identifying Support, Resistance, and Trendlines
Support and resistance are the "floors" and "ceilings" of the market. Identifying these levels is the most fundamental aspect of altcoin chart explanation.
Support Levels
Support is a price level where a downtrend tends to pause due to a concentration of demand (buying power). When the price of an altcoin drops toward support, buyers become more inclined to buy, and sellers become less inclined to sell. In 2026, many support levels are established by institutional "limit orders" placed at psychological numbers (e.g., $1.00, $10.00, $100.00).
Resistance Levels
Resistance is the opposite: a price level where an uptrend tends to pause due to a concentration of supply (selling power). It is the "ceiling" that price struggles to break through. If an altcoin breaks through a resistance level, that level often flips and becomes the new support.
Drawing Trendlines
Trendlines are diagonal lines drawn across the "highs" or "lows" of price action.
- An uptrend line is drawn by connecting at least two major lows (higher lows).
- A downtrend line is drawn by connecting at least two major highs (lower highs). A "breakout" occurs when the price decisively closes on the other side of a trendline, often signaling a major shift in market sentiment.
The Crucial Role of Trading Volume and Liquidity
Volume represents the total amount of an altcoin traded during a specific period. It is often displayed as a bar chart at the bottom of the price chart.
Volume is the "fuel" of the market. A price move on high volume is considered significant and likely to continue. A price move on low volume is often a "fakeout" or a "trap" because it indicates a lack of conviction from the broader market. For altcoins with lower market caps, volume is especially critical because low liquidity can lead to slippage, where your order is executed at a much different price than expected.
| Indicator Type | Common Example | Purpose | Primary Signal |
|---|---|---|---|
| Trend | Moving Average (EMA) | Identify market direction | Price above EMA is bullish |
| Momentum | RSI | Measure move strength | Over 70 is overbought |
| Volatility | Bollinger Bands | Measure price range | Touching outer bands suggests extremes |
| Volume | Volume Bars | Confirm price moves | High volume confirms breakouts |
| Reversal | MACD | Spot trend shifts | Crossover of signal lines |
Trading Altcoins Against Bitcoin (The BTC Pair)
A common mistake for beginners is only looking at altcoin charts against the US Dollar (e.g., ETH/USD). However, to truly understand if an altcoin is "performing well," you must look at its chart against Bitcoin (e.g., ETH/BTC).
Bitcoin is the "reserve currency" of the crypto market. If an altcoin is rising against the Dollar but falling against Bitcoin, you would have been better off just holding Bitcoin. Professional traders use the Bitcoin Dominance (BTC.D) chart to determine when "Altcoin Season" is starting. When BTC Dominance falls and the ETH/BTC pair rises, it usually signals a period where altcoins will outperform Bitcoin across the board.
Common Charting Mistakes to Avoid in 2026
Even with the advanced AI-driven charting tools available in 2026, human error remains the leading cause of trading losses.
- Over-complicating Charts: Adding too many indicators (the "spaghetti" effect) leads to analysis paralysis. Usually, two or three indicators are enough to confirm a thesis.
- Ignoring the Higher Timeframe: A "bullish" pattern on a 5-minute chart can be easily crushed if the daily chart is in a massive downtrend. Always check the "big picture" first.
- Chasing Parabolic Moves: When a chart looks like a vertical line, the RSI is likely at 90+, and the "FOMO" (Fear Of Missing Out) is high. This is historically the worst time to enter a trade.
- Neglecting Fundamental News: No matter how perfect a chart pattern looks, a major regulatory announcement or a smart contract hack will override technical analysis instantly.
Step-by-Step: How to Analyze an Altcoin Chart
To put this "altcoin chart explained" guide into practice, follow this logical sequence:
- Select the Pair: Open your charting software and choose your asset (e.g., SOL/USD or SOL/BTC).
- Determine the Macro Trend: Look at the Daily (1D) or Weekly (1W) chart. Is the price making higher highs and higher lows? If yes, the trend is bullish.
- Draw Support and Resistance: Identify the horizontal levels where the price has reacted multiple times in the past.
- Check Indicators: Look at the RSI for overbought/oversold conditions and the MACD for momentum shifts.
- Evaluate Volume: Ensure the recent price action is supported by rising or consistent volume.
- Identify a Pattern: Look for triangles, flags, or "head and shoulders" patterns that suggest the next likely move.
- Set Your Risk: Before entering, decide where your "Stop Loss" will be (usually just below a support level) and where your "Take Profit" target is.
Frequently Asked Questions
What is the best timeframe for reading altcoin charts? There is no single "best" timeframe, as it depends on your trading style. Long-term investors should prioritize the Daily and Weekly charts to avoid daily "noise." Day traders typically use the 1-hour and 4-hour charts to find entries. Always use "multi-timeframe analysis" by checking a higher timeframe before zooming in to a lower one.
Why does my altcoin chart look different on different exchanges? Price and volume data are specific to the exchange where the trading occurs (e.g., Binance vs. Coinbase). While arbitrage bots usually keep prices very close, minor discrepancies in wicks and volume bars can occur. It is best to use the chart from the exchange where you intend to execute your trade for the most accurate data.
Can technical analysis (TA) guaranteed profits in altcoins? No. Technical analysis is about probability, not certainty. It helps you identify setups where the odds of success are higher than a coin flip. In the highly volatile altcoin market, unexpected events (Black Swan events) can invalidate any chart pattern instantly.
What does a "Death Cross" mean on an altcoin chart? A Death Cross occurs when a short-term moving average (typically the 50-day) crosses below a long-term moving average (the 200-day). It is a lagging indicator, meaning the price has already been dropping, but it is often seen as a signal that a long-term bear market has begun for that specific altcoin.
Should I use Logarithmic or Linear scales? For altcoins, which can grow by 1,000% or drop by 90%, a Logarithmic (Log) scale is often better for long-term charts. It displays price moves based on percentage changes rather than absolute dollar amounts, which provides a clearer view of growth patterns over several years.
Final Recommendation for Readers
As you apply this knowledge in 2026, remember that charting is a skill developed through screen time. Start by "paper trading" (simulated trading without real money) to see how your interpretations of support, resistance, and indicators play out in real-time. Use a reliable aggregator like CoinMarketCap to verify project fundamentals alongside your technical analysis. Never risk more than a small percentage of your portfolio on a single altcoin trade, regardless of how "perfect" the chart looks.