The 2017 workers compensation US statistics reflect a period of sustained premium rate declines, moderate medical cost inflation, and steady injury frequency trends across the American workforce, providing critical benchmarks for occupational safety researchers, insurance underwriters, and labor economists.
Analyzing historical data from the United States workers' compensation system requires examining multiple intersecting domains, including employer costs, workplace injury frequencies, medical inflation rates, and state-level regulatory changes. For researchers, actuaries, and human resources professionals, the year 2017 stands out as a stabilization period following years of legislative reforms and economic adjustments in the wake of the 2008 financial crisis. Understanding the metrics recorded during this period helps stakeholders contextualize long-term trends in occupational health, insurance pricing structures, and employer liability management.
Macroeconomic Overview of Workers Compensation in 2017
To understand the 2017 workers compensation US statistics, one must examine the broader macroeconomic climate. The United States experienced steady gross domestic product (GDP) growth and a decreasing national unemployment rate throughout 2017, hovering around 4.1% by the end of the year. Increased employment across construction, manufacturing, and service sectors naturally expanded the overall payroll base exposed to workplace risks.
Despite an expanding labor pool, workers' compensation net written premiums experienced downward pressure. According to data compiled by the National Council on Compensation Insurance (NCCI) and the Insurance Information Institute (Triple-I), advisory loss costs and filed premium rates generally decreased across a majority of U.S. states. This downward trend was driven by compounding factors:
- Consistently declining injury frequency rates over the preceding decade.
- Favorable investment returns for insurance carriers, which offset underwriting margins.
- Legislative reforms in several high-litigation states that capped attorney fees or restricted medical fee schedules.
Employers benefited from these competitive market conditions, seeing their average cost per insured payroll dollar drop compared to the early 2010s. However, statutory benefits paid to injured workers continued to rise incrementally to adjust for wage growth and legislative mandates, creating a nuanced financial environment where lower rates did not necessarily translate to diminished total system costs for every individual enterprise.
Workplace Injury and Fatality Metrics
The Bureau of Labor Statistics (BLS), through its Census of Fatal Occupational Injuries (CFOI) and the Survey of Occupational Injuries and Illnesses (SOII), provided the primary empirical foundation for 2017 injury metrics.
Non-Fatal Injuries and Illnesses
In 2017, private industry employers reported approximately 2.8 million non-fatal workplace injuries and illnesses, a rate essentially unchanged from the previous year at 2.8 cases per 100 equivalent full-time workers. Within this total:
- Industry Sector Disparities: Trade, transportation, and utilities, along with health care and social assistance, accounted for the highest absolute numbers of non-fatal injuries.
- Days Away From Work (DAFW): The incidence rate for cases requiring days away from work remained stable at 89.4 per 10,000 full-time workers. Musculoskeletal disorders (MSDs)—often categorized as sprains, strains, and tears resulting from overexertion or bodily reaction—remained the leading category of lost-time injuries.
Fatal Occupational Injuries
The 2017 CFOI recorded 5,147 fatal work injuries across the United States, representing a slight increase from 2016. The fatal work injury rate was 3.5 per 100,000 full-time equivalent workers. Key characteristics of these fatalities included:
- Transportation Incidents: Transportation incidents remained the leading cause of fatal occupational injuries, accounting for nearly 40% of all work-related deaths.
- High-Risk Sectors: Agriculture, forestry, fishing, and hunting, alongside construction and extraction occupations, recorded the highest fatality rates per capita.
- Violence and Injuries by Persons or Animals: Workplace homicides and suicides showed concerning upward trajectories in specific service and retail sectors, highlighting non-traditional occupational hazards.
| Year / Metric Category | 2017 Total / Rate | Primary Driver or Affected Sector |
|---|---|---|
| Total Fatal Occupational Injuries | 5,147 deaths | Transportation incidents leading cause (approx. 40%) |
| Fatal Injury Rate | 3.5 per 100,000 workers | Highest in agriculture, forestry, and construction |
| Non-Fatal Injuries & Illnesses | 2.8 million cases | Trade, transportation, and utilities sectors |
| Median Days Away From Work | 8 days | Musculoskeletal disorders and overexertion |
| NCCI Average Rate Trend | Decreasing (-3% to -7%) | Favorable loss experience and state reforms |
Medical Cost Containment and Indemnity Trends
The financial health of the workers' compensation system depends heavily on medical cost inflation and indemnity (wage replacement) payments. In 2017, medical costs represented roughly 50% to 55% of total benefit payments nationwide, with the remainder allocated to indemnity benefits.
Medical Cost Drivers
While general consumer price inflation remained low, medical inflation within workers' compensation faced unique pressures. Advanced diagnostic imaging, specialized orthopedic interventions, and long-term pharmaceutical management for chronic pain represented significant cost centers. However, medical severity growth moderated in 2017 due to several structural defenses:
- Fee Schedules: A majority of states maintained strict statutory fee schedules that capped physician and hospital reimbursements at predetermined percentages of Medicare or usual-and-customary rates.
- Utilization Review: Payer-mandated utilization reviews and evidence-based treatment guidelines helped curb unnecessary surgical interventions and prolonged physical therapy regimens.
- Prescription Drug Monitoring: Increased scrutiny on opioid prescribing practices—accelerated by state prescription drug monitoring programs (PDMPs)—significantly reduced opioid utilization frequency and associated expenditures in workers' compensation claims.
Indemnity Benefit Structures
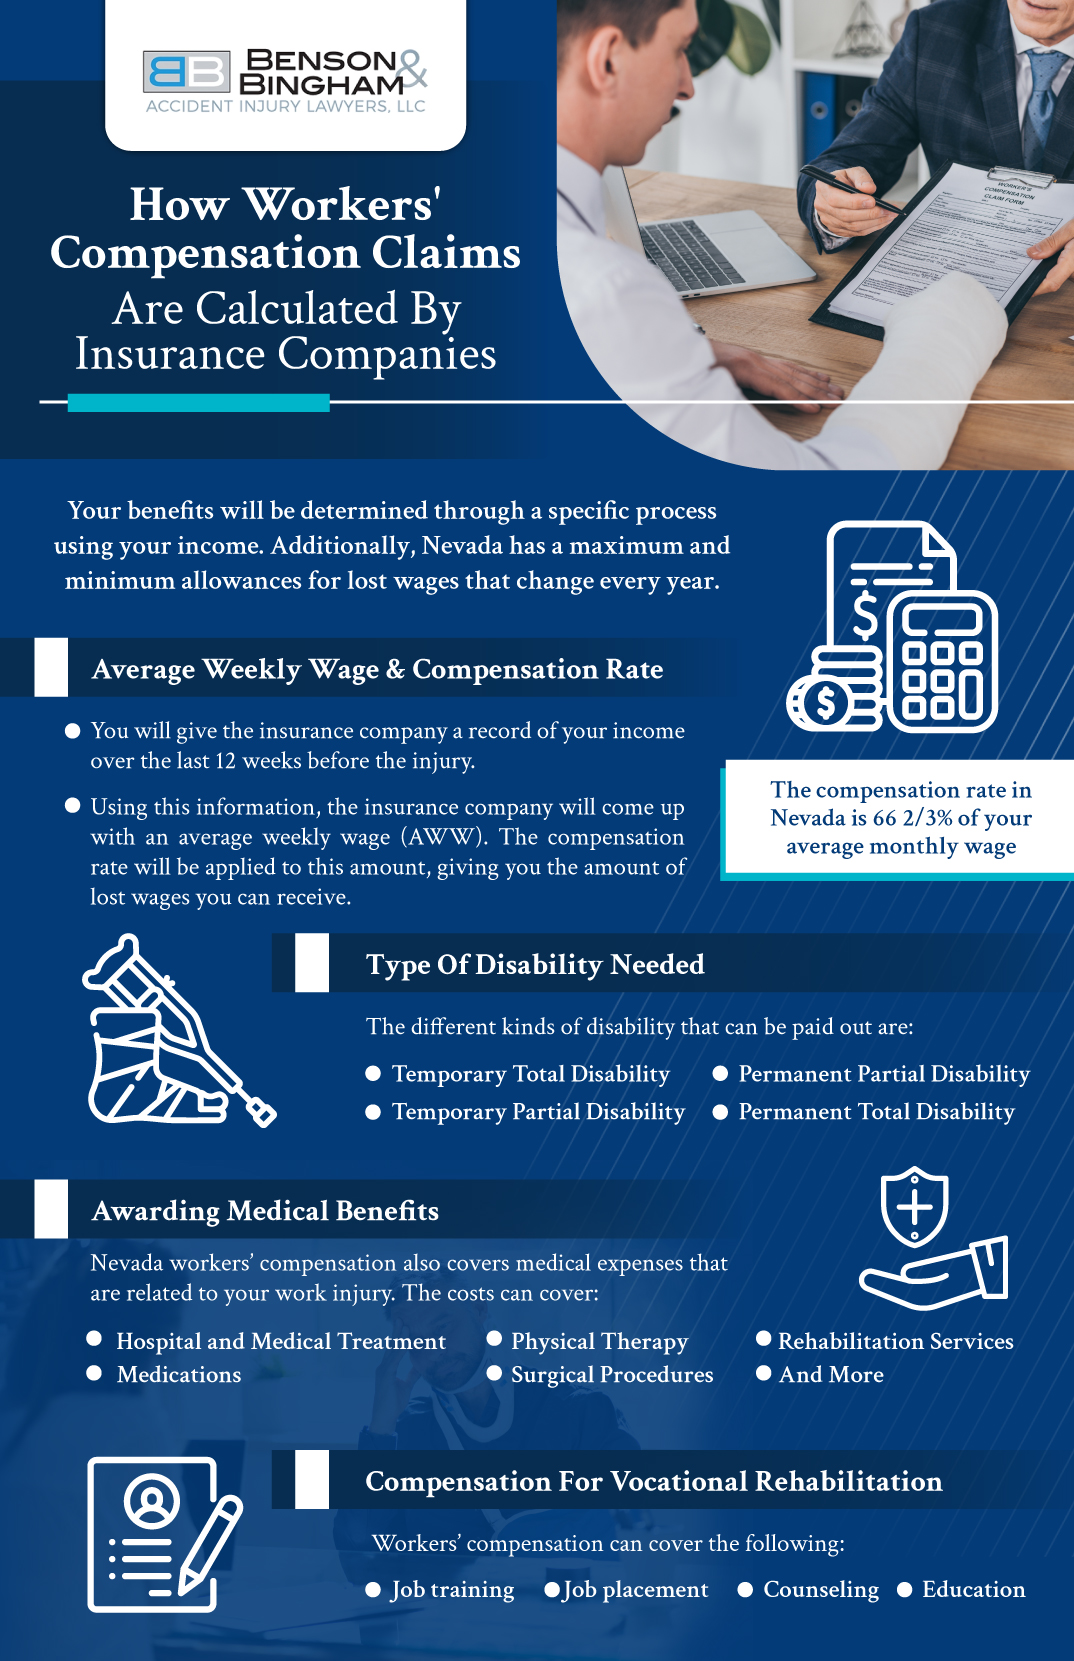
Indemnity benefits in 2017 were governed by distinct state statutory formulas, typically calculated as a percentage (often two-thirds) of the injured worker’s average weekly wage, subject to state-mandated maximum and minimum caps.
- Temporary Total Disability (TTD): Utilized while the worker was recovering and unable to perform any work.
- Permanent Partial Disability (PPD): Comprised the largest share of indemnity costs, accounting for disputes regarding impairment ratings and return-to-work accommodations.
Regional and State-Level Variations
Because the United States does not maintain a single federal workers' compensation program for private industry (outside of specialized jurisdictions like the Federal Employees' Compensation Act or the Longshore and Harbor Workers' Compensation Act), 2017 statistics varied drastically by state.
States with robust manufacturing and resource-extraction economies often experienced different loss-cost dynamics compared to service-oriented states. For instance, jurisdictions like California implemented sweeping regulatory changes throughout the 2010s—such as independent medical review (IMR) systems—which drastically reduced litigation rates and stabilized premium costs by 2017. Conversely, states with high medical utilization rates or expansive legal definitions of compensability saw persistent upward pressure on employer costs, prompting ongoing legislative debate.
Frequently Asked Questions
What were the primary causes of workplace injuries in 2017 according to federal statistics?
Overexertion and bodily reaction (such as lifting, pushing, or bending), slips, trips, and falls, and contact with objects and equipment were the leading causes of non-fatal injuries requiring days away from work in 2017.
How did workers' compensation premium rates trend across the United States in 2017?
Workers' compensation advisory loss costs and filed premium rates trended downward across most U.S. states in 2017. This was driven by a combination of declining injury frequencies, favorable reserve development by insurance carriers, and state-level legislative reforms.
What percentage of workers' compensation payouts went toward medical care versus wage replacement in 2017?
Medical expenses consistently accounted for approximately 50% to 55% of total system benefit payments, with indemnity (wage replacement and disability) benefits making up the remaining 45% to 50%, varying by state jurisdiction.
Did workplace fatalities increase or decrease in 2017 compared to prior years?
The Bureau of Labor Statistics reported 5,147 fatal work injuries in 2017, representing a slight increase from the 5,190 recorded in 2016, keeping the overall fatal injury rate relatively stable at 3.5 per 100,000 full-time workers.
What impact did prescription drug trends have on workers' compensation in 2017?
In 2017, workers' compensation systems experienced positive results from aggressive opioid management and utilization reviews. Stricter formularies and prescription drug monitoring programs led to a notable reduction in total pharmaceutical expenditures and opioid dependency rates within claims.
Practical Next Steps for Data Analysis and Research
When utilizing historical 2017 workers compensation US statistics for compliance benchmarking, academic research, or financial auditing, ensure you reference primary datasets from the U.S. Bureau of Labor Statistics (BLS) and the National Council on Compensation Insurance (NCCI). Cross-reference national aggregate figures with specific state-level insurance commissioner reports to account for regional legal frameworks and localized wage variations.