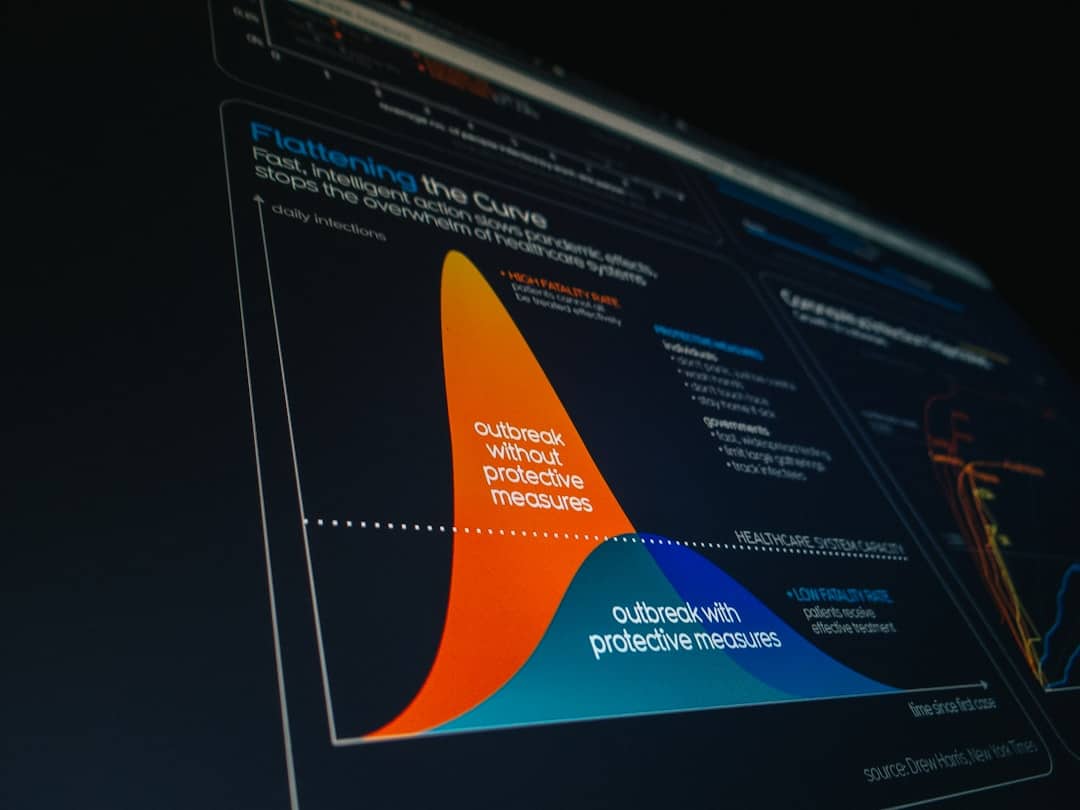
Advanced metrics drive proactive decision making by shifting organizational focus from retrospective reporting to predictive modeling, enabling leaders to anticipate market changes, operational bottlenecks, and financial risks before they impact performance. By leveraging predictive indicators, statistical modeling, and real-time data streams, decision-makers transition from reactive firefighting to strategic orchestration.
The Evolution from Reactive Reporting to Proactive Foresight
Traditional business intelligence relies heavily on lagging indicators—metrics that measure outcomes after an event has already occurred. Financial reports, quarterly revenue figures, and historical customer churn rates tell the story of where an organization has been, but they offer little insight into where it is heading. Relying entirely on these historical artifacts forces leaders into a reactive posture, where strategy is crafted in response to damage control rather than future preparation.
Proactive decision-making requires a structural evolution toward leading indicators and advanced analytical frameworks. Leading indicators are predictive metrics that signal future performance trends, allowing teams to intervene before problems fully manifest. For example, tracking customer support ticket resolution velocity and software error rates provides early warnings about customer dissatisfaction long before subscription cancellations spike. Adopting this mindset demands a cultural shift across departments, where teams are incentivized to optimize for future outcomes rather than merely hitting past benchmarks.
Furthermore, the integration of advanced metrics requires moving past simple descriptive analytics—which merely summarize data—toward diagnostic, predictive, and prescriptive analytics. Diagnostic metrics explain why something happened by uncovering hidden correlations. Predictive metrics forecast what is likely to happen based on historical patterns and current trajectory modeling. Prescriptive metrics take the final step by recommending how to act on those predictions. Mastering this hierarchy transforms data architectures from passive filing cabinets into active navigation systems.
Defining Core Pillars of Advanced Analytical Frameworks
Building an ecosystem capable of proactive decision-making requires robust foundational pillars. Organizations cannot successfully implement advanced metrics without clean data ingestion pipelines, sophisticated statistical models, and clear alignment between analytical outputs and business goals.
- Data Ingestion & Hygiene
- Real-Time Streams, APIs, Data Warehouse Storage
- Statistical Modeling & Algorithms
- Machine Learning, Regression, Trend Analysis
- Predictive & Prescriptive Metrics
- Customer Health Score, Risk Exposure Index, Velocity
- Proactive Organizational Action
- Automated Alerts, Strategic Pivots, Resource Shift
Data Hygiene and Real-Time Ingestion
Garbage in equates to garbage out, particularly when predictive algorithms attempt to project future trends based on contaminated inputs. Advanced metrics demand pristine data hygiene, encompassing deduplication, normalization, and consistent taxonomy across enterprise resource planning (ERP) and customer relationship management (CRM) systems. Real-time streaming architectures—powered by technologies like Apache Kafka or cloud-native data warehouses—ensure that metrics reflect the current operational reality rather than yesterday's batch upload.
Statistical Modeling and Machine Learning Integration
To transition from viewing simple charts to leveraging advanced metrics, organizations must incorporate machine learning models capable of handling multivariate complexity. Linear regressions, decision trees, and neural networks uncover non-linear relationships that human analysts might miss. For instance, supply chain leaders can use predictive algorithms to model weather patterns, geopolitical tensions, and supplier financial health simultaneously, generating a composite vulnerability index that prompts rerouting weeks before a disruption occurs.
Key Categories of Advanced Metrics
Different functional domains require specialized advanced metrics to forecast operational health and market positioning effectively. Deploying the correct metrics prevents metric fatigue and ensures that decision-makers focus on high-impact signals.
| Metric Category | Primary Objective | Example Metric | Proactive Application |
|---|---|---|---|
| Customer Success | Forecast retention and lifetime value | Customer Health Score (CHS) | Triggering targeted account management interventions before renewal discussions begin. |
| Operational Efficiency | Anticipate system failures and bottlenecks | Mean Time Between Failures (MTBF) & Asset Wear Index | Scheduling preventative maintenance before costly equipment breakdowns occur. |
| Financial Risk | Model cash flow variance and liquidity crunches | Days Sales Outstanding (DSO) Trend & Burn Multiple | Adjusting credit terms or securing lines of credit ahead of seasonal revenue dips. |
| Product Development | Predict feature adoption and user drop-off | Feature Engagement Velocity | Reallocating engineering sprints to refine underperforming user flows before churn rises. |
Customer Health Scores (CHS)
Traditional metrics like Net Promoter Score (NPS) are periodic surveys that capture sentiment at a single moment in time. Conversely, a comprehensive Customer Health Score aggregates behavioral data—such as login frequency, feature utilization breadth, support ticket volume, and billing history—into a single dynamic metric. By monitoring the velocity of changes in a customer's health score, account teams can proactively reach out to accounts showing early signs of disengagement, drastically reducing involuntary churn.
Operational Asset Wear Index
In manufacturing, logistics, and IT infrastructure, waiting for equipment or servers to fail incurs catastrophic downtime costs. Advanced metrics like the Asset Wear Index combine operational hours, stress loads, thermal fluctuations, and historical failure rates to quantify the remaining useful life of machinery. Maintenance crews can then service components during scheduled windows, ensuring continuous operational flow and maximizing capital asset ROI.
Implementing Proactive Workflows in the Enterprise
Deploying advanced metrics is a technical challenge, but embedding them into daily decision-making workflows is primarily an organizational change management challenge. Leaders must deliberately bridge the gap between data scientists and business operators.
Establishing Cross-Functional Data Governance
Data silos destroy the efficacy of advanced metrics. A marketing predictive model cannot accurately forecast customer lifetime value if it lacks visibility into product usage metrics or customer support friction. Establishing a cross-functional data governance committee ensures that metric definitions are standardized across departments, eliminating semantic disputes during executive meetings.
Designing Actionable Alerting Mechanisms
Proactivity relies on speed. When an advanced metric breaches a pre-determined predictive threshold, the system should automatically notify the relevant stakeholder or trigger an automated workflow. For example, if a supply chain lead-time predictive model indicates a 70% probability of a two-week shipping delay, the system can automatically generate purchase orders for secondary local suppliers or notify sales teams to adjust delivery expectations with enterprise clients.
Common Pitfalls and Mitigation Strategies
Organizations attempting to pivot toward advanced metrics often encounter predictable structural and psychological hurdles. Recognizing these traps prevents costly project failures.
- Metric Overload and Vanity Metrics: Tracking hundreds of complex metrics dilutes focus. Mitigation: Limit dashboards to a core set of actionable predictive drivers tied directly to strategic business objectives.
- Over-Reliance on Historical Continuity: Machine learning models trained exclusively on past data can fail catastrophically during unprecedented market shocks. Mitigation: Regularly stress-test models against hypothetical black swan scenarios and incorporate qualitative expert judgment.
- Lack of Interpretability (Black Box Problem): When predictive algorithms output a score without explaining the underlying drivers, operators hesitate to act. Mitigation: Prioritize explainable artificial intelligence (XAI) frameworks that surface feature importance weights alongside final predictions.
Frequently Asked Questions
What is the difference between lagging and leading metrics in decision making?
Lagging metrics measure the results of past actions, such as monthly revenue or quarterly profit margins. They confirm what happened but offer no guidance on how to change future outcomes. Leading metrics are predictive indicators that signal future trends—such as pipeline velocity or user engagement frequency—allowing leaders to intervene proactively before results are finalized.
How do advanced metrics improve risk management?
Advanced metrics enhance risk management by replacing static annual reviews with continuous, real-time monitoring. By analyzing multivariate data streams, predictive risk models quantify the probability of negative events—such as liquidity crunches, regulatory non-compliance, or supply chain bottlenecks—allowing organizations to mitigate exposures before they escalate into crises.
What organizational prerequisites are needed to implement predictive analytics?
Successful implementation requires clean, centralized data infrastructure (such as a modern data warehouse), clearly defined business objectives, cross-functional data governance, and analytical talent capable of building and interpreting statistical models. Crucially, leadership must foster a culture that trusts data-driven forecasts over intuition.
How can small and medium-sized enterprises (SMEs) adopt advanced metrics without massive budgets?
SMEs can leverage modern SaaS business intelligence platforms, cloud-native data connectors, and pre-built machine learning modules within existing CRM and ERP systems. Rather than building custom data science pipelines from scratch, smaller organizations should focus on optimizing two or three high-impact predictive metrics, such as customer acquisition cost payback period or inventory turnover velocity.
Practical Next Steps for Leadership
To successfully harness advanced metrics for proactive decision making, executive leadership should initiate a comprehensive audit of current dashboard portfolios. Discard vanity metrics and historical reports that fail to inspire direct action. Identify two critical business processes—such as customer retention or supply chain inventory management—and replace lagging KPIs with predictive indicators within the next quarter. Invest in upskilling operational managers so they can interpret statistical forecasts with confidence, ensuring that data investments translate directly into strategic foresight and competitive advantage.