Forex volume indicators help traders interpret market activity by quantifying price movement intensity. Unlike centralized stock exchanges, the decentralized nature of the forex market means there is no single authoritative volume source. Consequently, traders use "tick volume"—the frequency of price updates within a specific timeframe—as a reliable proxy to gauge market liquidity, trend strength, and potential reversal points in their analysis.
Understanding the Decentralized Nature of Forex Volume
To effectively use volume indicators, one must first recognize that the forex market is an over-the-counter (OTC) market. Because there is no central clearinghouse, it is impossible to count the total number of currency units exchanged globally. Instead, brokers provide "tick volume." Every time a price change occurs—even by a fraction of a pip—it is recorded as one tick.
While not identical to actual trade volume (the number of contracts or lots exchanged), tick volume is highly correlated with actual transaction flow. Institutional traders often use high-frequency trading algorithms that cause frequent price updates during periods of high activity, which in turn spikes the tick volume. Understanding this distinction is the prerequisite for moving from price-only analysis to volume-weighted technical analysis.
The Role of Volume in Technical Analysis
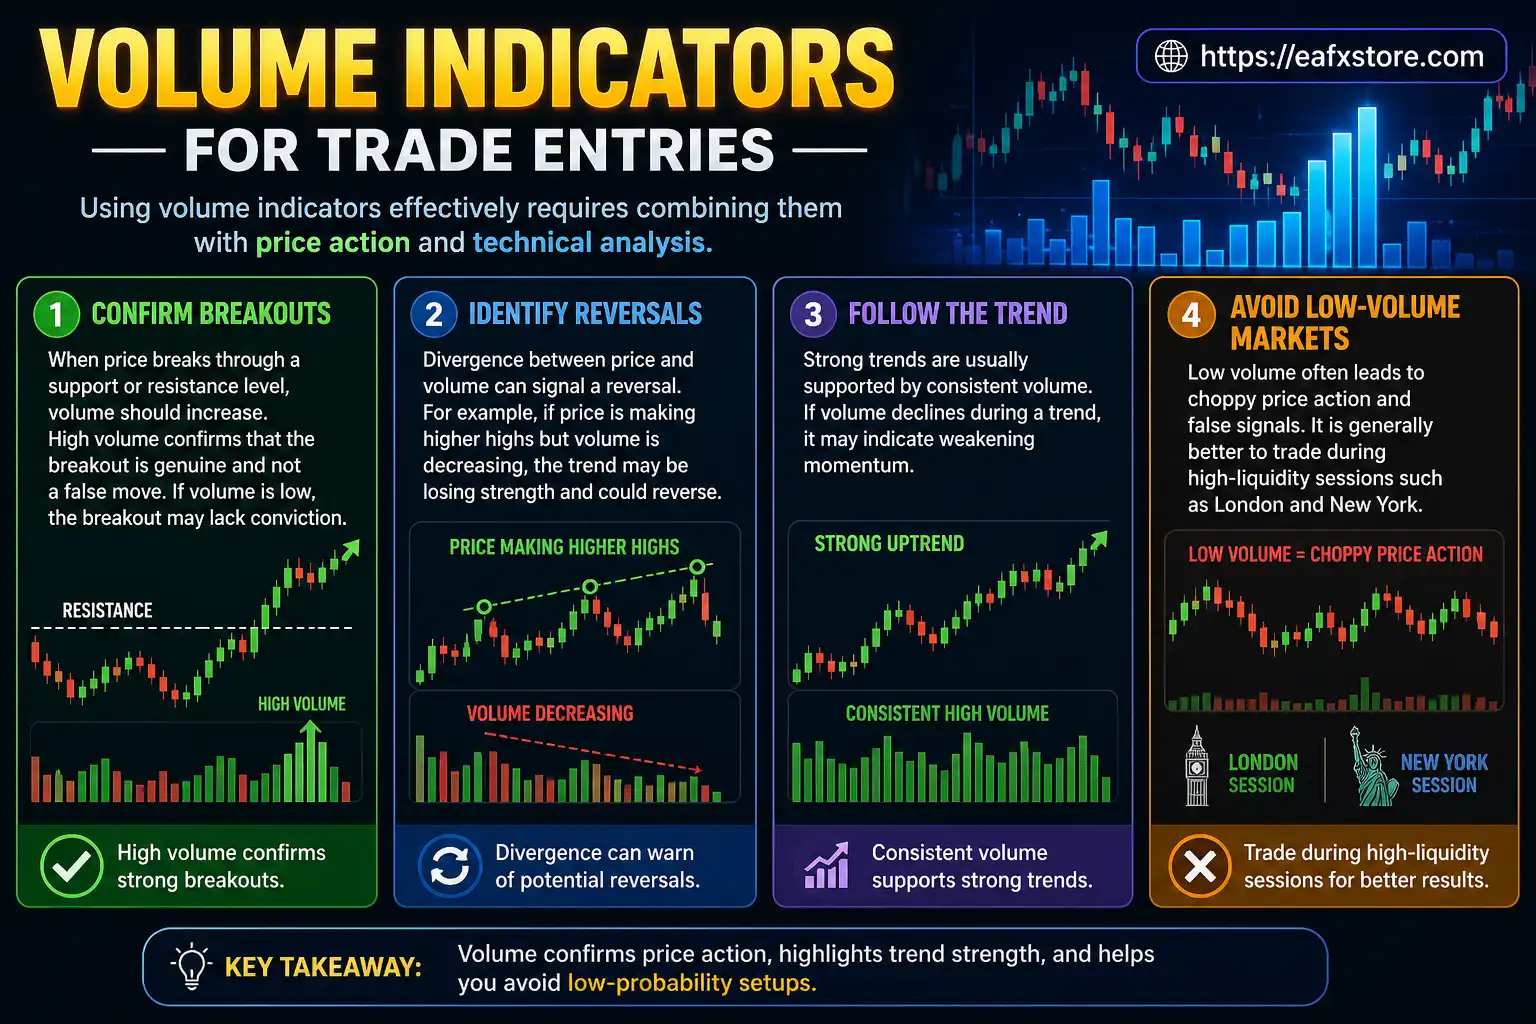
Volume acts as the "fuel" for price movements. In technical analysis, the core principle is that volume should confirm the trend. If a currency pair is breaking out of a consolidation pattern, increasing volume suggests that the move is supported by significant market participants, making it more likely to sustain. Conversely, a price move on low volume is often viewed with skepticism, as it may lack the institutional backing required to overcome resistance or support levels.
Traders use volume to filter out "false breakouts" or "whipsaws." When price hits a new high, a trader looking at volume indicators will check if the volume accompanying that new high is higher than the previous one. If it is lower, this is a divergence, suggesting that the buying interest is waning despite the rising price, often signaling an impending exhaustion or reversal.
Key Forex Volume Indicators Every Trader Should Know
1. On-Balance Volume (OBV)
The On-Balance Volume (OBV) indicator is a cumulative total of volume that tracks whether money is flowing into or out of a security. It works on the simple premise that volume precedes price.
- How it works: If today's closing price is higher than yesterday's, the volume for the day is added to the OBV total. If the price is lower, the volume is subtracted.
- Application: Traders look for trends in the OBV line. If the OBV is making higher highs while the price is stagnant, it often suggests that a breakout to the upside is coming, as "smart money" accumulates the position.
2. Volume-Weighted Average Price (VWAP)
While often categorized as a price-based indicator, VWAP incorporates volume into its calculation, making it a staple for day traders. It calculates the average price of an asset adjusted for the volume traded at each price level throughout the session.
- How it works: VWAP is calculated by summing the (Price × Volume) for each period and dividing by the total volume.
- Application: It serves as a dynamic benchmark. Prices trading above the VWAP are considered in a bullish trend, while prices below the VWAP are considered bearish.
3. Accumulation/Distribution Line (A/D)
The A/D line is more nuanced than OBV because it considers where the price closes within the day's high-low range.
- How it works: It measures the "Close Location Value." If a pair closes near its high, it is assigned a positive value. If it closes near its low, it is assigned a negative value.
- Application: This indicator is specifically designed to detect divergence. If the A/D line is falling while the currency price is rising, it indicates that the upward trend is being driven by price manipulation or lack of genuine institutional participation, suggesting a reversal.
4. Chaikin Money Flow (CMF)
Developed by Marc Chaikin, this indicator measures the amount of volume-weighted accumulation and distribution over a specific time period (usually 20 or 21 periods).
- How it works: It oscillates around a zero line. Values above zero indicate buying pressure, while values below zero indicate selling pressure.
- Application: It is excellent for confirming trend strength. A strong trend should be accompanied by CMF values consistently staying on the correct side of the zero line.
Comparison of Popular Volume Indicators
| Indicator | Primary Focus | Best For | Technical Complexity |
|---|---|---|---|
| OBV | Momentum/Trend | Identifying breakout precursors | Low |
| VWAP | Average Value | Intraday support/resistance | Medium |
| A/D Line | Distribution | Divergence detection | High |
| CMF | Buying Pressure | Trend strength confirmation | Medium |
Integrating Volume into Your Trading Strategy
Integrating these tools requires discipline. A common mistake is using volume indicators in isolation. Volume is a secondary confirmation tool; it is rarely a standalone entry signal.
Steps for effective integration:
- Identify the trend: Use moving averages or price action (trendlines) to establish the primary market direction.
- Wait for a catalyst: Observe price approaching a key support or resistance zone.
- Confirm with volume: Check the chosen volume indicator (e.g., OBV) for a spike or divergence. If the volume confirms the price action at the key level, the probability of the trade succeeding increases.
- Manage risk: Always place a stop-loss based on price volatility (ATR), not volume. Volume tells you "how much," but it does not dictate exactly where to place your financial safety net.
Common Pitfalls and Troubleshooting
The most frequent error traders face with volume indicators is over-optimization. Because forex volume is derived from broker-specific servers, the "volume" you see on your terminal may differ slightly from the volume on a major bank's terminal.
- Avoid "Volume Clutter": Do not use four different volume indicators at once. They often measure similar dynamics and will lead to analysis paralysis. Pick one (e.g., OBV for trend, VWAP for intraday levels) and master its specific nuances.
- Account for News Events: During high-impact news releases, volume spikes are common. These spikes can distort the indicator's readings. It is often prudent to avoid making trades based on volume indicators during major economic data releases, as the "noise" can lead to false signals.
- Broker Variance: If your broker provides very low-quality data, check if their tick volume is consistent. If you see erratic, unexplained gaps in volume, consider switching to a broker with a larger institutional client base for more reliable data representation.
Professional Advice Limitation
The indicators listed here are analytical tools designed to assist in decision-making and are not guarantees of future market performance. Forex trading involves significant risk, and the use of volume indicators does not eliminate the possibility of loss. Traders should practice these concepts in a demo environment to understand how their specific broker's data feeds translate into visual indicators before risking real capital.
Frequently Asked Questions
1. Why does my volume indicator look different from another trader's? Because the forex market is decentralized, brokers receive tick data from different liquidity providers. Therefore, two traders using different brokers may see slight variations in volume bars or indicators. Focus on the trend of the volume rather than the absolute value.
2. Is tick volume actually useful for forex? Yes, study after study in financial literature has demonstrated that tick volume has a high correlation coefficient with actual volume in major currency pairs. It serves as a statistically significant proxy for market participation.
3. Can volume indicators predict the future? No indicator can predict the future. They provide a quantitative look at past market behavior. The utility of volume indicators lies in identifying the strength behind current price movements, which helps in calculating the probability of a future move.
4. Which volume indicator is best for beginners? On-Balance Volume (OBV) is generally the best starting point due to its simplicity. It provides a binary view of whether volume is flowing into or out of a pair without requiring complex mathematical formulas.
5. Should I use volume indicators on a 1-minute chart? Volume indicators are highly sensitive on short timeframes like the 1-minute chart, where noise is high. They are typically more reliable on the 15-minute, 1-hour, or 4-hour charts, where institutional trends are more clearly defined.
Recommended Next Action
To refine your technical analysis, choose one of the indicators mentioned—preferably OBV—and apply it to your current chart setup for the next two weeks. Observe how it reacts during consolidation versus how it reacts during a breakout. Document your findings in a trading journal to see if the indicator provides genuine clarity to your entry and exit points, then adjust your strategy accordingly.