Alpha and Beta are fundamental metrics used to evaluate investment performance and risk relative to the broader market. Alpha measures the excess return of an investment compared to a benchmark, while Beta quantifies the sensitivity or systematic risk of a security in relation to market movements. Together, they form the bedrock of Modern Portfolio Theory (MPT).
Understanding these formulas is essential for investors, portfolio managers, and financial analysts who aim to balance risk and reward. In the current 2026 financial landscape, characterized by high-frequency trading and algorithmic modeling, these classic metrics remain the standard for determining whether a manager is truly adding value or simply riding market waves.
The Foundations of Risk-Adjusted Returns
In finance, the pursuit of profit is always tethered to the acceptance of risk. To differentiate between "lucky" returns and "skillful" returns, analysts use the Capital Asset Pricing Model (CAPM). This model assumes that the expected return of an asset is a function of the risk-free rate plus a premium for taking on market risk.
Within this framework, Beta represents the market risk you cannot diversify away, while Alpha represents the value added (or lost) by specific investment choices. As we navigate the complexities of the 2026 markets, distinguishing between these two is the primary task of any sophisticated performance attribution analysis.
Understanding the Beta Formula
Beta ($\beta$) is a measure of a security's volatility in relation to the overall market. It indicates how much the price of a specific asset is expected to move when the market index (usually the S&P 500 or a relevant sector benchmark) moves.
The Mathematical Formula for Beta
The most common way to calculate Beta is through a statistical process called linear regression. The formula is expressed as the covariance of the asset’s returns with the market’s returns, divided by the variance of the market’s returns over a specific period.
$$\beta_i = \frac{\text{Covariance}(R_i, R_m)}{\text{Variance}(R_m)}$$
Where:
- $R_i$: The return of the specific investment or stock.
- $R_m$: The return of the benchmark market index.
- Covariance: A measure of how the stock and the market move together.
- Variance: A measure of how far the market’s returns spread out from their average.
Interpreting Beta Values
- $\beta = 1.0$: The asset moves in perfect correlation with the market. If the market rises 10%, the asset is expected to rise 10%.
- $\beta > 1.0$: The asset is more volatile than the market. A Beta of 1.5 suggests the stock is 50% more volatile than the index. These are often "growth" stocks or companies in cyclical industries.
- $0 < \beta < 1.0$: The asset is less volatile than the market. Utility companies and "value" stocks often fall into this category.
- $\beta = 0$: The asset's returns are uncorrelated with the market. Cash or certain fixed-income instruments may exhibit near-zero Beta.
- $\beta < 0$ (Negative Beta): The asset moves in the opposite direction of the market. Historically, gold or certain inverse ETFs exhibit negative Beta during market crashes.
Why Beta Matters in Portfolio Construction
Beta is the primary tool for managing systematic risk—the risk that affects the entire market and cannot be eliminated through diversification. By calculating the weighted average Beta of all holdings, a portfolio manager can tailor a fund to match a client's risk tolerance. For instance, in a bearish 2026 outlook, a manager might rotate into low-Beta assets to protect capital from anticipated market drawdowns.
Understanding the Alpha Formula
Alpha ($\alpha$) is often referred to as "excess return." It represents the portion of an investment's return that is not explained by market movements (Beta). If an investment performs better than its Beta would suggest, it has positive Alpha.
Jensen’s Alpha Formula
The standard method for calculating Alpha is Jensen's Alpha, which is derived from the CAPM equation. It subtracts the "expected return" (based on risk) from the "actual return."
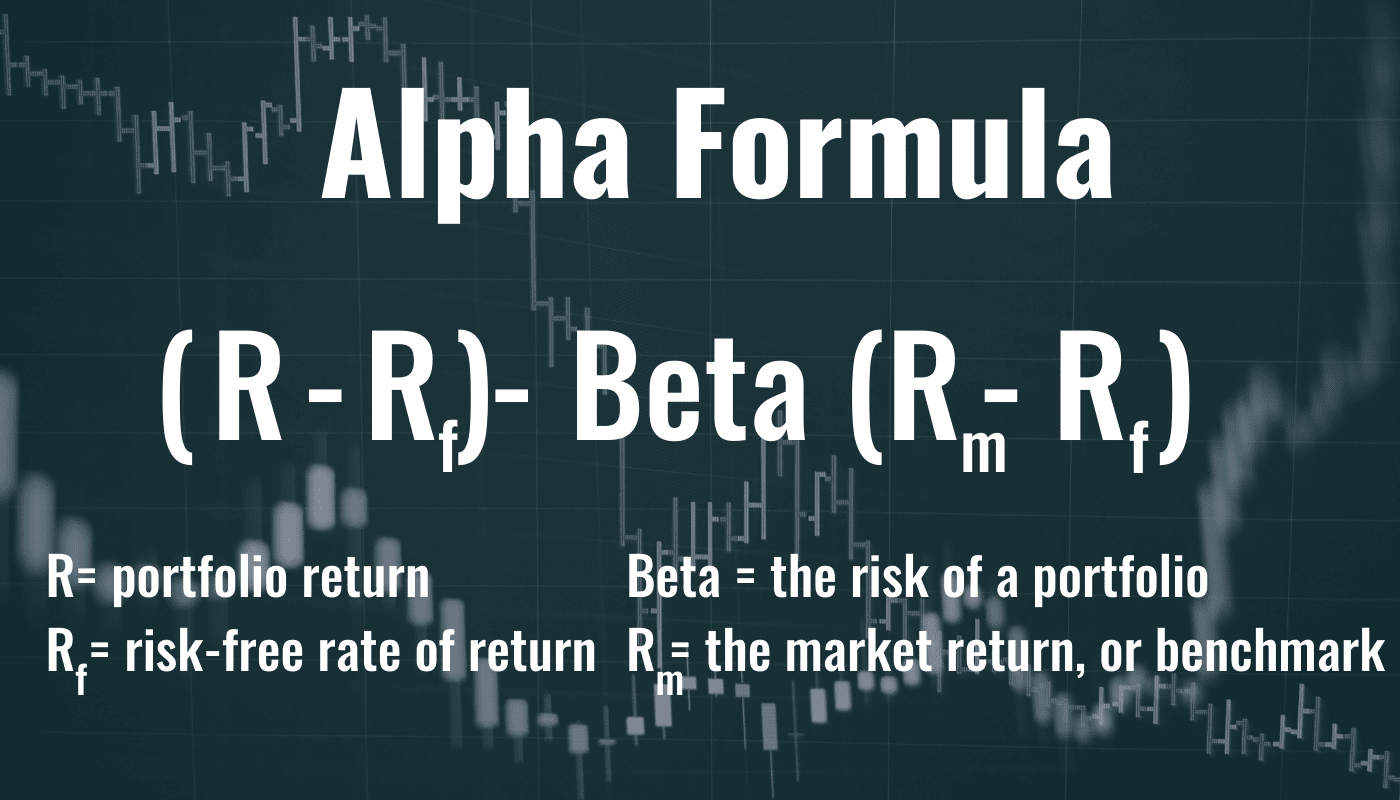
$$\alpha = R_i - [R_f + \beta_i(R_m - R_f)]$$
Where:
- $R_i$: The actual realized return of the portfolio or stock.
- $R_f$: The risk-free rate (typically the yield on 10-year Government Treasuries).
- $\beta_i$: The Beta of the portfolio.
- $R_m$: The return of the market benchmark.
- $(R_m - R_f)$: The market risk premium.
The Quest for Alpha in Active Management
Alpha is the metric used to judge the skill of active fund managers. If a manager charges high fees but produces zero or negative Alpha, they are essentially providing a "closet index" service—charging for active management while simply tracking the market.
Positive Alpha indicates that the manager’s selection of specific stocks or market timing has outperformed the benchmark on a risk-adjusted basis. In the 2026 investment environment, where low-cost ETFs dominate the market, generating consistent Alpha has become increasingly difficult and highly prized.
Comparative Analysis: Alpha vs. Beta
To better understand how these two metrics interact, consider the following comparison table:
| Feature | Alpha ($\alpha$) | Beta ($\beta$) |
|---|---|---|
| Primary Definition | Excess return above the benchmark. | Sensitivity to market movements. |
| Risk Type | Idiosyncratic / Unsystematic risk. | Systematic / Market risk. |
| Investor Goal | Maximize for higher gains. | Adjust based on risk tolerance. |
| Source of Value | Manager skill, research, timing. | Market exposure (Beta-riding). |
| Ideal Value | Positive (greater than 0). | Varies (1.0 for neutral, <1.0 for conservative). |
| Formula Basis | Realized Return - Expected Return. | Covariance / Variance. |
Step-by-Step Calculation Example
To visualize these alpha beta formulas in finance, let’s walk through a hypothetical scenario for a "Tech Growth Fund" in 2026.
1. Gather the Data:
- Portfolio Return ($R_i$): 15%
- Market Return ($R_m$): 10%
- Risk-Free Rate ($R_f$): 3%
- Portfolio Beta ($\beta$): 1.2
2. Calculate the Expected Return (CAPM): Before we find Alpha, we must determine what the fund should have returned given its risk level.
- Expected Return $= R_f + \beta(R_m - R_f)$
- Expected Return $= 0.03 + 1.2(0.10 - 0.03)$
- Expected Return $= 0.03 + 1.2(0.07) = 0.03 + 0.084 = 11.4%$
3. Calculate Alpha:
- $\alpha = \text{Actual Return} - \text{Expected Return}$
- $\alpha = 15% - 11.4% = 3.6%$
Conclusion: The fund generated an Alpha of 3.6%. This means the manager's specific picks added 3.6% of value beyond what could be explained by the fund's exposure to market volatility.
Practical Limitations and Considerations
While these formulas are mathematically precise, their application in real-world finance requires nuance.
1. Historical Data Reliance
Both Alpha and Beta are backward-looking. They are calculated using historical price data (typically 3 to 5 years of monthly returns). A stock that had a low Beta in the past may experience a "regime shift" and become highly volatile due to new regulatory changes or technological disruptions occurring in 2026.
2. Timeframe Sensitivity
Beta can vary significantly depending on the timeframe used for calculation. A "1-year Beta" might look very different from a "5-year Beta." Analysts must be consistent in their choice of intervals to ensure a fair comparison.
3. The Benchmark Choice
The validity of Alpha depends entirely on the choice of the benchmark ($R_m$). If you measure a small-cap tech fund against the S&P 500 (a large-cap index), the Alpha may be misleading. For an accurate result, the benchmark must reflect the actual investment universe of the asset being analyzed.
4. Non-Linear Risks
Beta assumes a linear relationship between a stock and the market. However, in periods of extreme market stress or "black swan" events, correlations often spike to 1.0, meaning Beta's predictive power diminishes exactly when investors need it most.
Strategic Applications for Investors
In 2026, the use of Alpha and Beta has evolved with the rise of "Smart Beta" strategies. These are semi-passive investment products that attempt to capture specific "factors" (like value, momentum, or low volatility) to deliver better risk-adjusted returns than a traditional market-cap-weighted index.
- Risk Mitigation: Investors looking to preserve capital should screen for low-Beta stocks or funds, particularly during inflationary periods where market volatility is elevated.
- Performance Benchmarking: Retail investors should use Alpha to evaluate if their expensive actively managed mutual funds are worth the cost. If the Alpha is consistently negative after fees, a switch to a low-cost index fund (Beta-only) is usually advisable.
- Hedging: By knowing the Beta of a portfolio, an investor can use index options or futures to "hedge out" market risk, effectively trying to isolate the Alpha of their specific stock picks.
Frequently Asked Questions
Can Alpha be negative?
Yes, Alpha can be negative. A negative Alpha indicates that the investment underperformed the benchmark after adjusting for the risk taken. This often happens due to high management fees, poor stock selection, or mistimed market entries. In many cases, active managers struggle to produce positive Alpha consistently over long periods.
What is a "Good" Beta for a conservative investor?
For a conservative investor, a Beta between 0.3 and 0.8 is generally considered appropriate. These assets (such as consumer staples or healthcare) tend to fall less than the broad market during downturns, providing a cushion for the portfolio, though they will also likely lag during aggressive bull markets.
How does the Risk-Free Rate affect Alpha?
The risk-free rate ($R_f$) is a key component of the Alpha formula. As the risk-free rate rises, the "hurdle rate" for an investment also rises. In 2026, if central bank rates remain elevated, managers must generate higher absolute returns just to achieve a positive Alpha, as the "expected return" for simply holding safe government debt is higher.
Is Alpha more important than Beta?
Neither is objectively more important; they serve different purposes. Beta is a tool for risk management and asset allocation, helping you decide how much market exposure you can handle. Alpha is a tool for performance evaluation, helping you decide if a specific strategy or manager is providing value.
Does a Beta of 0 mean an investment is "Safe"?
Not necessarily. A Beta of 0 only means the investment is not correlated with the stock market index. The investment could still have high "idiosyncratic risk"—for example, a startup company might have a Beta of 0 because its success depends on a specific patent rather than the S&P 500, but it could still lose 100% of its value.
Final Recommendations
When applying alpha beta formulas in finance, always look at them in combination with other metrics like the Sharpe Ratio (which measures return per unit of total risk) and the R-squared value (which indicates how reliable the Beta calculation actually is).
For the individual investor in 2026, the most practical approach is to use Beta to ensure your portfolio matches your personal comfort with volatility, while using Alpha to ruthlessly prune underperforming active investments from your holdings. Remember that while Beta is relatively easy to buy through low-cost index funds, Alpha is rare, expensive, and difficult to maintain over the long term.