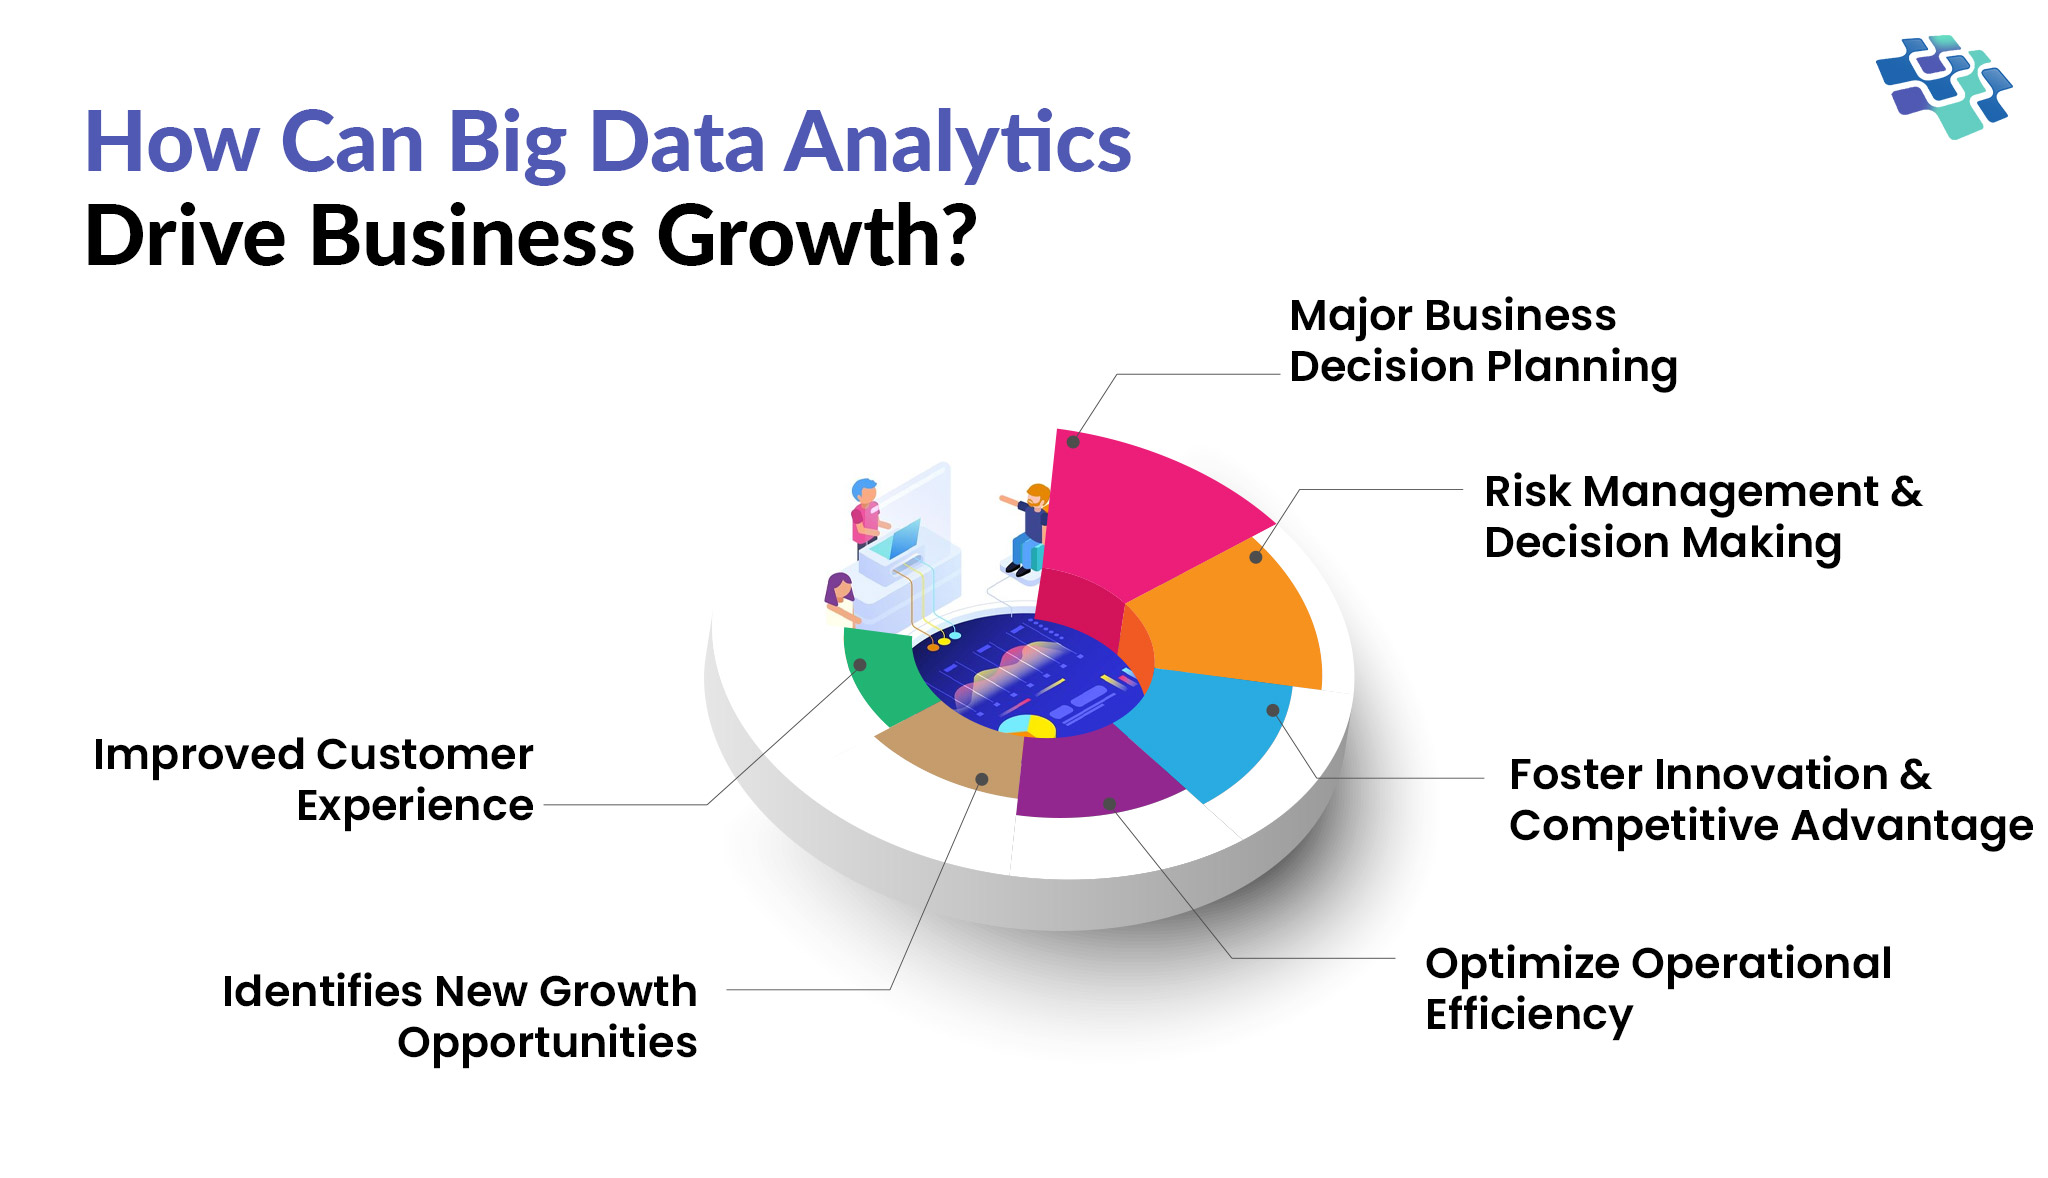
Quantitative research provides the empirical foundation needed to move beyond intuition. By leveraging structured data and statistical analysis, organizations can validate hypotheses, minimize risk, and optimize performance across diverse sectors, ensuring every strategic pivot is backed by verifiable numerical evidence rather than anecdotal observation or gut feelings.
In the landscape of 2026, data-driven decision-making (DDDM) is no longer a competitive advantage but a baseline requirement for survival. The ability to collect, process, and interpret numerical data allows leaders to predict market shifts, understand consumer behavior at scale, and allocate resources with surgical precision. To master this discipline, one must understand the specific methodologies that yield actionable insights.
Below are five comprehensive examples of quantitative research applied to high-stakes decision-making, detailing their technical frameworks, practical applications, and the strategic value they provide.
1. A/B Testing for Product and Web Optimization
A/B testing, or split testing, is perhaps the most ubiquitous example of quantitative research in the digital sector. It involves comparing two versions of a single variable—such as a webpage, an email subject line, or a software feature—to determine which one performs better based on a specific metric.
The Methodology of Causal Inference
In an A/B test, users are randomly assigned to either a control group (Version A) or a treatment group (Version B). By isolating a single variable, researchers can attribute changes in behavior directly to that variable. This is known as establishing causal inference. In 2026, many organizations use automated experimentation platforms that utilize Bayesian statistics to provide real-time probability estimates of which version is "winning," moving away from the slower, traditional Frequentist p-value approaches.
Application in Decision Making
Consider an e-commerce platform deciding between two checkout flows. Version A is the traditional multi-step process, while Version B is a single-page "express" checkout. By measuring the conversion rate (the percentage of visitors who complete a purchase), the company can quantitatively prove which design generates more revenue.
If Version B results in a 4% increase in conversions with a 99% statistical significance, the decision to implement the change is backed by data. This eliminates internal debates based on design preferences and focuses entirely on user performance.
Technical Considerations
For A/B testing to be valid, researchers must ensure a sufficient sample size. A test with too few participants may result in "false positives," where a fluke in the data appears to be a meaningful trend. Using a "Power Analysis" before the test begins helps determine exactly how many users are needed to detect a specific effect size.
2. Net Promoter Score (NPS) and Customer Satisfaction Research
Descriptive quantitative research often takes the form of large-scale surveys designed to measure customer sentiment. The Net Promoter Score (NPS) is a standardized metric used to gauge customer loyalty and the likelihood of organic growth through word-of-mouth.
Calculating the Metric
The research involves asking a single, structured question: "On a scale of 0 to 10, how likely are you to recommend our service to a friend or colleague?"
- Promoters (9-10): Loyal enthusiasts.
- Passives (7-8): Satisfied but unenthusiastic.
- Detractors (0-6): Unhappy customers.
The final NPS is calculated by subtracting the percentage of Detractors from the percentage of Promoters. The resulting score ranges from -100 to +100.
Strategic Impact
In 2026, companies integrate NPS data with Customer Lifetime Value (CLV) metrics. If the quantitative data shows that "Promoters" spend 50% more over their lifetime than "Passives," a business leader might decide to invest heavily in "customer delight" initiatives rather than traditional acquisition marketing.
Furthermore, by correlating NPS scores with specific touchpoints (e.g., after a customer service call or after a delivery), researchers can identify exactly where the "friction" in the customer journey exists. This allows for data-driven prioritization of operational improvements.
Avoiding Response Bias
A critical technical challenge in survey-based research is non-response bias. If only extremely happy or extremely angry customers respond, the data is skewed. Modern quantitative researchers use weighting techniques and follow-up sampling to ensure the data accurately reflects the entire customer base, not just the vocal minority.
3. Market Segmentation through Cluster Analysis
Market segmentation is a multivariate quantitative technique used to divide a broad target market into subsets of consumers who have common needs or characteristics. Cluster analysis is the primary statistical method used to achieve this.
How Cluster Analysis Works
Unlike simple demographic grouping (e.g., "men aged 18–35"), cluster analysis looks at dozens or hundreds of data points simultaneously—purchase history, browsing behavior, price sensitivity, and geographic location. Using algorithms like K-means clustering, the data is organized into groups where the "distance" between members of the same group is minimized, while the distance between different groups is maximized.
Data-Driven Decision Making in Marketing
A global retailer might use cluster analysis to find that their customers naturally fall into four distinct groups: "Value-Seekers," "Early Adopters," "Brand Loyalists," and "Convenience Shoppers."
Armed with this quantitative insight, the marketing department can stop using "one-size-fits-all" campaigns. Instead, they can allocate their budget based on the ROI of each segment. If the "Early Adopter" cluster shows the highest profit margin, the company might decide to shift 40% of its R&D budget toward products specifically tailored to that group's preferences.
Technical Depth: Variable Selection
The quality of a cluster analysis depends on the variables chosen. Researchers must perform "Principal Component Analysis" (PCA) to reduce data redundancy, ensuring that the clusters are based on the most impactful factors rather than "noise" in the dataset.
4. Conjoint Analysis for Product Development and Pricing
Conjoint analysis is a sophisticated quantitative survey technique used to determine how people value different attributes (feature, function, benefits) that make up an individual product or service.
The Trade-off Mechanism
In a conjoint study, respondents are not asked "Do you want a lower price?" (to which everyone says yes). Instead, they are presented with a series of product profiles and asked to choose their favorite. For example, a laptop manufacturer might ask a participant to choose between:
- A laptop with 10 hours of battery life at $1,200.
- A laptop with 15 hours of battery life at $1,500.
By analyzing thousands of these trade-offs, researchers can calculate the "Part-Worth Utilities"—a numerical value representing how much each feature contributes to the customer’s decision.
Pricing Decisions
This research is invaluable for pricing strategy. If the data shows that customers are willing to pay $200 more for a 5-hour increase in battery life, but it only costs the company $50 to produce that battery, the decision to upgrade the product is mathematically sound.
Conjoint analysis also helps in "Market Simulation." Before a product is even built, researchers can predict what its market share would be if it were launched against existing competitors at various price points. This reduces the risk of expensive product failures.
5. Time-Series Analysis for Demand Forecasting
Time-series analysis involves analyzing a sequence of data points collected over an interval of time to identify trends, seasonal patterns, and cyclical variations.
Forecasting Models
In 2026, sophisticated models like ARIMA (AutoRegressive Integrated Moving Average) and machine learning-based Long Short-Term Memory (LSTM) networks are used to process years of historical sales data. These models account for:
- Seasonality: Higher sales during holidays or specific months.
- Trends: A general upward or downward trajectory in market demand.
- Exogenous Variables: The impact of external factors like inflation rates or competitor actions.
Operational Decision Making
A logistics company uses time-series analysis to decide how many vehicles to lease and how many workers to hire for the upcoming quarter. If the quantitative model predicts a 15% surge in demand with an 85% confidence interval, the company can secure resources in advance at a lower cost.
Without this quantitative approach, the company risks either "stockouts" (losing revenue because they can't meet demand) or "overstocking" (wasting money on idle resources). Data-driven forecasting ensures that the supply chain remains lean and responsive.
Comparison of Quantitative Research Methods
The following table compares these five methods to help you determine which is most appropriate for your specific decision-making needs.
| Research Method | Primary Goal | Data Source | Technical Complexity | Typical Outcome |
|---|---|---|---|---|
| A/B Testing | Optimization | User Interaction Data | Moderate | Higher Conversion Rates |
| NPS Surveys | Loyalty Tracking | Customer Feedback | Low | Improved Retention Strategy |
| Cluster Analysis | Targeting | Customer Database | High | Personalized Marketing |
| Conjoint Analysis | Product Design | Trade-off Surveys | Very High | Optimal Pricing & Features |
| Time-Series | Forecasting | Historical Records | High | Inventory & Resource Planning |
Technical Prerequisites for Accurate Quantitative Research
To ensure that the examples above lead to sound decisions, researchers in 2026 must adhere to several technical standards:
- Data Cleaning: Quantitative data is only as good as its source. "Noise," such as duplicate entries, bot traffic in A/B tests, or "straight-lining" in surveys (where respondents click the same answer for every question), must be removed before analysis.
- Statistical Significance: Every decision must be evaluated against the "p-value" (typically < 0.05) or a high Bayesian probability. This ensures that the observed results are not due to random chance.
- Representative Sampling: The group being studied must accurately represent the larger population. If a mobile app developer only tests a new feature on high-end smartphone users, the data will not accurately predict how the feature will perform for the general public.
- Avoidance of "p-hacking": This occurs when researchers manipulate data or choose specific variables until they find a "significant" result. To prevent this, hypotheses and analysis plans should be documented before the data is collected.
Frequently Asked Questions
What is the difference between quantitative and qualitative research?
Quantitative research focuses on "how many" or "how much" using numerical data and statistics to find patterns and averages. Qualitative research focuses on "why" or "how" using non-numerical data like interviews and open-ended observations to understand underlying motivations. For effective decision-making, businesses often use qualitative research to generate ideas and quantitative research to test them.
How large should my sample size be?
The required sample size depends on the size of the total population, the "margin of error" you are willing to accept, and the "confidence level" (usually 95%). For a standard business survey, a sample size of 400 to 1,000 is often sufficient to achieve a 3-5% margin of error. Specialized software is typically used to calculate the exact number needed for statistical power.
Can quantitative research be wrong?
Yes. Quantitative research can be misleading if the data is biased, the sample is not representative, or if the researchers mistake correlation for causation. For example, ice cream sales and sunburns are highly correlated, but buying ice cream does not cause sunburns—both are caused by the sun. Decisions must always be contextualized with a deep understanding of the variables involved.
Is quantitative research more expensive than qualitative?
Not necessarily. While sophisticated conjoint analysis or large-scale longitudinal studies can be expensive, many quantitative methods like A/B testing and NPS surveys are highly cost-effective due to automation. In 2026, AI-driven tools have significantly lowered the cost of processing large datasets, making quantitative research accessible to small and medium-sized enterprises.
How often should quantitative research be conducted?
For performance metrics like NPS or A/B testing, research should be "always-on" or conducted at regular intervals (e.g., quarterly). For strategic decisions like market segmentation or product conjoint analysis, the research is typically project-based and should be updated whenever there is a significant shift in the market or a major change in company strategy.
Practical Recommendation
When implementing these quantitative research examples, start with the problem you are trying to solve rather than the data you have. If your goal is to increase immediate revenue, prioritize A/B Testing. If you are looking for long-term growth and brand health, focus on NPS and Customer Satisfaction. Always ensure that your data is "cleaned" and that your results reach statistical significance before committing significant capital to a new strategy. In the data-rich environment of 2026, the most successful leaders are those who treat every business decision as a testable hypothesis.