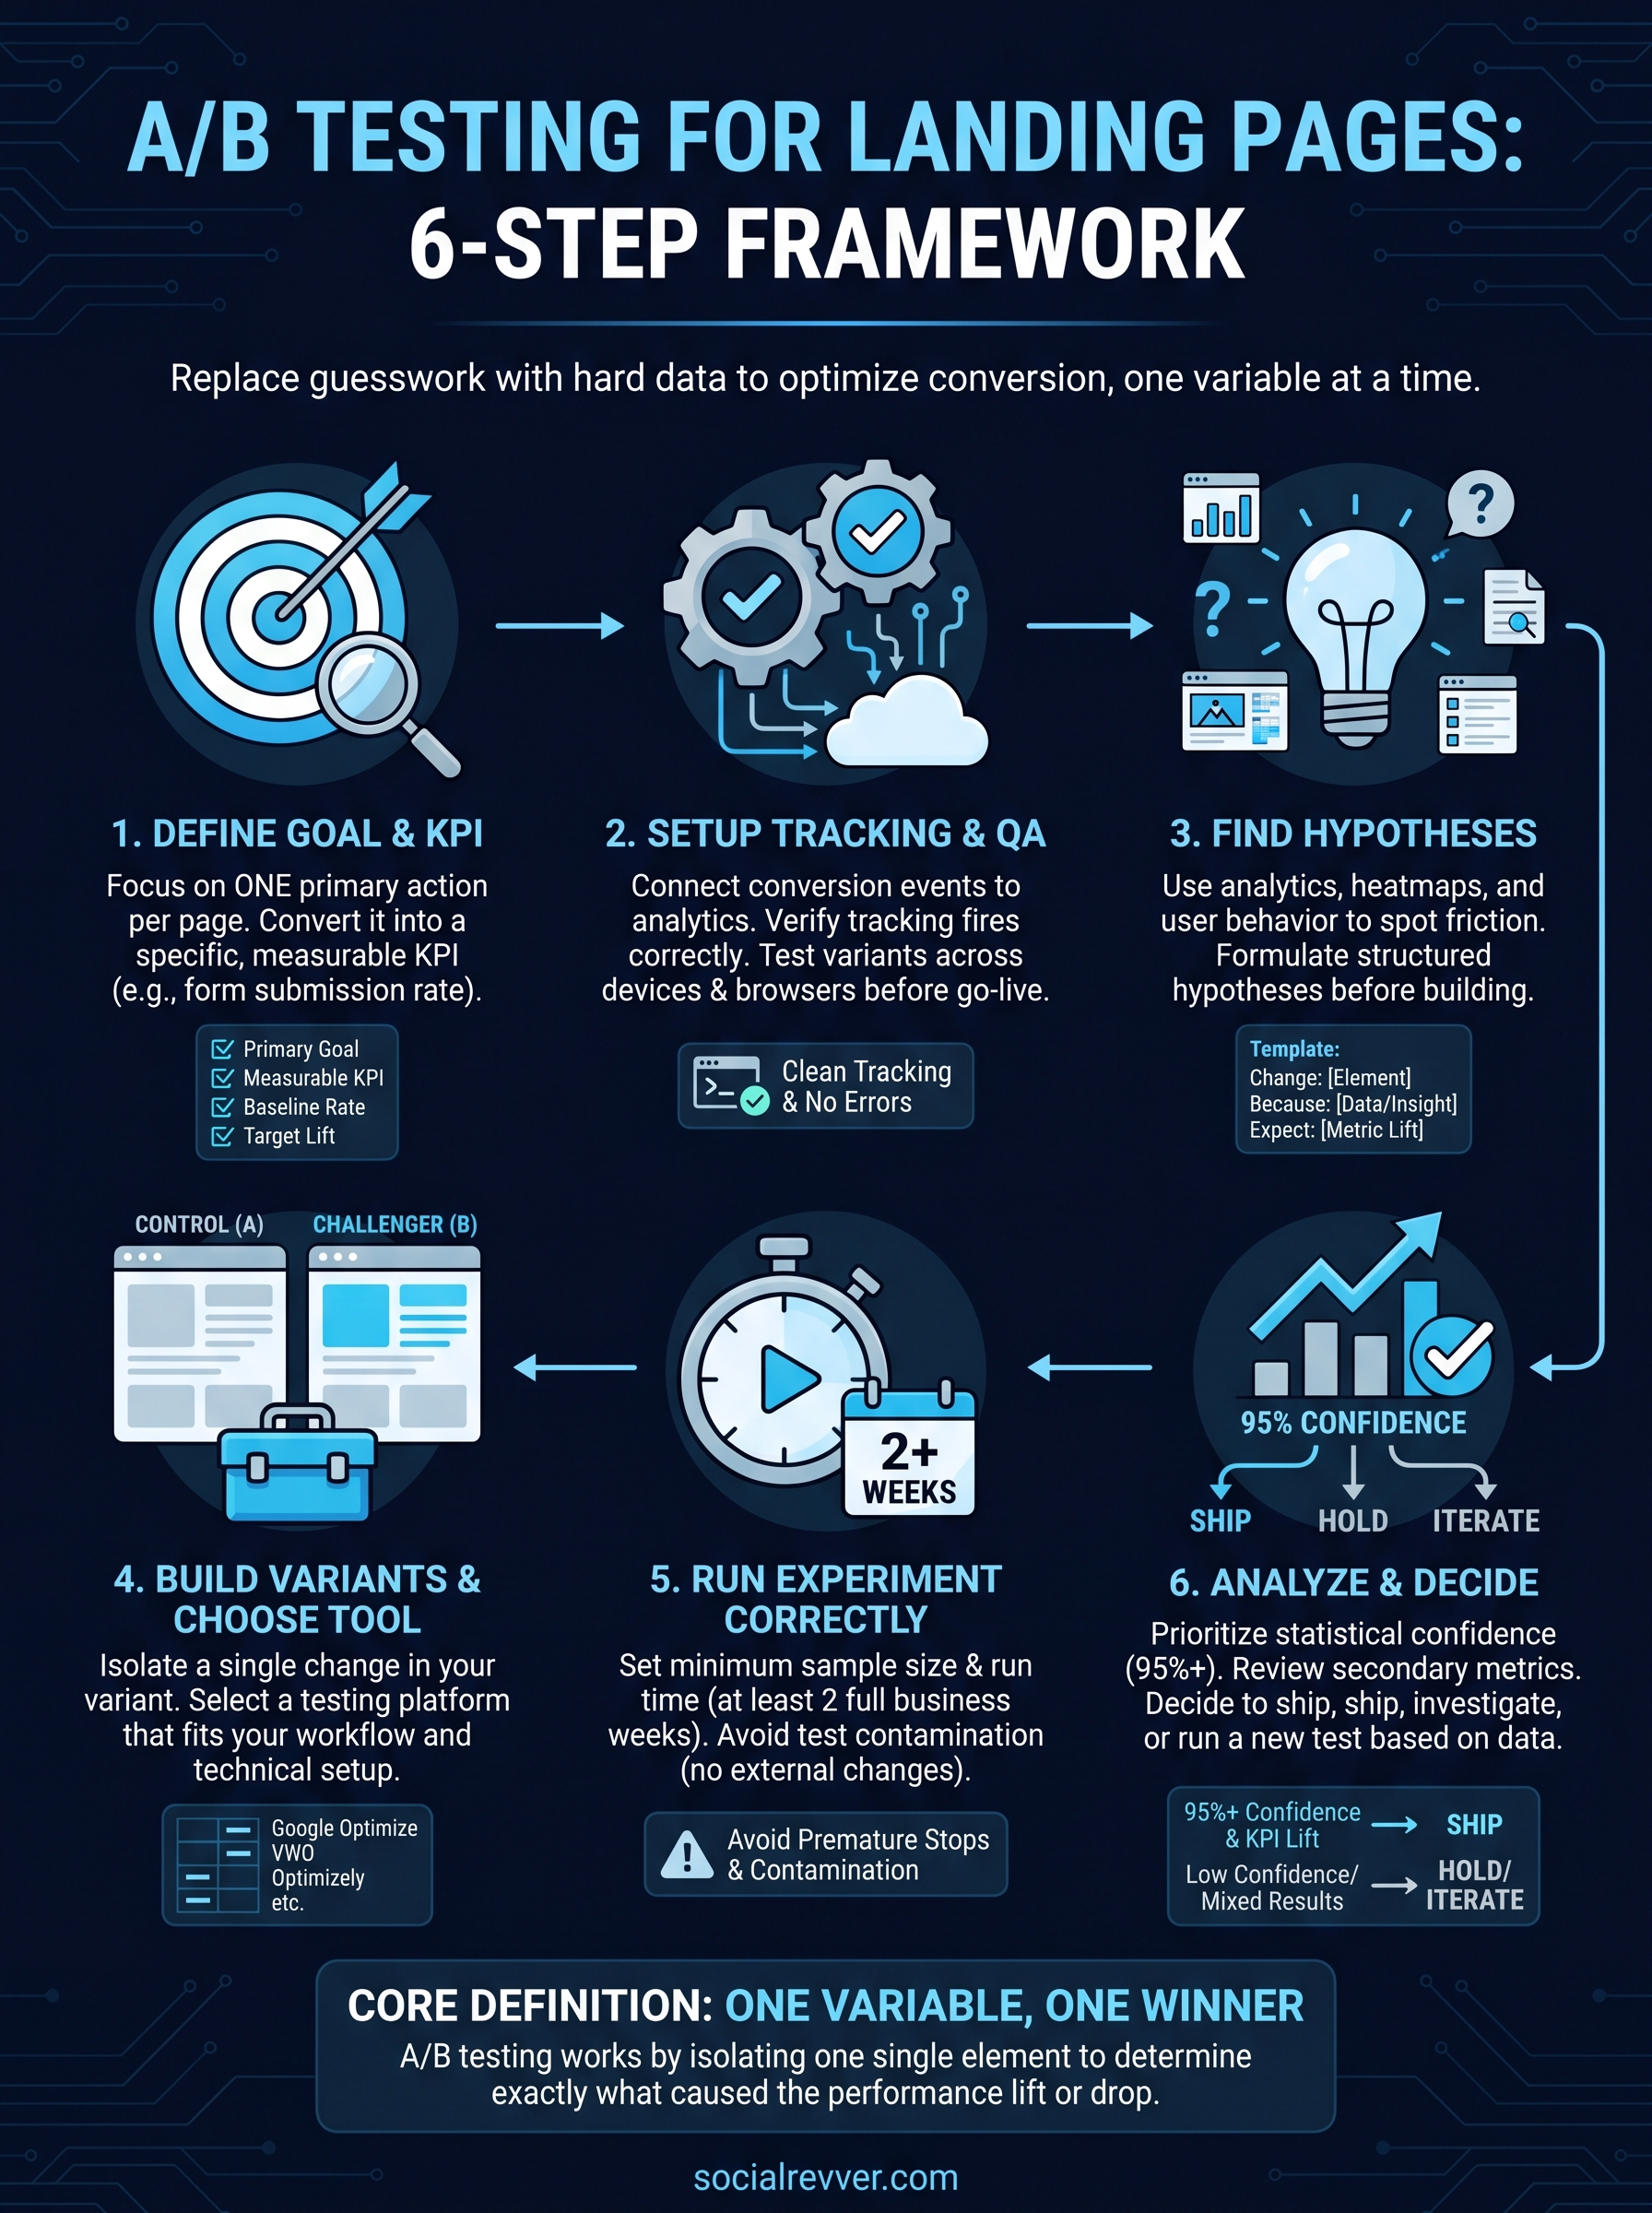
A/B testing for landing pages and checkouts involves systematically comparing two versions of a webpage to identify which specific elements—such as headlines, CTA placement, or form fields—yield higher conversion rates. By isolating variables, businesses can make data-driven decisions that reduce friction, enhance user experience, and significantly boost revenue in the 2026 digital marketplace.
To achieve sustainable growth, organizations must move beyond random guesswork and adopt a structured experimentation framework. The following guide provides a comprehensive breakdown of testing strategies designed to optimize the two most critical stages of the conversion funnel: the initial landing page and the final checkout sequence.
High-Impact A/B Testing Ideas for Landing Pages
The landing page is often the first point of contact between a brand and a potential customer. Its primary goal is to maintain the "scent" of the traffic source while persuading the visitor to take a specific action. In 2026, user attention spans are more fragmented than ever, making the first three seconds of interaction vital.
1. Headline and Value Proposition Testing
The headline is arguably the most important element on your landing page. It must communicate value within milliseconds.
- Benefit-Driven vs. Feature-Driven: Test a headline that focuses on the end result for the user (e.g., "Double Your Leads in 30 Days") against one that highlights a key feature (e.g., "The Industry’s Most Powerful Analytics Dashboard").
- Emotional vs. Rational Hooks: Compare copy that triggers an emotional response (fear of missing out, aspiration, or relief) against a headline that uses cold, hard logic and statistics.
- Question vs. Statement: Sometimes, asking a question that the user identifies with (e.g., "Struggling to Scale Your Content?") can outperform a direct statement of fact.
2. Visual Content and Media Hierarchy
In the 2026 landscape, the choice of media can drastically alter page load speeds and user engagement levels.
- Static Hero Image vs. Short-Form Video: While video can explain complex products better, it can also distract or slow down the page. Test a high-quality static "lifestyle" image against a 15-second looping video that demonstrates the product in use.
- Human Faces vs. Product Shots: Test whether showing a person using the product creates more empathy and trust than a clean, high-resolution shot of the product itself.
- Illustration vs. Photography: For SaaS or technical products, abstract illustrations can often simplify complex concepts better than realistic photography.
3. Call to Action (CTA) Optimization
A CTA should be the most visually distinct element on the page. Small changes here often lead to the highest conversion lifts.
- Copy Specificity: Test generic phrases like "Sign Up" or "Submit" against high-intent, specific copy like "Get My Free Guide" or "Start My 14-Day Trial."
- Button Color and Contrast: Use a color that stands out from the rest of the page's palette (often referred to as the "Big Orange Button" theory, though the specific color depends on your brand's color scheme).
- Placement and Frequency: Test a single CTA "above the fold" against multiple CTAs placed strategically throughout a long-form landing page.
4. Lead Capture and Form Design
Friction in forms is a major conversion killer. Every additional field added can decrease the completion rate.
- Multi-step vs. Single-step Forms: Sometimes, a single long form is intimidating. Testing a multi-step "wizard" format—where users answer one or two questions at a time—can increase completion rates by reducing cognitive load.
- Field Labeling and Placeholders: Test labels placed above the fields versus labels placed inside the fields (ghost text). Note that in 2026, accessibility standards generally favor labels outside the fields.
- Social Sign-On (SSO): Test the inclusion of "Sign up with Google" or "Sign up with Apple" buttons to see if removing the manual typing requirement improves sign-up rates.
Strategic A/B Testing for the Checkout Experience
While the landing page handles persuasion, the checkout page handles the transaction. At this stage, the user is already "sold," but friction, anxiety, or unexpected costs can still cause them to abandon the cart. According to the Baymard Institute, the average cart abandonment rate remains near 70% globally, making this the most lucrative area for A/B testing.
1. Checkout Layout and Flow
The structure of your checkout determines how much "work" the user feels they are doing.
- Single-Page vs. Multi-Step Checkout: A single-page checkout puts everything in front of the user at once, which can feel efficient or overwhelming. A multi-step checkout (Shipping > Billing > Review) breaks the process into manageable chunks but adds more clicks.
- Accordion-Style Layout: This hybrid approach keeps the user on one page but only expands the current section they are working on, hiding the others to minimize distraction.
2. The Guest Checkout Mandate
Forcing users to create an account before buying is a primary reason for abandonment.
- Guest Checkout vs. Required Registration: Test allowing users to check out as guests with the option to "save their details" after the purchase is complete.
- Social Login at Checkout: Similar to landing pages, providing a one-tap login can bypass the need for password creation during the sensitive payment phase.
3. Shipping and Cost Transparency
Hidden fees are the number one reason for abandoned carts.
- Free Shipping Thresholds: Test "Free Shipping on all orders" against "Free Shipping on orders over $50." You may find that the increase in Average Order Value (AOV) compensates for the shipping costs.
- Estimated Delivery Dates: Test showing a specific delivery date (e.g., "Arrives by Thursday, June 12") versus a generic range (e.g., "3-5 business days"). Specificity builds trust.
- Tax Inclusion: In jurisdictions where it is legal, test showing the total price including taxes earlier in the process rather than adding them at the final click.
4. Trust Signals and Security Perceptions
Users need to feel safe when entering credit card information.
- Trust Badge Placement: Test the placement of security seals (like Norton, McAfee, or industry-specific certifications) near the "Pay" button versus in the footer.
- Micro-copy and Security Reminders: Test adding a small line of text under the credit card field that says, "Your transaction is secure and encrypted," to reassure hesitant buyers.
- Payment Method Visibility: Test showing logos of accepted payment methods (Visa, Mastercard, PayPal, Klarna) early in the checkout process to ensure the user knows their preferred method is available.
Comparison of Testing Focus Areas
The following table summarizes the key differences between testing on landing pages and checkout pages, helping you prioritize where to allocate your experimentation budget in 2026.
| Feature | Landing Page Testing Focus | Checkout Page Testing Focus | Primary Goal |
|---|---|---|---|
| User Intent | Browsing / Informational | Transactional / Decided | Convert Interest to Sale |
| Main Friction | Lack of trust or relevance | Complexity and hidden costs | Remove Barriers |
| Copy Style | Persuasive and Benefit-led | Clear and Instructional | Direct Action |
| KPIs | Click-Through Rate (CTR), Lead Gen | Conversion Rate (CR), Cart Abandonment | Revenue Generation |
| Visuals | High-impact, Hero images | Clean, Minimalist, Distraction-free | Focus on Transaction |
| Trust Signals | Social proof, Testimonials | Security badges, Return policies | Security Assurance |
Technical Methodology and Statistical Significance
To ensure that your A/B test results are valid in 2026, you must adhere to rigorous statistical standards. A common mistake is ending a test too early because one version appears to be "winning."
Calculating Sample Size
Before starting a test, use a power calculator to determine the required sample size. This is based on your current baseline conversion rate, the minimum detectable effect (MDE) you wish to see, and the statistical power (usually 80%). Without a sufficient sample size, your results may be due to random chance rather than the changes you made.
The Importance of Statistical Significance
Most A/B testing tools provide a "p-value" or a "chance to beat baseline" percentage. Aim for a statistical significance of at least 95%. This means there is only a 5% chance that the difference in performance is a fluke. In 2026, many enterprise-level tools use Bayesian statistics, which allow for more flexible interpretation of data as it accumulates, compared to the traditional Frequentist approach.
Avoiding the "Peaking" Problem
Peaking is the act of checking your results and making a decision before the test has reached its required duration or sample size. This often leads to "false positives." A best practice is to run tests for at least one or two full business cycles (usually 7 to 14 days) to account for variations in traffic patterns on weekends versus weekdays.
Common Mistakes to Avoid
- Testing Too Many Variables at Once: This is the difference between an A/B test and a Multivariate Test (MVT). If you change the headline, the image, and the CTA color all at once, you won't know which change caused the lift.
- Ignoring Mobile Users: In 2026, the majority of web traffic is mobile. A test that wins on desktop might fail on mobile due to different screen sizes or interaction patterns (tapping vs. clicking).
- Overlooking Page Load Speed: Adding heavy "winning" elements like high-res videos can backfire if they slow down the page. Always monitor the correlation between page speed and conversion.
- Testing Without a Hypothesis: Don't just "test stuff." Use a framework: "By changing [Variable X] to [Version Y], I expect [Metric Z] to increase because [User Psychology Reason]."
Frequently Asked Questions
How long should I run an A/B test?
Generally, a test should run for at least two weeks to capture a full cycle of user behavior. However, the true duration depends on your traffic volume. You must continue the test until you have reached statistical significance and the pre-determined sample size.
Can I run A/B tests if I have low traffic?
Yes, but you must be strategic. On low-traffic sites, it is harder to reach statistical significance for small changes (like button color). Instead, test "radical" changes—such as an entirely different value proposition or a significantly shorter checkout flow—to see larger, more measurable swings in data.
Which tools are best for A/B testing in 2026?
Standard industry tools include Optimizely, VWO (Visual Website Optimizer), and Adobe Target. For smaller businesses or those integrated with the Google ecosystem, modern alternatives to the retired Google Optimize have emerged, focusing on server-side testing to improve performance.
Should I test my landing page and checkout simultaneously?
It is possible, but risky. If the landing page test significantly changes the quality of the traffic reaching the checkout, it could skew the results of the checkout test. It is often cleaner to test different stages of the funnel sequentially unless you have a very high volume of traffic and sophisticated attribution modeling.
What is a "Winning" conversion lift?
There is no universal "good" lift. In some industries, a 1% increase in conversion can result in millions of dollars in additional revenue. Focus on the ROI of the test rather than a specific percentage. Even a "losing" test is valuable because it prevents you from implementing a change that would have hurt your revenue.
Next Steps for Implementation
To begin, conduct a heuristic analysis of your current landing page and checkout. Identify areas with the highest friction using heatmaps or session recordings. Prioritize your ideas based on the PIE framework: Potential (how much improvement can be made), Importance (how valuable the traffic is), and Ease (how difficult it is to implement the test). Start with a simple headline or CTA test to establish your workflow before moving into complex checkout re-designs.