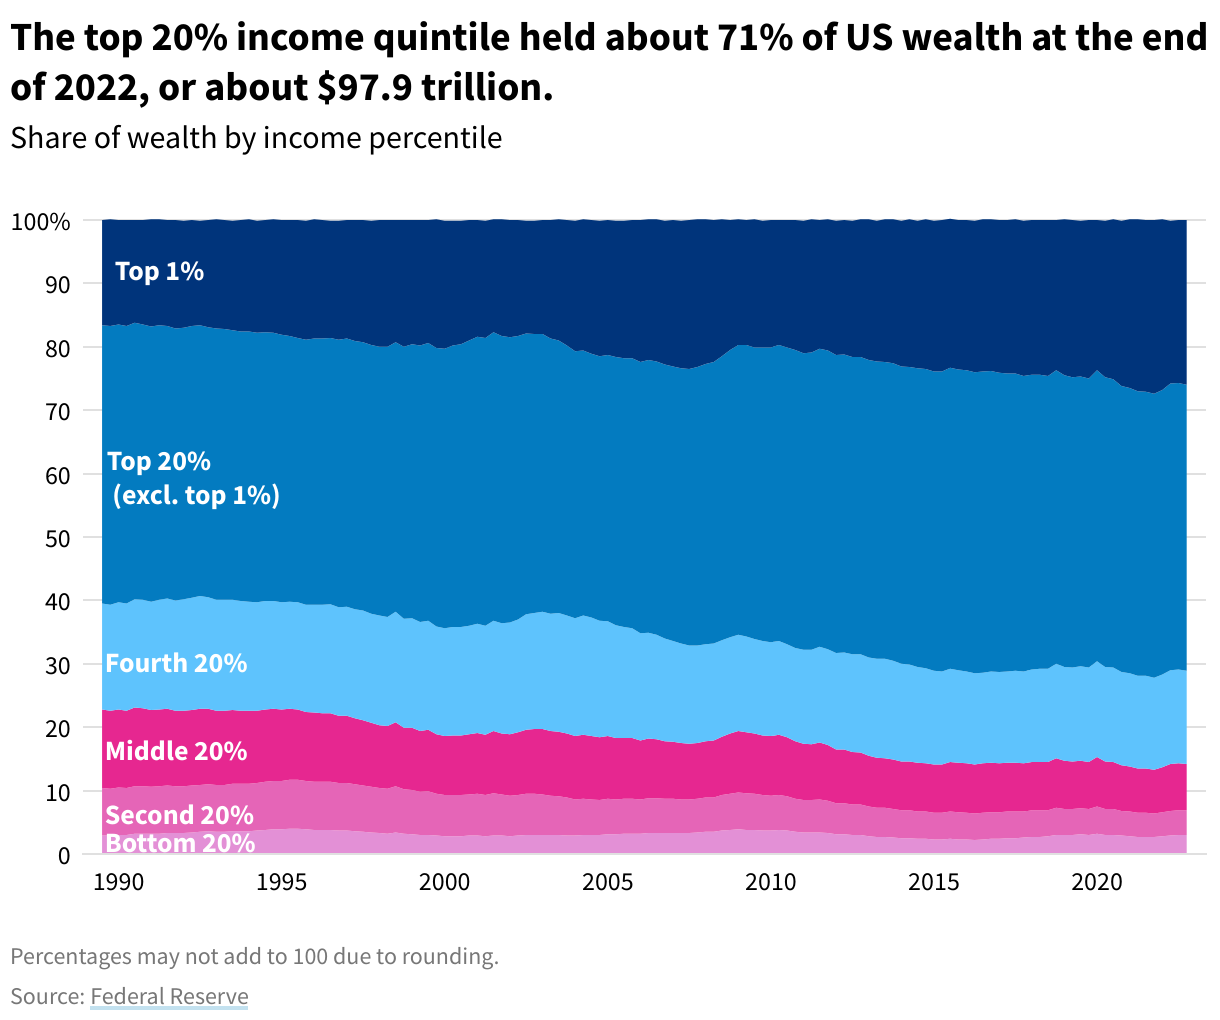
The distribution of American net worth over time has shifted toward significant concentration at the top of the economic spectrum, with the top 1% now holding approximately 30% of total household wealth. Since 1989, the wealth share of the bottom 50% has remained below 3%, while the top 10% of households control over 65% of the nation's total assets.
Understanding Net Worth and the Distributional Financial Accounts
To analyze how wealth moves through the American economy, we must first define net worth. Net worth is the total value of all assets owned by an individual or household (including real estate, bank accounts, stocks, bonds, and retirement funds) minus all outstanding liabilities (such as mortgages, student loans, and credit card debt).
The primary source for tracking these shifts is the Federal Reserve’s Distributional Financial Accounts (DFA). Launched to provide more frequent updates than the triennial Survey of Consumer Finances, the DFA integrates quarterly aggregate measures with household-level survey data. This allows economists and the public to see how different wealth brackets—such as the top 0.1%, the top 1%, the 50-90% (middle class), and the bottom 50%—fare in real-time as market conditions change.
Historically, American wealth distribution was more equitable in the post-World War II era. However, beginning in the late 1970s and accelerating through the 1980s, a "great divergence" began. As of 2026, we are looking back at nearly four decades of a widening gap between the growth of asset values and the growth of labor wages.
The Evolution of Wealth Shares (1989–2026)
The history of American net worth distribution is best understood through distinct economic eras. Each period has been defined by different asset bubbles, policy shifts, and external shocks.
The Era of Expansion and Tech Growth (1989–2000)
In 1989, the top 1% of households held approximately 23% of total US wealth. During the 1990s, the explosion of the technology sector and a booming stock market began to favor those with high equity exposure. By the year 2000, the top 1%'s share had increased to roughly 27%. Meanwhile, the bottom 50% saw their share of wealth stagnate, often hovering around 3%, as their primary asset—residential real estate—did not appreciate as rapidly as the equity markets during this specific window.
The Housing Bubble and the Great Recession (2001–2012)
The early 2000s saw a shift in asset growth toward real estate. Because homeownership is the primary vehicle for wealth creation for the middle class (the 50-90% bracket), this period saw a temporary stabilization in wealth distribution. However, the 2008 financial crisis was a "wealth destroyer" for the bottom 90%.
While the wealthy lost significant amounts in the stock market crash, they were able to hold onto their assets and benefit from the subsequent recovery. In contrast, millions of families in the bottom 50% and the middle class faced foreclosures, effectively wiping out their primary source of net worth. By 2012, the wealth share of the bottom 50% hit a historic low of approximately 0.4%.
The Long Recovery and the Pandemic Pivot (2013–2022)
From 2013 to 2019, the U.S. experienced one of the longest economic expansions in history. Ultra-low interest rates pushed stock prices to record highs, disproportionately benefiting the top 10%.
The COVID-19 pandemic in 2020 created a unique anomaly. While the bottom 50% saw a temporary percentage increase in wealth due to massive fiscal stimulus and a moratorium on debt payments, the absolute dollar gains were dwarfed by the top 1%. Between 2020 and 2022, the top 1% added trillions of dollars to their collective net worth, fueled by a soaring stock market and a sudden surge in real estate values.
The Post-Inflationary Stability (2023–2026)
As we navigate 2026, the distribution has reached a state of "stretched equilibrium." Higher interest rates between 2022 and 2025 slowed the rapid appreciation of real estate, which historically hurts first-time buyers but protects the equity of existing owners. The concentration of wealth remains near all-time highs, but the rapid "gap widening" of the early 2020s has moderated into a period of high-plateau inequality.
Comparative Wealth Distribution by Percentile
The following table illustrates the approximate share of total US household wealth held by different groups at key historical intervals, based on Federal Reserve Distributional Financial Accounts.
| Year | Top 0.1% | Top 1% (Total) | Next 9% (90-99th) | Middle Class (50-90th) | Bottom 50% |
|---|---|---|---|---|---|
| 1989 | 9.1% | 23.5% | 36.6% | 36.2% | 3.7% |
| 2000 | 10.5% | 27.2% | 34.1% | 35.4% | 3.3% |
| 2010 | 12.3% | 28.6% | 37.8% | 32.5% | 1.1% |
| 2020 | 13.9% | 30.2% | 38.4% | 29.4% | 2.0% |
| 2025* | 14.5% | 31.8% | 37.5% | 28.1% | 2.6% |
*Projections based on late-2024 and 2025 trend data.
Asset Composition: Why the Gap Persists
The primary reason for the persistent distribution gap is not just "how much" people own, but what they own. The composition of assets varies wildly across wealth brackets, creating a structural advantage for the top percentiles.
The Wealthy: Driven by Equities and Business Equity
For the top 1% and 0.1%, the majority of wealth is held in corporate equities and mutual funds, as well as private business equity. These assets have historically outpaced inflation and wage growth. Furthermore, these assets provide "compounding" returns. In 2026, the top 1% owns more than half of all individually held stocks in the United States. When the stock market rises, the wealth gap naturally widens because the bottom 90% simply do not own enough shares to move the needle on their total net worth.
The Middle Class: The Real Estate Anchor
For the 50-90% bracket, the primary asset is principal residences. While home equity is a stable way to build wealth, it is also a "use asset." You cannot easily liquidate 10% of your kitchen to pay for a medical emergency. Additionally, real estate growth is often regional and subject to maintenance costs and property taxes, which can eat into the "real" net worth gains over time.
The Bottom 50%: Liquid Assets and Consumer Debt
For the bottom 50%, "wealth" consists primarily of liquid assets (checking and savings accounts) and perhaps a small amount of home equity or a used vehicle. However, this group is also the most likely to hold significant consumer debt. For many in this bracket, net worth is near zero or even negative. Even when their wages increase, the "wealth" does not necessarily accumulate because it is often consumed by the rising cost of living, such as rent and healthcare, which are not wealth-building assets.
The Role of Demographics and Age
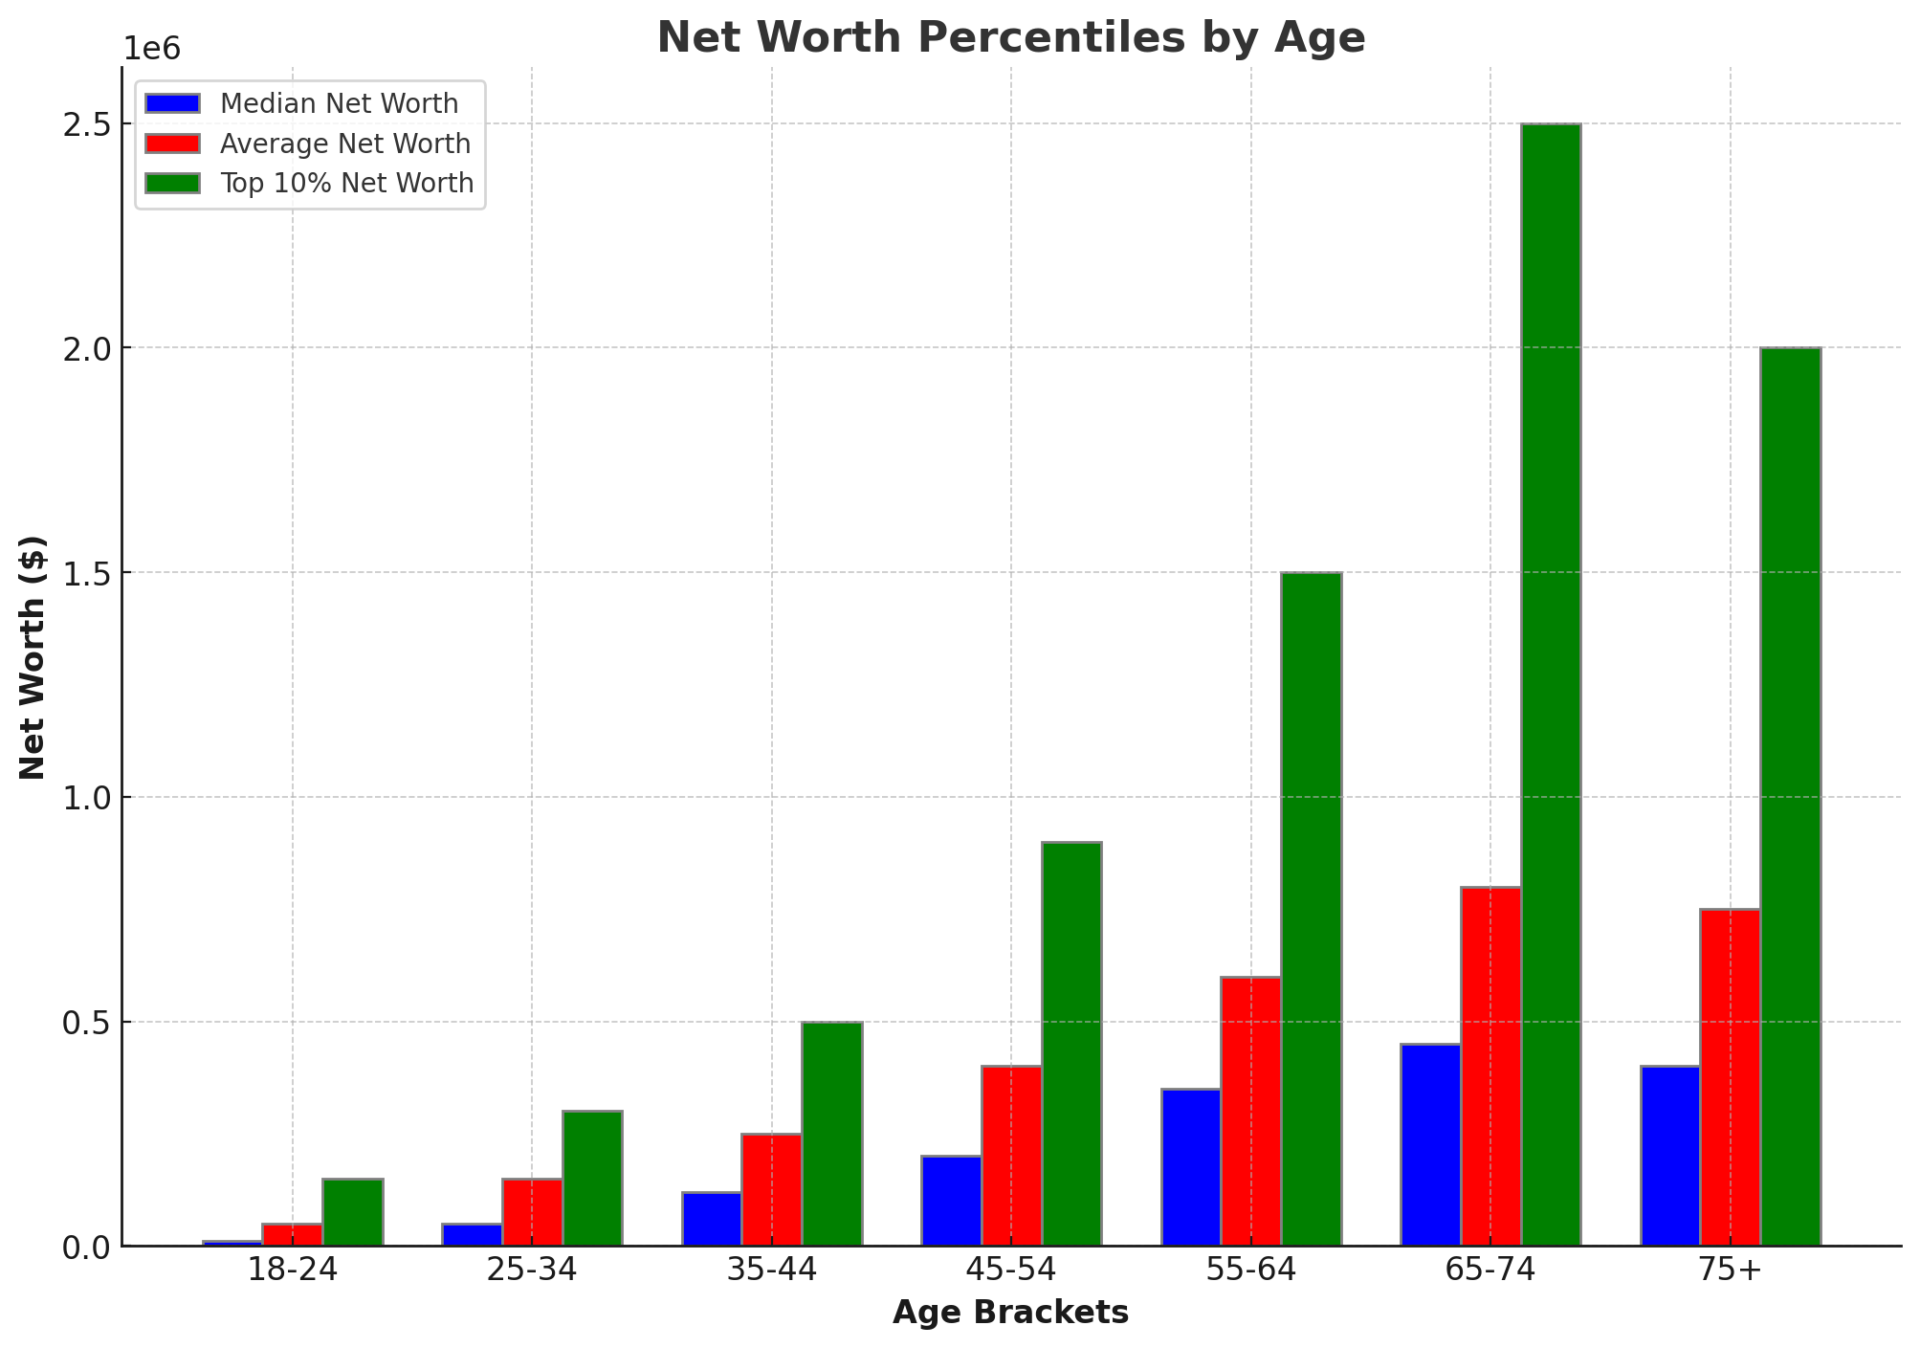
Wealth distribution in America is also a story of generational shifts. Net worth is a cumulative metric, meaning it naturally skews toward older populations who have had decades to benefit from compounding interest and mortgage pay-downs.
- The "Baby Boomer" Dominance: As of 2026, Baby Boomers still hold the largest share of American wealth. Their entry into the housing market in the 1970s and 1980s, combined with the 40-year bull market in bonds and stocks, created a "perfect storm" for wealth accumulation.
- The Millennial Catch-up: For years, data suggested Millennials were far behind previous generations at the same age. However, between 2020 and 2026, Millennial wealth has surged, largely due to the "Great Wealth Transfer" (inheritance) and their eventual entry into homeownership.
- The Racial Wealth Gap: Historical data from the U.S. Census Bureau shows that white households hold significantly higher median net worth than Black or Hispanic households. While some progress has been made in business ownership rates, the gap in inherited wealth and homeownership continues to drive overall distribution trends.
Factors Influencing Distribution in 2026
As we look at the current state of wealth, several modern factors are influencing the trajectory:
- Technology and Automation: The concentration of wealth in the tech sector continues to create "super-wealthy" individuals in the top 0.1%, while automation threatens the wage-earning potential of the bottom 50%.
- Fiscal and Monetary Policy: The shift from "easy money" (low interest rates) to a "neutral rate" environment has changed how wealth is built. It is no longer enough to simply "own anything"; asset selection now matters more, which typically favors sophisticated investors with access to professional management.
- Tax Policy: Debates surrounding the "Step-up in Basis" on inherited assets and the taxation of unrealized capital gains remain central to the political discourse in 2026, as these policies directly impact the ability of the top 1% to transfer wealth across generations.
Practical Guidance: Assessing Your Place in the Distribution
Understanding national trends is useful for context, but individual financial planning requires a localized focus. To see where you stand and how to improve your position in the net worth distribution, consider the following actions:
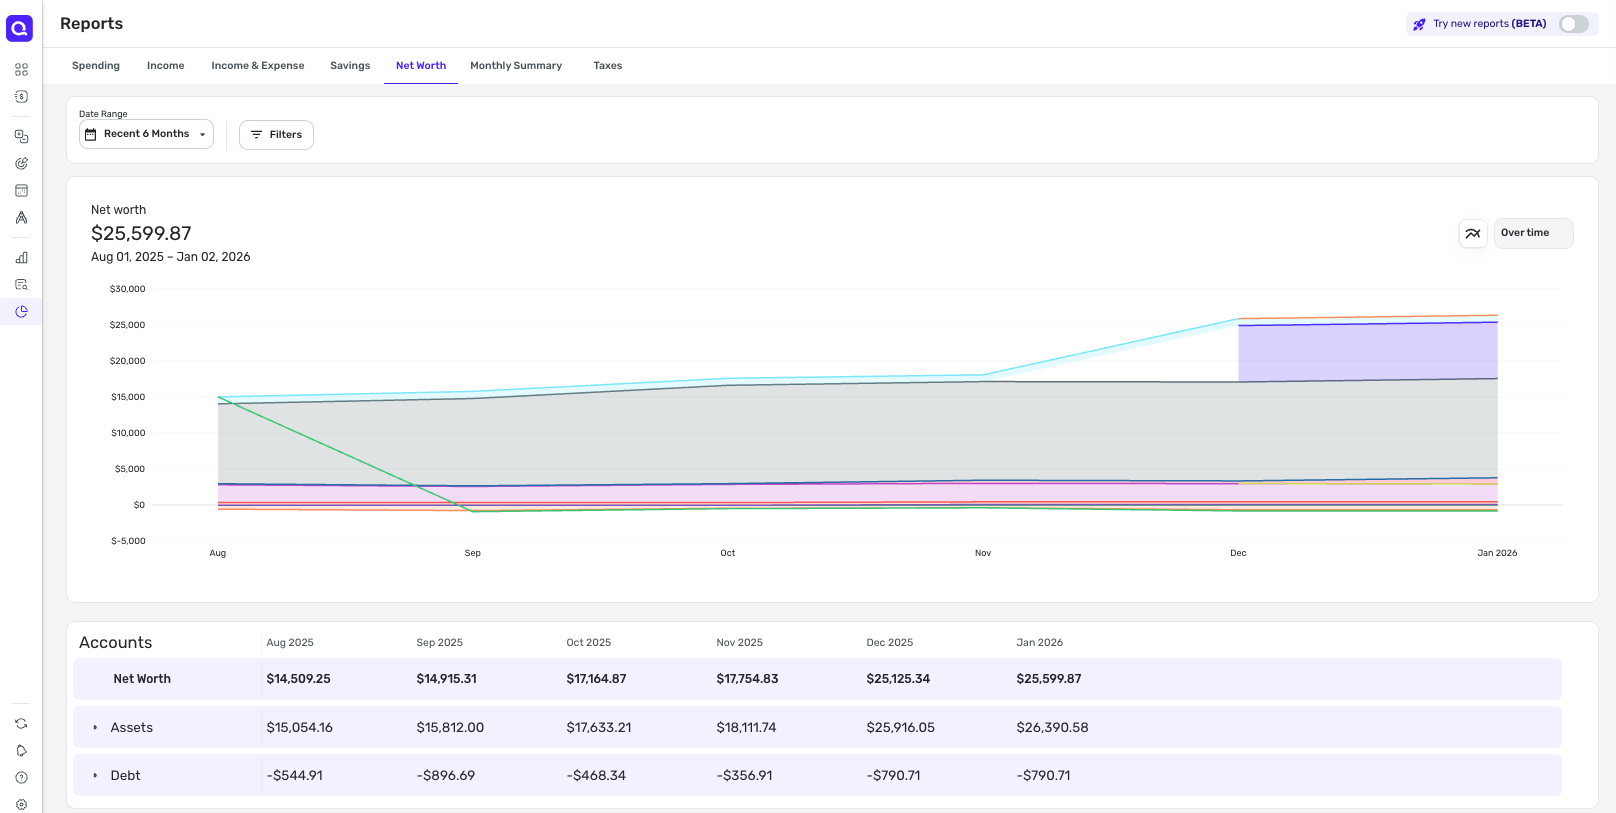
- Calculate Your Personal Net Worth Quarterly: Use the standard formula (Total Assets - Total Liabilities). Tracking this over time is more important than your nominal salary.
- Diversify Beyond Real Estate: If your home is your only major asset, you are vulnerable to local market downturns. Aim to move into the "Next 9%" or "Top 10%" behavior by increasing exposure to diversified equities or low-cost index funds.
- Focus on Debt Quality: Not all debt is equal. The bottom 50% often hold "bad debt" (high-interest credit cards), while the top 10% often use "strategic debt" (low-interest mortgages or margin loans) to acquire appreciating assets.
- Monitor Federal Reserve Data: For those interested in deeper research, the Federal Reserve Interactive Charts provide the most granular look at how your specific demographic or wealth bracket is performing relative to the rest of the country.
FAQ: American Net Worth Distribution
What is the median net worth in the United States in 2026?
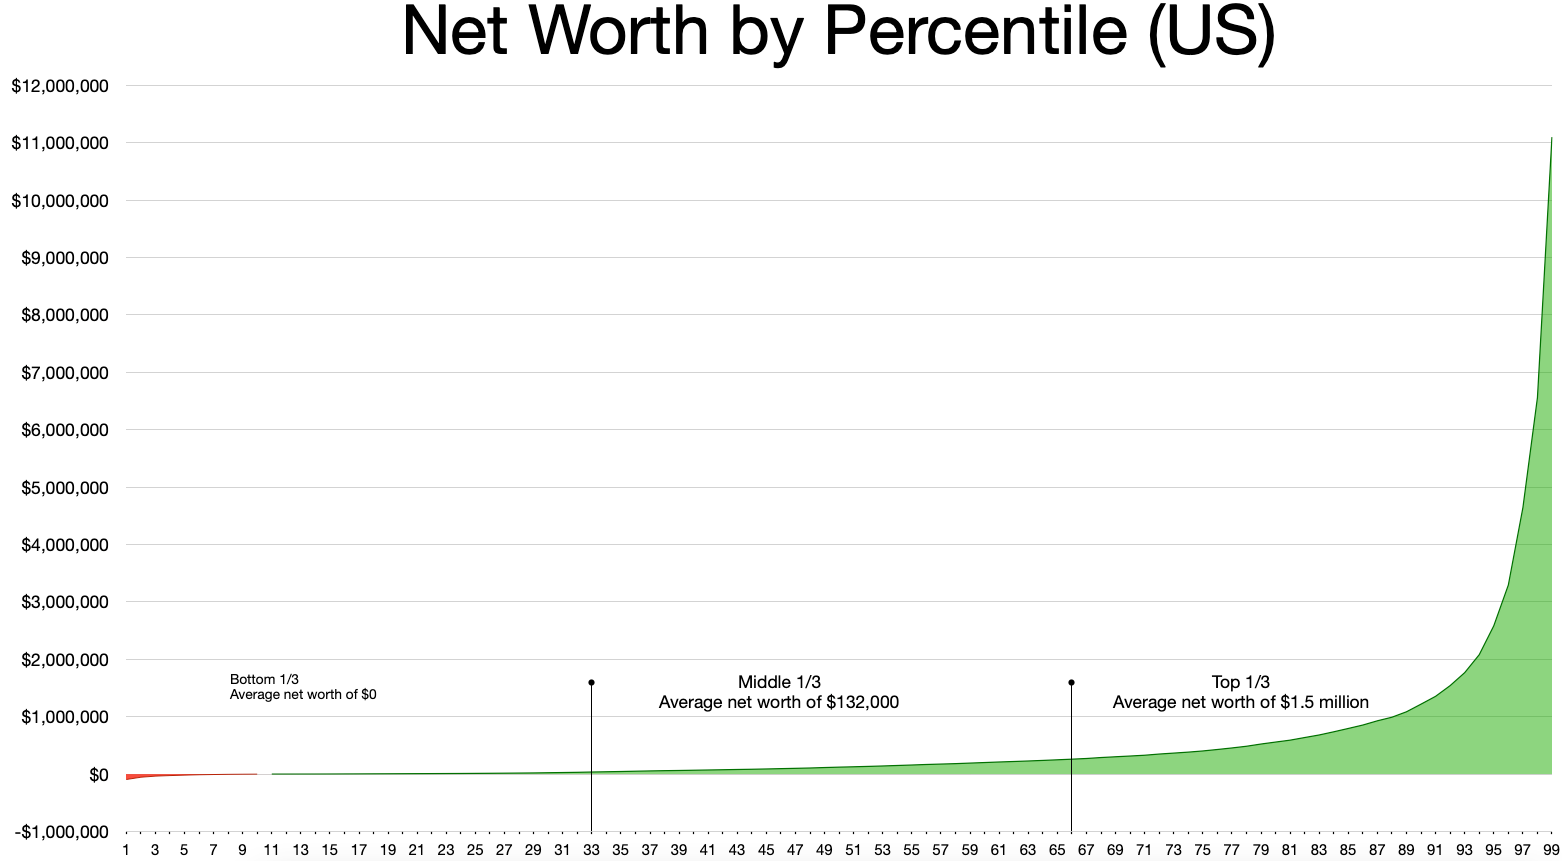
The median net worth (the "middle" household) is estimated to be approximately $210,000 to $230,000. This figure is significantly lower than the average net worth, which is skewed upward by the multi-billion-dollar fortunes of the top 0.1%.
Why does the top 1% hold so much more wealth than the bottom 50%?
The disparity is primarily due to asset ownership types. The top 1% own assets that compound in value (stocks, businesses), whereas the bottom 50% spend a larger portion of their income on depreciating assets or non-recoverable costs like rent and interest.
Has wealth inequality improved since the 2020 pandemic?
In relative terms, the bottom 50% saw the largest percentage growth in wealth between 2020 and 2024 due to wage increases and stimulus. However, in absolute dollar terms, the gap between the top and the bottom has reached record levels because a 10% gain on $100 million is vastly larger than a 50% gain on $10,000.
How does education affect net worth distribution?
Data consistently shows that households headed by an individual with a college degree or higher hold a disproportionate share of wealth. As of 2026, the "education gap" is one of the strongest predictors of whether a household will move from the bottom 50% into the top 10% over their lifetime.
What is the "Great Wealth Transfer"?
This refers to the ongoing transfer of an estimated $68 trillion to $84 trillion from the Baby Boomer generation to their heirs (Gen X and Millennials). This transfer is expected to peak between 2025 and 2035 and will likely solidify current wealth distribution patterns within certain family lineages.
Next Steps for Wealth Building
To navigate the current distribution landscape, individuals should focus on transitioning from a "consumer" mindset to an "owner" mindset. The data from 1989 to 2026 proves that labor alone rarely keeps pace with the appreciation of capital. By prioritizing the acquisition of income-producing assets and minimizing high-interest consumer liabilities, households can work toward moving into higher wealth percentiles, regardless of the broader national trend toward concentration at the top.