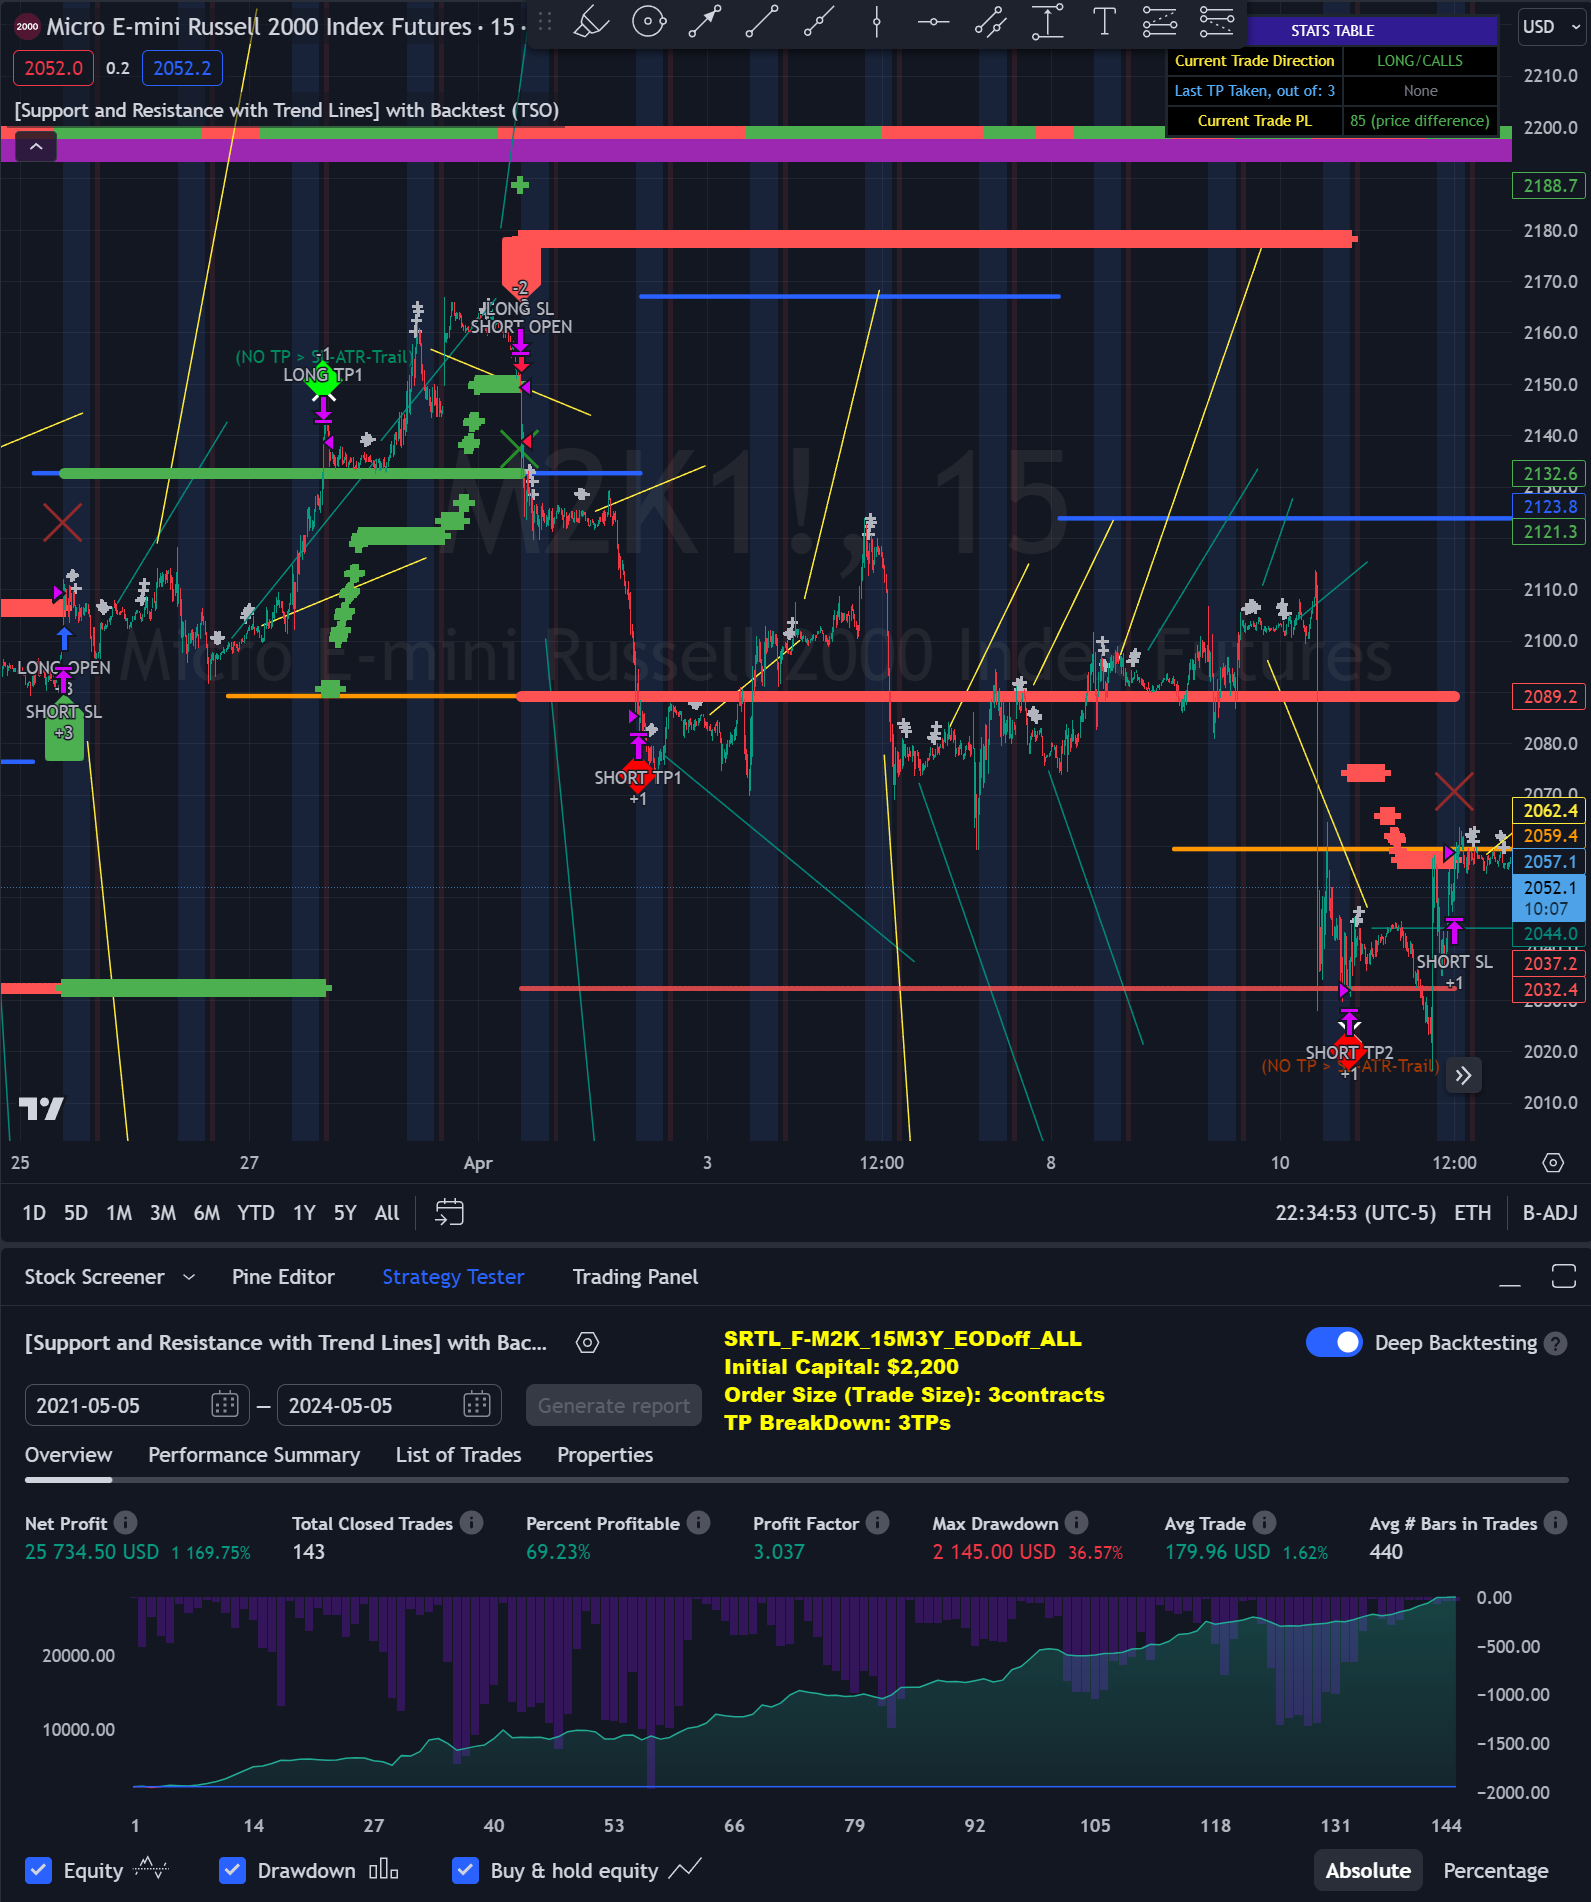
In the 2026 trading landscape, identifying key price levels remains the cornerstone of technical analysis. The three most effective support and resistance indicators on TradingView are Support and Resistance Levels with Breaks (LuxAlgo), Pivot Points Standard, and the Volume Profile (Visible Range). While each offers unique insights, the Volume Profile is widely considered the best choice for traders seeking institutional-grade accuracy based on actual market participation.
Support and resistance (S/R) are conceptual "floors" and "ceilings" where price movement tends to stall or reverse. In 2026, with the proliferation of high-frequency trading and algorithmic execution, static lines on a chart are often insufficient. Traders now require dynamic tools that can adapt to volatility and distinguish between a minor price fluctuation and a major structural shift. TradingView’s Pine Script ecosystem has evolved to provide highly sophisticated tools that automate this process, reducing the subjective "art" of drawing lines and replacing it with data-driven precision.
1. Support and Resistance Levels with Breaks (LuxAlgo)
The "Support and Resistance Levels with Breaks" indicator by LuxAlgo has become a staple for retail traders on TradingView. Its primary appeal lies in its ability to automatically identify pivot highs and lows and project them as horizontal levels. Unlike manual drawing, which is prone to human bias, this indicator uses a consistent algorithmic approach to find structural significance in price action.
How the Algorithm Works
The indicator identifies "Fractal" or "Pivot" points—specific candles that are higher or lower than a defined number of surrounding candles (the "Lookback Period"). Once a significant pivot is identified, the indicator extends a line forward. If the price closes beyond this line, the indicator signals a "break," often color-coded to show whether the level was broken to the upside or downside.
In the 2026 version of this script, the logic has been refined to include "Pivot Strength." This allows traders to filter out minor noise. For example, a strength setting of 5 requires a high or low to be the extreme point across 10 candles (5 on each side), ensuring that only meaningful structural levels are displayed.
Key Features and Customization
- Intraday vs. Swing Settings: Users can adjust the lookback period to suit their timeframe. A shorter lookback (e.g., 5-10) is ideal for scalping, while a longer lookback (e.g., 50+) identifies major weekly or monthly levels.
- Broken Level Visualization: One of its standout features is the ability to show "historical" levels that have been broken. This is vital for the concept of "S/R Flip," where a former resistance level becomes new support.
- Alert Integration: Because it is a community-driven script, it integrates seamlessly with TradingView’s alert system, allowing traders to receive notifications the moment a major level is breached.
Pros and Cons
The main advantage is automation. It eliminates the "analysis paralysis" of deciding which wick to connect. However, its primary drawback is that it relies purely on price action. It does not account for the volume behind the move, which can sometimes lead to "fakeouts" where a level appears significant but lacks the liquidity to hold.
2. Pivot Points Standard
Pivot Points Standard is a foundational technical indicator used by professional and institutional traders for decades. It is an objective mathematical calculation based on the previous period's high, low, and close. Because so many market participants use these exact levels, they often become self-fulfilling prophecies, leading to high-probability bounces or breakouts.
The Mathematical Foundation
The "Standard" pivot point (P) is the average of the previous High, Low, and Close. From this central point, multiple levels of support (S1, S2, S3) and resistance (R1, R2, R3) are calculated.
- Resistance 1 (R1): (P × 2) - Low
- Support 1 (S1): (P × 2) - High
In 2026, TradingView's version of this indicator allows for various calculation methods, including Fibonacci, Woodie, and Camarilla. The Fibonacci method is particularly popular among crypto and forex traders, as it applies golden ratio retracements (0.382, 0.618) to the pivot ranges.
Strategic Application
Pivot Points are unique because they are "leading" indicators. Unlike moving averages which lag behind price, Pivot levels are plotted at the start of the trading session and do not change. This provides a clear roadmap for the day.
- The Central Pivot Range (CPR): Many advanced traders use a variation of Pivot Points to identify the CPR. A narrow range suggests an impending breakout, while a wide range suggests a sideways, range-bound market.
- Timeframe Flexibility: The indicator can be set to Daily, Weekly, Monthly, or even Yearly pivots. Institutional "big money" often respects Yearly and Monthly pivots, making them essential for long-term investors.
Why It Remains Relevant in 2026
Despite the rise of AI-driven trading, the math behind Pivot Points remains a constant. It provides a "common ground" for the market. When price approaches a Daily R2 level simultaneously with a major psychological round number, the probability of a reversal increases significantly. Its objectivity is its greatest strength; two traders using Pivot Points Standard will see the exact same levels, which is not true for most other S/R tools.
3. Volume Profile (Visible Range & Fixed Range)
The Volume Profile is widely considered the most "scientific" way to identify support and resistance. While other indicators look at where price went, the Volume Profile looks at how much business was actually transacted at those prices. This reveals the "Value Area"—the price range where the majority of market participants agree on a fair price.
Core Components of the Volume Profile
To use the Volume Profile effectively, traders must understand three critical terms:
- Point of Control (POC): The single price level with the highest traded volume for the selected time period. This is the ultimate "magnet" for price.
- High Volume Nodes (HVN): Peaks in the profile representing heavy participation. These act as strong support or resistance because they represent areas of high liquidity.
- Low Volume Nodes (LVN): Valleys in the profile where very little trading occurred. Price tends to "zip" through these areas quickly because there is no significant interest to slow it down.
Visible Range (VPVR) vs. Fixed Range
TradingView offers several versions of this tool. The Visible Range (VPVR) automatically calculates the profile for whatever data is currently shown on your screen. As you zoom out, the profile updates. The Fixed Range tool allows the trader to select a specific move—for example, a single impulsive rally—to see where the buyers were most active during that specific trend.
Theoretical Depth: The Auction Market Theory
The Volume Profile is based on Auction Market Theory, which views the market as a continuous auction. Support is not just a line where price bounced; it is a "High Volume Node" where buyers were willing to step in with significant capital. If the price returns to an HVN, those same participants (or others who missed the first move) are likely to react again. Conversely, resistance is a level where sellers overwhelmed buyers in terms of total contract volume.
Practical Limitations
The Volume Profile is a "premium" feature on TradingView, meaning it typically requires a paid subscription (Pro, Pro+, or Premium). Additionally, it requires "Tick Data" to be accurate. For markets like Forex, which are decentralized, the volume shown is "tick volume" (frequency of price changes) rather than "real volume" (actual dollars/contracts traded), though tick volume remains a highly reliable proxy in 2026.
Comprehensive Comparison of Top S/R Indicators
The following table compares these three indicators across key metrics to help you determine which fits your specific trading style.
| Feature | LuxAlgo S/R Levels | Pivot Points Standard | Volume Profile (VPVR) |
|---|---|---|---|
| Primary Data Source | Price Action (Pivots) | Mathematical Formula | Transactional Volume |
| Indicator Type | Lagging/Reactive | Leading/Predictive | Leading/Real-time |
| Best For | Visualizing structure & breaks | Daily targets & exits | Finding institutional value |
| Ease of Use | High (Visual/Auto) | Medium (Math-heavy) | Low (Requires training) |
| Reliability | Medium (Subject to noise) | High (Institutional use) | Very High (Data-driven) |
| Market Suitability | All Markets | Highly Liquid (FX/Indices) | Stocks, Futures, Crypto |
| TradingView Plan | Free (Community Script) | Free (Standard) | Paid (Pro/Premium) |
The "Best Choice" Verdict: Volume Profile
While all three indicators have merit, the Volume Profile is the best choice for the serious trader in 2026.
The reasoning is simple: Price is an advertisement, but Volume is the truth. A price level identified by a Pivot Point or a LuxAlgo script tells you that the price stopped there, but it doesn't tell you why. It could have stopped because of a low-liquidity "thin" market where a single small order moved the needle.
The Volume Profile, however, identifies levels where millions—or billions—of dollars were exchanged. When the price returns to a High Volume Node, you are interacting with a level where the market has already proven there is significant "interest." This provides a much higher level of conviction for entering trades. Furthermore, the Volume Profile allows you to see "Volume Gaps." If the price breaks through a resistance level and enters a Low Volume Node, you know there is very little "friction" to stop the price from reaching the next High Volume Node, allowing for much more accurate take-profit targets.
When to Choose the Alternatives
- Choose LuxAlgo if you are a beginner who struggles with identifying market structure. It is an excellent "educational" tool that trains your eyes to see where the market is making higher highs and lower lows.
- Choose Pivot Points if you are a day trader focusing on major indices (like the S&P 500) or heavy Forex pairs. The mathematical objectivity is essential for fast-paced environments where you need pre-determined exit levels before the market opens.
Practical Strategy: Combining the Tools for "Confluence"
Expert traders rarely rely on a single indicator. The highest probability trades occur at "Confluence Zones"—areas where multiple indicators agree.
- Identify the Value: Use the Volume Profile to find the Point of Control (POC) for the week.
- Verify the Math: Check if a Pivot Point (like the Daily R1 or Weekly Pivot) aligns with that POC.
- Confirm the Structure: Use the LuxAlgo S/R indicator to see if that level has acted as a "flip" zone in the recent past.
If a High Volume Node, a Weekly Pivot, and a historical Resistance level all sit at the same price (e.g., $150.00), that level becomes a "High Conviction" zone. Your stop-loss can be placed just on the other side of this cluster, providing a superior risk-to-reward ratio.
Frequently Asked Questions
Do these indicators work on all timeframes?
Yes, but their significance varies. Pivot Points are most effective on 5-minute to 1-hour charts for intraday levels. The Volume Profile is effective on all timeframes, though the "Visible Range" version is particularly powerful on Daily and 4-hour charts to see the "Big Picture" of where whales are accumulating or distributing assets.
Does the LuxAlgo indicator repaint?
Most versions of the "Support and Resistance Levels with Breaks" are designed not to repaint. However, because it relies on "Pivots," the level may only appear after a few candles have closed to confirm the high or low. It is important to check the specific script settings on TradingView to ensure "non-repainting" logic is selected.
Why is Volume Profile a paid feature?
Volume Profile requires the processing of massive amounts of historical tick data. TradingView incurs significant server costs to calculate these profiles in real-time across thousands of assets. For many traders, the cost of a Pro subscription is offset by the increased accuracy and reduced "stop-outs" provided by the Volume Profile.
Can I use these for cryptocurrency trading?
Absolutely. In fact, the Volume Profile is arguably more important in crypto than in any other market. Because crypto markets are highly speculative, price often overshoots traditional "lines." Finding where the actual "Value Area" resides helps crypto traders avoid buying at the top of a "blow-off top" or selling at the bottom of a "liquidity grab."
Which pivot calculation is best: Standard or Fibonacci?
There is no "best," only "most used." The Standard calculation is the most common among floor traders and traditional equity traders. The Fibonacci version is preferred by retail traders and those in the crypto space. It is often helpful to display both; if a Standard R1 and a Fibonacci 0.618 level overlap, the level is considered exceptionally strong.
Next Actions for Traders
To implement these tools effectively in your 2026 trading routine, start by adding the Pivot Points Standard to your chart—it is free and provides immediate objective levels. If you find yourself struggling to identify where price is "stuck," experiment with the LuxAlgo community script. Finally, if you are ready to move toward a professional methodology, consider upgrading to a TradingView plan that includes the Volume Profile.
Always remember that indicators are tools to assist your decision-making, not a replacement for it. Use these S/R indicators to define your "Area of Interest," and then look for price action confirmation—such as a pin bar or engulfing candle—before executing a trade. Consistent risk management remains the only "indicator" that guarantees long-term survival in the markets.
Disclaimer: Trading involves significant risk. Technical indicators are based on historical data and do not guarantee future results. Consult with a certified financial advisor before making investment decisions.